. 2023 Oct 13;14(1):6431.
doi: 10.1038/s41467-023-42069-w.

PPTC7 maintains mitochondrial protein content by suppressing receptor-mediated mitophagy

Affiliations

PPTC7 maintains mitochondrial protein content by suppressing receptor-mediated mitophagy

Natalie M Niemi et al. Nat Commun. .

Abstract

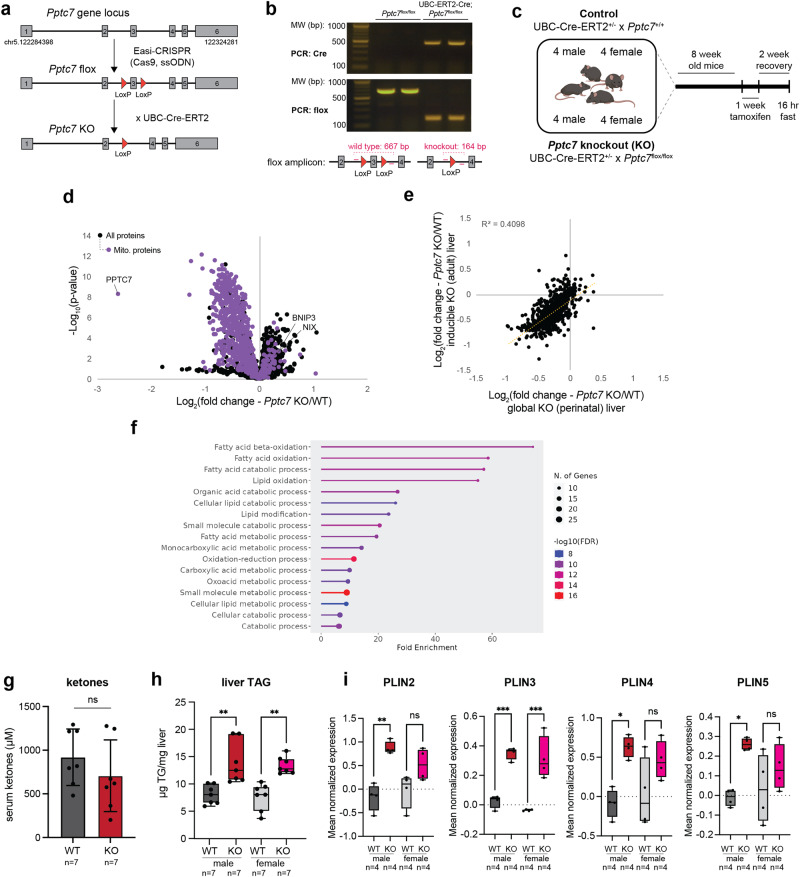
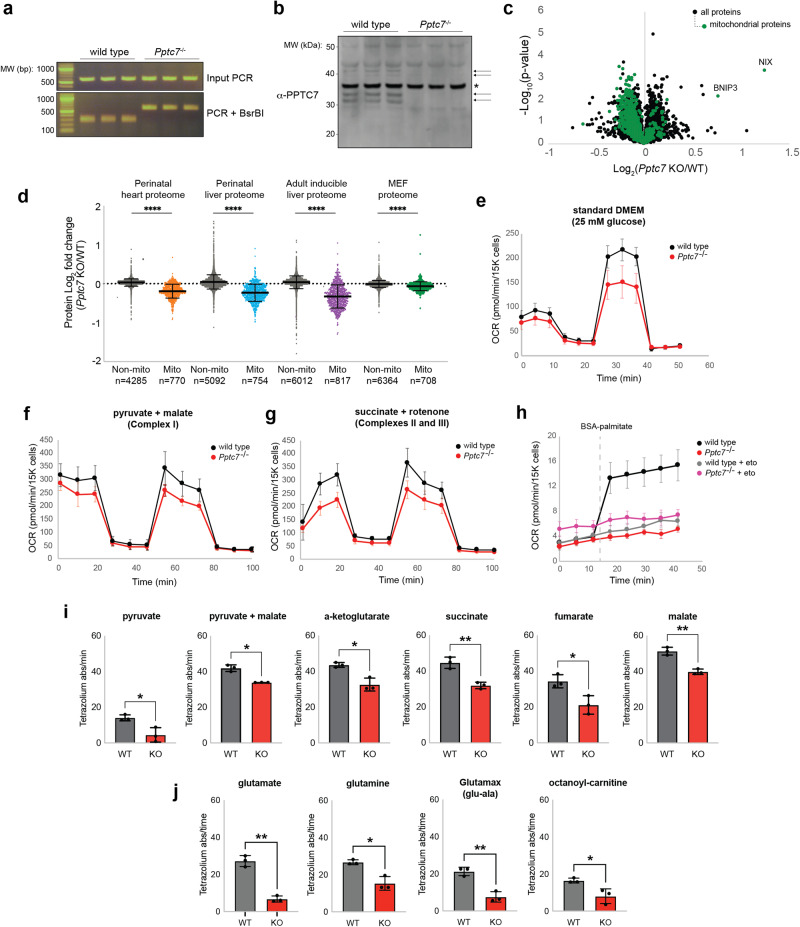
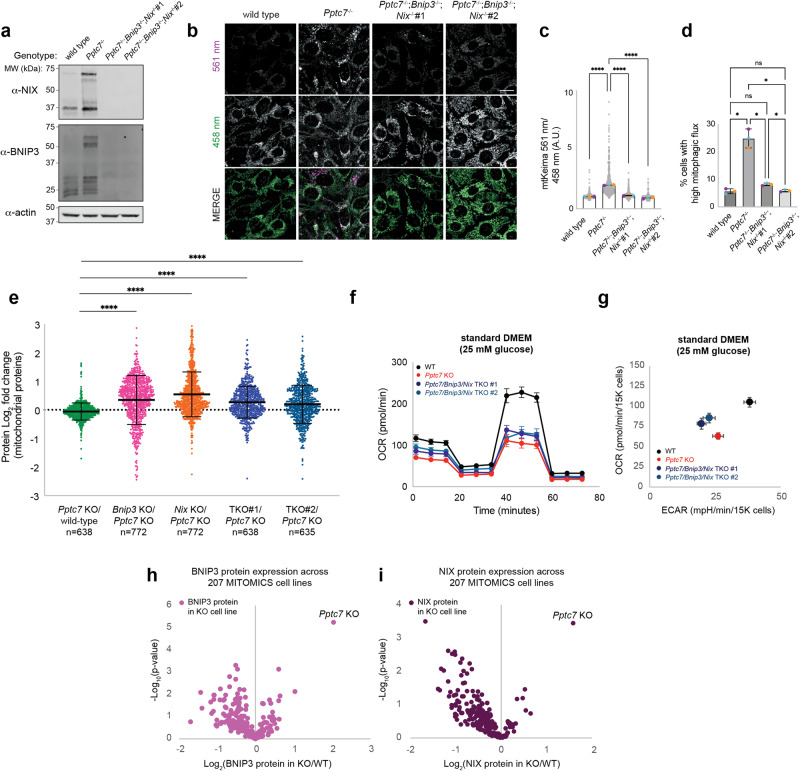
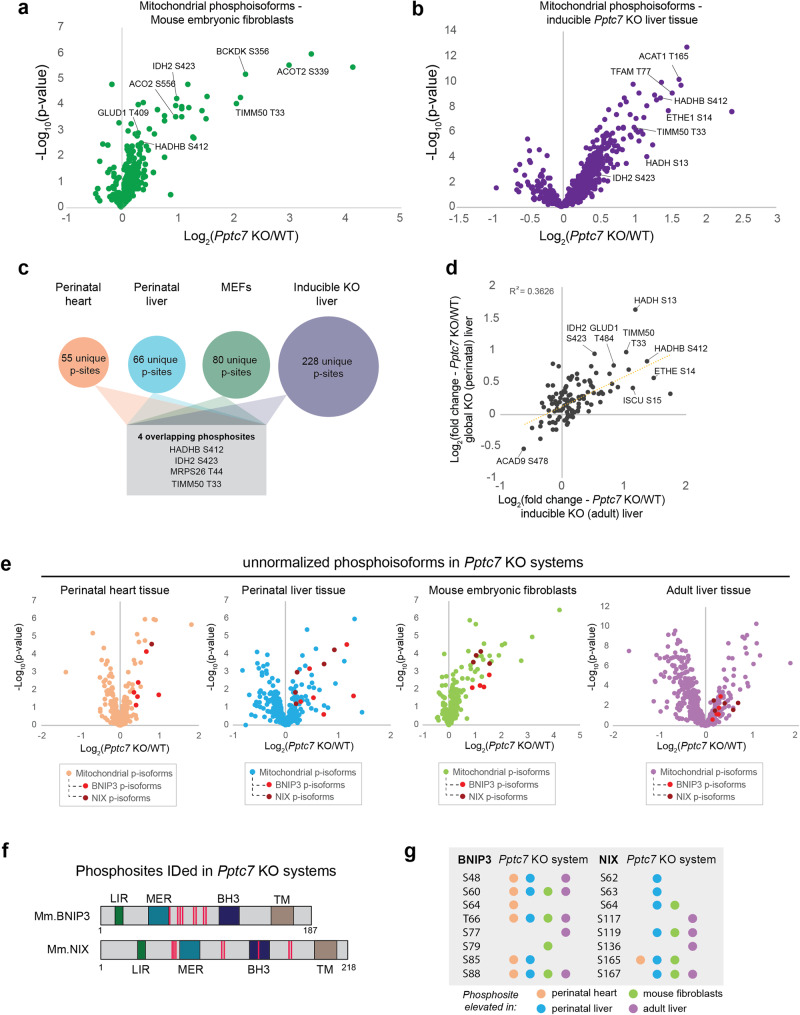
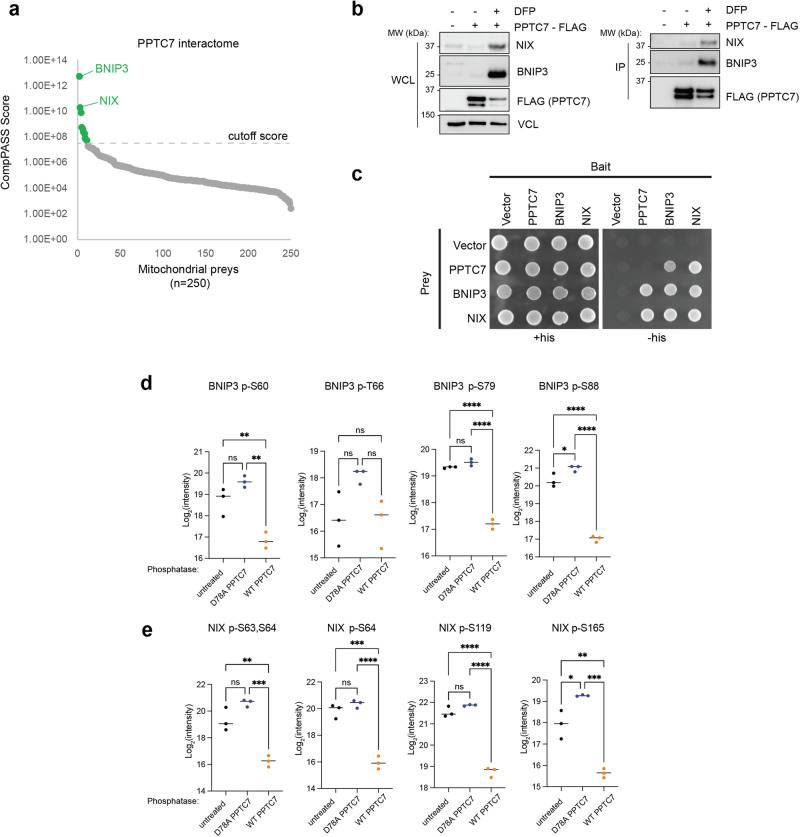
PPTC7 is a resident mitochondrial phosphatase essential for maintaining proper mitochondrial content and function. Newborn mice lacking Pptc7 exhibit aberrant mitochondrial protein phosphorylation, suffer from a range of metabolic defects, and fail to survive beyond one day after birth. Using an inducible knockout model, we reveal that loss of Pptc7 in adult mice causes marked reduction in mitochondrial mass and metabolic capacity with elevated hepatic triglyceride accumulation. Pptc7 knockout animals exhibit increased expression of the mitophagy receptors BNIP3 and NIX, and Pptc7-/- mouse embryonic fibroblasts (MEFs) display a major increase in mitophagy that is reversed upon deletion of these receptors. Our phosphoproteomics analyses reveal a common set of elevated phosphosites between perinatal tissues, adult liver, and MEFs, including multiple sites on BNIP3 and NIX, and our molecular studies demonstrate that PPTC7 can directly interact with and dephosphorylate these proteins. These data suggest that Pptc7 deletion causes mitochondrial dysfunction via dysregulation of several metabolic pathways and that PPTC7 may directly regulate mitophagy receptor function or stability. Overall, our work reveals a significant role for PPTC7 in the mitophagic response and furthers the growing notion that management of mitochondrial protein phosphorylation is essential for ensuring proper organelle content and function.


Conflict of interest statement

The authors declare the following competing interests: J.J.C. is a consultant for Thermo Fisher Scientific, 908 Devices, and Seer. The remaining authors declare no competing interests.

Figures

Fig. 1
Fig. 1. Acute knockout of Pptc7 compromises hepatic mitochondrial content in adult mice.
a Schematic for the generation of a conditional Pptc7 model to allow global, inducible knockout in adult mice. b Genotyping verification of Cre-mediated excision of Pptc7 exon 3 after tamoxifen treatment. This experiment is representative of at least three independent experiments. c Schematic for the 16-plex proteomic analysis of liver tissue from control (UBC-ERT2-Cre;Pptc7+/+) or experimental (UBC-ERT2-Cre;Pptc7flox/flox) animals (n = 4 for each sex and genotype for 16 total). d Proteomic analysis of non-mitochondrial (black dots) and mitochondrial (purple dots) proteins across 16 liver samples from mice aged 11 weeks, 2 weeks post-tamoxifen treatment. Data were analyzed via a two-sided Student’s t test with log-transformed p-values reported on the y-axis. e Linear regression of the fold changes in mitochondrial proteins (n = 599) identified in both adult inducible KO liver (y-axis, n = 8 control and n = 8 knockout tissues) and perinatal KO liver (x-axis, n = 5 wild-type and n = 5 knockout tissues). Regression coefficient reported as R2. f GO term analysis of non-mitochondrial proteins that are altered in Pptc7 knockout inducible liver (n = 8 knockout tissues) relative to wild-type (n = 8 control tissues) animals. g Serum ketones quantified in male wild-type (WT, n = 7 animals, gray bar) and Pptc7 knockout (KO, n = 7 animals, red bar) mice aged 11 weeks, 2 weeks post-tamoxifen treatment, fasted overnight. A two-sided Student’s t test was performed, ns = not significant. The bar graph center denotes the mean of the dataset; error bars represent standard deviation. h Liver triacylglycerol content (TAG) in male and female wild-type (WT (n = 7 male WT, dark gray bar and n = 7 female WT, light gray bar) and Pptc7 KO (n = 7 KO male, red bar and n = 7 KO female, pink bar) mice aged 11 weeks, 2 weeks post-tamoxifen treatment, fasted overnight. Ordinary one-way ANOVA performed. **p < 0.01. p-value for male WT v. KO comparison = 0.0012; p-value for female WT v. KO comparison = 0.0013. The box plot extends from the 25th to 75th percentile; whiskers stretch from minimum to maximum datapoints. The line in the middle of the box plot represents the median. i Protein expression, quantified via LC-MS, of perilipin proteins (PLINs) in male and female wild-type (WT) and Pptc7 KO mice aged 11 weeks, 2 weeks post-tamoxifen treatment. Ordinary one-way ANOVA performed. ***p < 0.001, **p < 0.01, *p < 0.05, ns = not significant. For PLIN2 measurements, p-value for male WT v. KO = 0.0013; p-value for female WT v. KO comparison = 0.0887; for PLIN3 measurements, p-value for male WT v. KO = 0.0003; p-value for female WT v. KO comparison = 0.0002; for PLIN4 measurements, p-value for male WT v. KO = 0.01323; p-value for female WT v. KO comparison = 0.1889; for PLIN5 p-value for male WT v. KO = 0.0161; p-value for female WT v. KO comparison = 0.5668. The box plot extends from the 25th to 75th percentile; whiskers stretch from minimum to maximum datapoints. The line in the middle of the box plot represents the median. Source data are provided as a Source data file. Figure 1c was created with BioRender.
Fig. 2
Fig. 2. Pptc7 knockout causes cell-autonomous decreases in mitochondrial protein content leading to broad metabolic defects.
a Genotyping of wild-type (WT) and Pptc7 KO mouse embryonic fibroblasts (MEFs). This experiment is representative of at least three independent experiments. b PPTC7 endogenous protein expression in WT and KO MEFs. Notably, PPTC7 runs as a set of two doublets, marked by arrows. A non-specific band (*) serves as a loading control. This experiment is representative of at least three independent experiments. c Proteomic analysis of non-mitochondrial (black dots) and mitochondrial (green dots) proteins from triplicate WT and Pptc7 KO MEFs. Data were analyzed via a two-sided Student’s t test with log-transformed p-values reported on the y-axis. The mitophagy receptors BNIP3 and NIX are highlighted. d Fold changes of mitochondrial proteins across all Pptc7 KO systems including perinatal heart (orange) and liver (blue), inducible adult liver (purple), and MEFs (green). In each system, loss of Pptc7 causes significant decreases in the mitochondrial proteome relative to non-mitochondrial proteins (shown in gray for all systems; total n for each dataset listed below graph). ****p < 0.0001, ordinary one-way ANOVA; multiple comparisons across each paired WT and KO dataset. e Seahorse analysis of a mitochondrial stress test performed on primary wild-type (black dots) and Pptc7 KO (red dots) MEFs grown in standard DMEM supplemented with 25 mM glucose. Data are represented as the mean of n = 9 replicate wells per condition; error bars represent standard deviation. f, g Seahorse analysis of a mitochondrial stress test performed on primary permeabilized wild-type (black dots) and Pptc7 KO (red dots) MEFs given pyruvate and malate (f) or succinate and rotenone (g). The data are represented as the mean of n = 8 replicate wells per condition. Error bars represent standard deviation. h Seahorse analysis of wild-type (black or gray dots) or Pptc7 KO (red and pink dots) MEFs given BSA-palmitate in the presence or absence of of 4 μM etomoxir. Data are represented as the mean of n = 8 replicate wells per condition. Error bars represent standard error of the mean. i, j BioLog analysis of permeabilized wild-type (gray bars) and Pptc7 KO (red bars) MEFs given various TCA cycle substrates (i) or amino acids and fatty acids (j). For BioLog analysis, each datapoint represents an independent well on the BioLog plate (n = 3), with the mean shown. Error bars represent standard deviation. *p < 0.05, **p < 0.01; BioLog data was analyzed using a two-sided Student’s t test. Source data are provided as a Source data file.
Fig. 3
Fig. 3. Pptc7 knockout causes excessive BNIP3- and NIX-mediated mitophagy.
a Western blot of BNIP3 and NIX expression in wild-type, Pptc7 KO, and two Pptc7/Bnip3/Bnip3l triple knockout (TKO) MEF cell lines. Actin is shown as a load control. This experiment is representative of at least three independent experiments. b Representative images of wild-type, Pptc7 KO, and each TKO cell line expressing the mitophagy reporter mt-Keima. Mitochondria imaged at 458 nm are at physiological pH but those imaged at 561 nm reflect acidic mitochondria undergoing mitophagy. c Quantification of mt-Keima imaging. Each gray dot represents the ratio of mitochondrial fluorescence from a single cell; n = 123 for wild type, n = 152 for Pptc7 KO, n = 123 for TKO#1, n = 143 for TKO#2. Blue, orange, and purple dots represent averages from three independent biological experiments. The bar graphs intersect the mean of these three experiments; error bars represent standard deviation. ****p < 0.0001. mt-Keima microscopy data was analyzed by ordinary one-way ANOVA. d Quantification of mt-Keima as analyzed by FACS. Blue, orange, and purple dots represent averages from three independent biological replicates. The bar graphs intersect the mean of replicates; error bars represent standard deviation. mt-Keima microscopy data was analyzed by a Brown-Forsythe and Welch ANOVA. *p < 0.05, ns = not significant. For WT v. KO, p = 0.0341, for KO v. TKO #1, p = 0.0428, for KO v. TKO #2, p = 0.0332. e Proteomic analysis of mitochondrial proteins in Pptc7 knockout relative to wildtype (green), Bnip3 knockout relative to Pptc7 knockout (pink), Nix knockout relative to Pptc7 knockout (orange), and two independent Pptc7/Bnip3/Bnip3l TKO lines normalized to Pptc7 KO (dark blue and light blue). Each dot represents a quantified mitochondrial protein; n of each experiment is reported below the x-axis. Proteomic data was analyzed by ordinary one-way ANOVA. ****p < 0.0001. Mean and standard deviation shown. f Seahorse analysis of a mitochondrial stress test in immortalized wild type (WT, black), Pptc7 KO (red), TKO #1 (dark blue), TKO #2 (teal) were assayed in Seahorse DMEM supplemented with 25 mM glucose. Data are represented as the mean of n = 22 replicate wells per condition; error bars represent standard deviation. g Seahorse analysis of basal oxygen consumption rates (OCR) and extracellular acidification (ECAR). Mean of n = 8 independent wells shown; error bars represent standard deviation. h, i BNIP3 (h) and NIX (i) protein expression across 207 cell lines harboring monogenic mutations in genes encoding mitochondria-localized proteins. Data were analyzed via a two-sided Student’s t test with log-transformed p-values reported on the y-axis. Only Pptc7 KO increases both BNIP3 and NIX significantly across this dataset. Source data are provided as a Source data file.
Fig. 4
Fig. 4. Phosphoproteomic analysis of Pptc7 KO systems reveals candidate substrates, including BNIP3 and NIX.
a, b Protein-normalized mitochondrial phosphoisoforms in Pptc7 KO MEFs (green, a) and inducible adult liver tissue from mice aged 11 weeks, 2 weeks post-tamoxifen treatment (purple, b). Data were analyzed via a two-sided Student’s t test with log-transformed p-values reported on the y-axis. Select phosphorylation sites highlighted. c Analysis of phosphoproteomes across systems reveals many unique (i.e., only identified in a single experimental system) phosphosites (p-sites), with four significantly upregulated phosphosites identified across all four experimental systems (shown in gray box). d Linear regression analysis of overlapping phosphosites identified in perinatal liver tissue (y-axis) and inducible adult liver (x-axis). Select phosphorylation sites highlighted e Non-protein normalized mitochondrial phosphoisoforms were analyzed. Data were analyzed via a two-sided Student’s t test with log-transformed p-values reported on the y-axis. These results show BNIP3 and NIX have significantly elevated phosphorylation events across all tested model systems. f Cartoon schematic of primary sequence of mouse BNIP3 (top) and NIX (bottom). Numbers indicate total amino acids in proteins. Select domains are highlighted: LC3 Interaction Region (LIR, green), Minimal Essential Region (MER, teal), BH3-only domain (BH3, purple), and transmembrane domain (TM, brown). Phosphorylation sites identified in our analysis are shown as pink lines. g List of identified phosphorylation sites on BNIP3 and NIX. Phosphorylated amino acid is listed at left of each column. Colored circles indicate the phosphorylation event is significantly upregulated (Student’s t test, p < 0.05) in Pptc7 knockout tissues relative to controls in perinatal heart (orange), perinatal liver (blue), mouse embryonic fibroblasts (green), or adult mouse liver tissue (purple). Source data are provided as a Source data file.
Fig. 5
Fig. 5. PPTC7 interacts with and can dephosphorylate BNIP3 and NIX.
a Mitochondrial proteins that interact with PPTC7 after affinity purification-mass spectrometry analysis as performed in ref. . b Immunoprecipitation (IP) of FLAG-PPTC7 overexpressed in U2OS cells (right panels) with endogenous BNIP3 and NIX in basal conditions (middle column) or after treatment with 1 mM DFP to induce BNIP3 and NIX expression (right column). Input shown as whole cell lysate (WCL) at right; anti-vinculin (VCL) shown as a load control. This experiment is representative of at least three independent experiments. c Yeast two-hybrid analysis of PPTC7, BNIP3, and NIX as reciprocal baits and preys. Yeast were spotted on permissive (+his, left) or selective (-his, right) plates. d, e Phosphoproteomic analysis of BNIP3 (d) or NIX (e) phosphopeptides isolated from Pptc7 knockout mitochondrial fractions. Mitochondria were isolated from cells and split into n = 3 fractions for each treatment: untreated (black dots, left, n = 3 mitochondrial fractions), treated with catalytically inactive PPTC7 (D78A, blue dots, middle, n = 3 mitochondrial fractions) or active PPTC7 (orange dots, right, n = 3 mitochondrial fractions). The log2 intensity of each phosphopeptide is shown; each dot represents a biological replicate from one of the nine independently treated mitochondrial fractions outlined above. Lines represent median. Ordinary one-way ANOVA performed. ****p < 0.0001, ***p < 0.001, **p < 0.01, *p < 0.05, ns = not significant. p-values for WT v. D78A are as follows: BNIP3 S60 p = 0.001, BNIP3 T66 p = 0.1145, BNIP3 S79 p < 0.0001, BNIP3 S88 p < 0.0001, NIX S63,64 p = 0.0003, NIX S64 p < 0.0001, NIX S119 p < 0.0001, NIX S165 p = 0.0001. Source data are provided as a Source data file.

Update of

References

    1. Song J, Herrmann JM, Becker T. Quality control of the mitochondrial proteome. Nat. Rev. Mol. Cell Biol. 2021;22:54–70. - PubMed
    1. Pickles S, Vigié P, Youle RJ. Mitophagy and quality control mechanisms in mitochondrial maintenance. Curr. Biol. 2018;28:R170–R185. - PMC - PubMed
    1. Wang L, Qi H, Tang Y, Shen H-M. Post-translational modifications of key machinery in the control of mitophagy. Trends Biochem. Sci. 2020;45:58–75. - PubMed
    1. Kravic B, et al. In mammalian skeletal muscle, phosphorylation of TOMM22 by protein kinase CSNK2/CK2 controls mitophagy. Autophagy. 2018;14:311–335. - PMC - PubMed
    1. Walter C, et al. Global kinome profiling reveals DYRK1A as critical activator of the human mitochondrial import machinery. Nat. Commun. 2021;12:4284. - PMC - PubMed

Publication types

Substances