. 2023 Oct 13;14(1):6457.
doi: 10.1038/s41467-023-42341-z.

Endothelial discoidin domain receptor 1 senses flow to modulate YAP activation

Affiliations

Endothelial discoidin domain receptor 1 senses flow to modulate YAP activation

Jiayu Liu et al. Nat Commun. .

Abstract

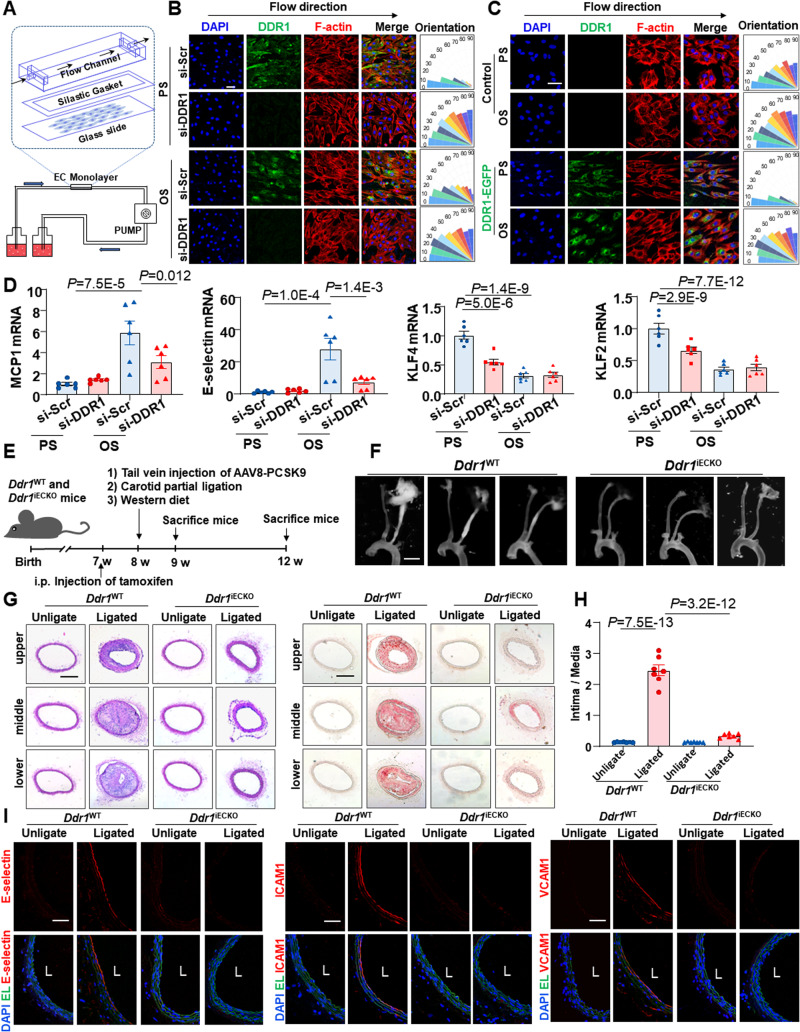
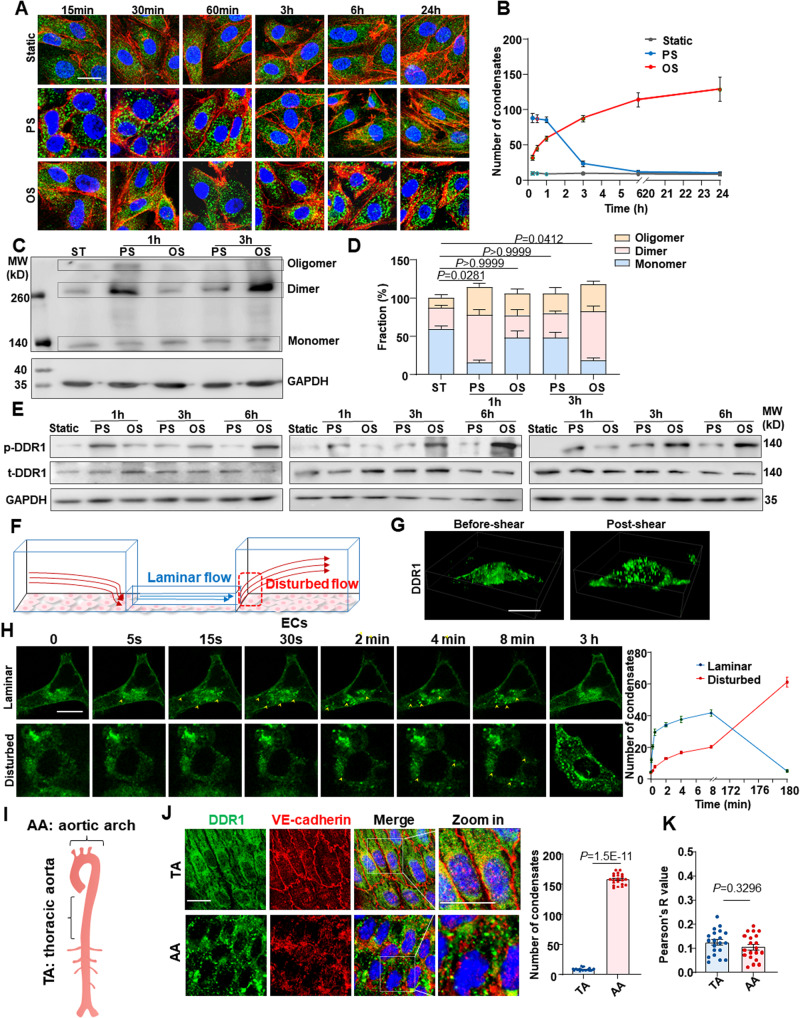
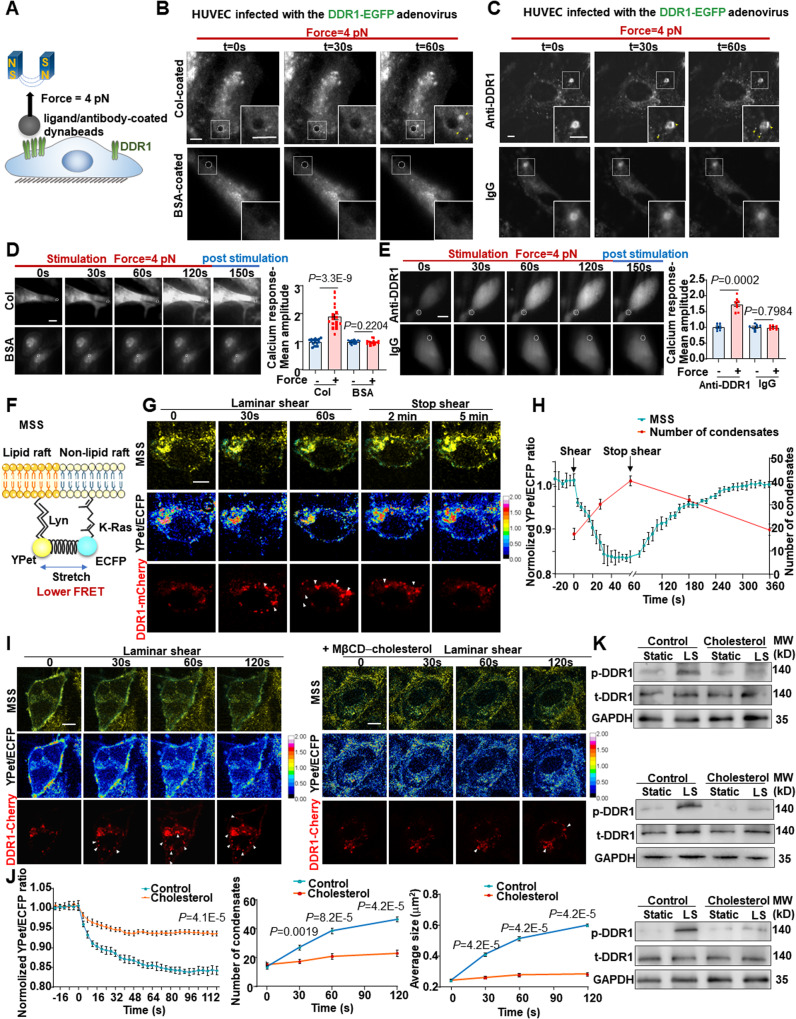
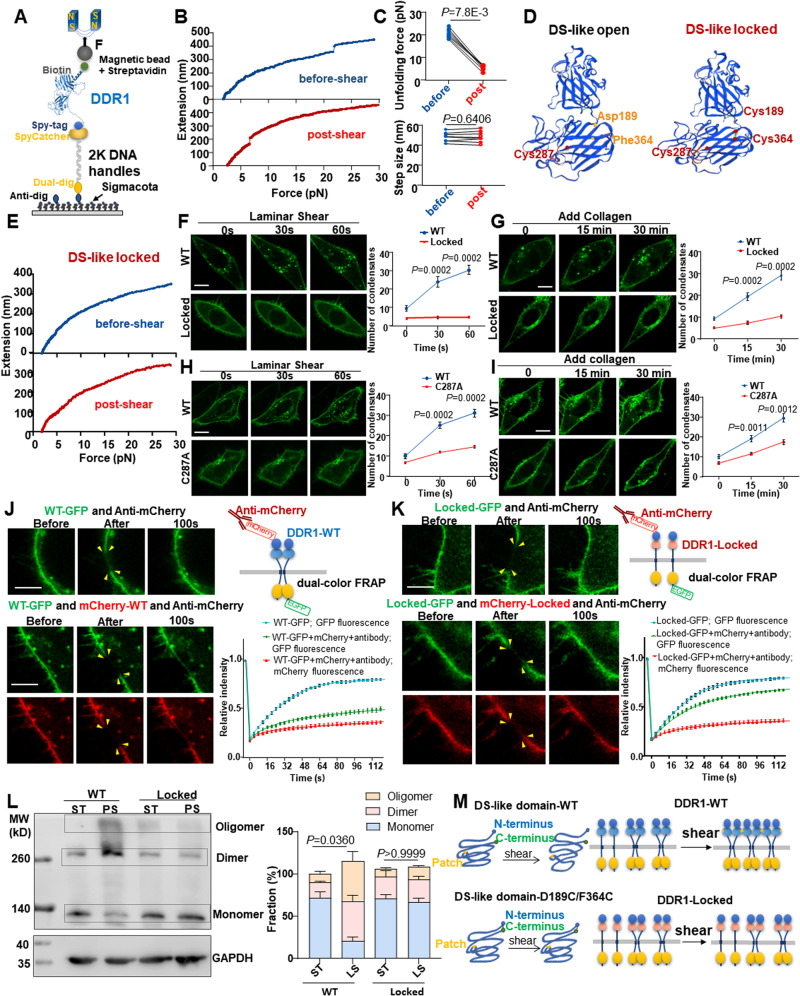
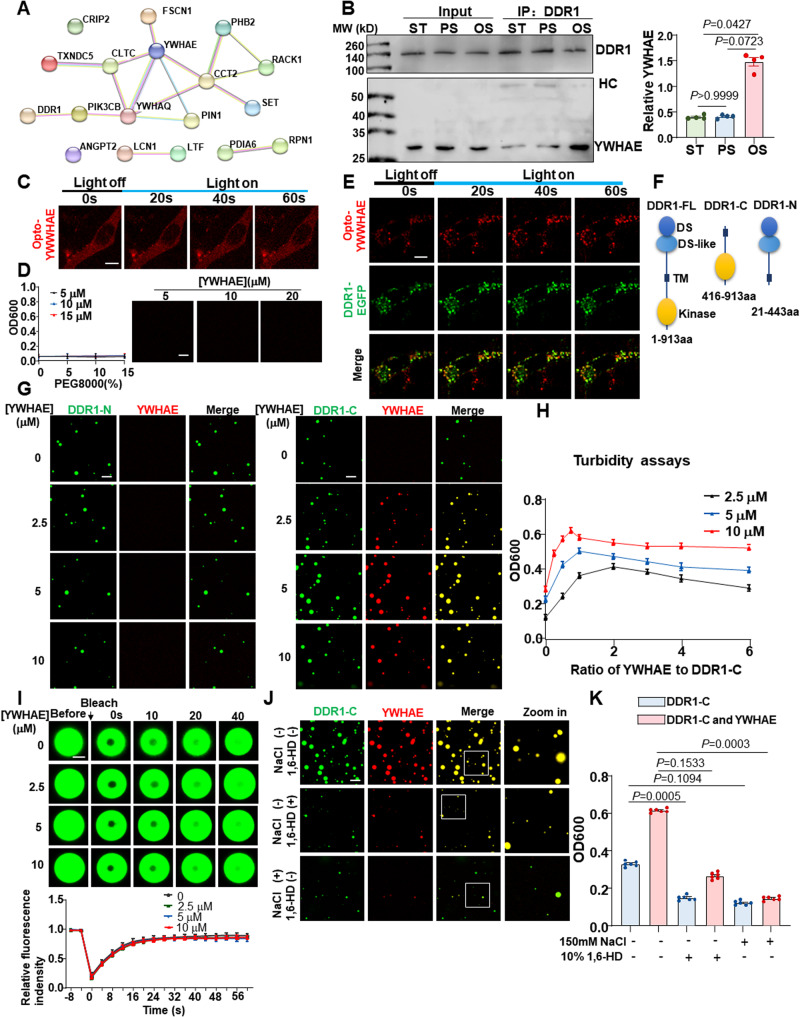
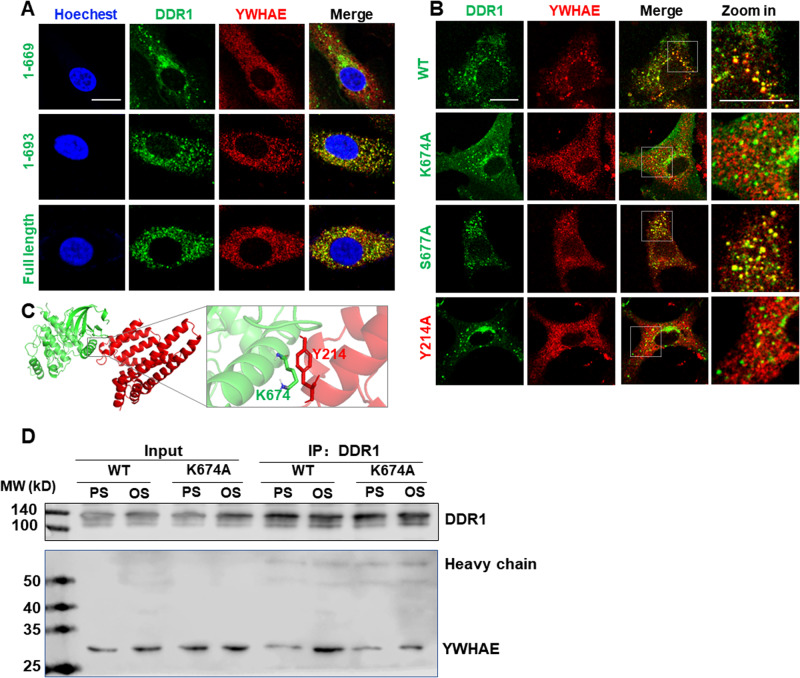
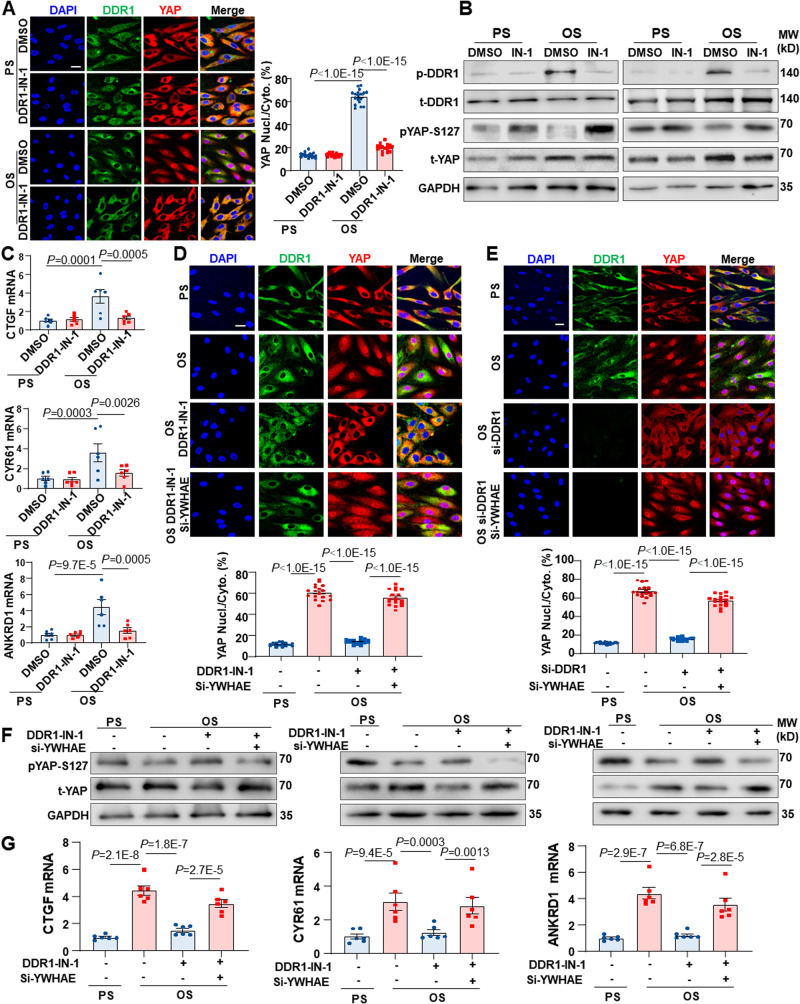
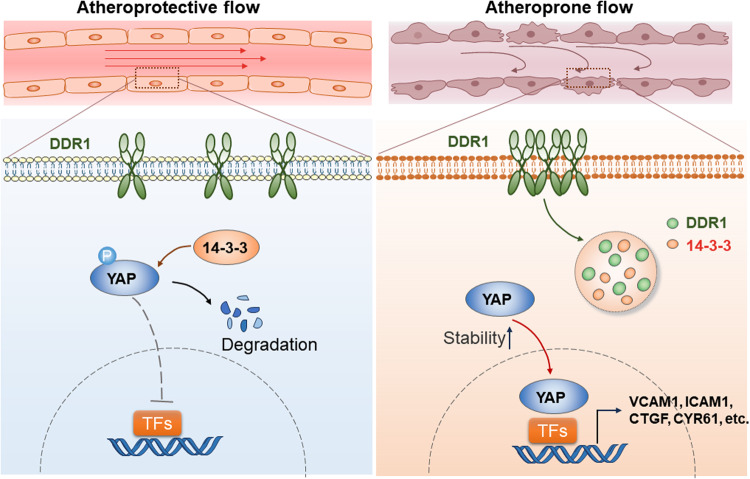
Mechanotransduction in endothelial cells is critical to maintain vascular homeostasis and can contribute to disease development, yet the molecules responsible for sensing flow remain largely unknown. Here, we demonstrate that the discoidin domain receptor 1 (DDR1) tyrosine kinase is a direct mechanosensor and is essential for connecting the force imposed by shear to the endothelial responses. We identify the flow-induced activation of endothelial DDR1 to be atherogenic. Shear force likely causes conformational changes of DDR1 ectodomain by unfolding its DS-like domain to expose the buried cysteine-287, whose exposure facilitates force-induced receptor oligomerization and phase separation. Upon shearing, DDR1 forms liquid-like biomolecular condensates and co-condenses with YWHAE, leading to nuclear translocation of YAP. Our findings establish a previously uncharacterized role of DDR1 in directly sensing flow, propose a conceptual framework for understanding upstream regulation of the YAP signaling, and offer a mechanism by which endothelial activation of DDR1 promotes atherosclerosis.


Conflict of interest statement

The authors declare no competing interests.

Figures

Fig. 1
Fig. 1. DDR1 mediates the endothelial cell responses to fluid shear stress.
A Schematic diagram of parallel-plate flow chamber. B Left: Immunofluorescence of F-actin and DDR1 in HUVECs that were transfected with DDR1-siRNA or scrambled control siRNA (si-Scr) and subjected to PS or OS for 24 h. HUVECs were all grown on gelatin-coated glass slide. Right: Quantification of alignment by measuring the orientation angle. n = 9 images from 3 biological replicates. Scale bar: 50 μm. C Left: Immunofluorescence of F-actin and DDR1 in NIH3T3 cells that were infected with DDR1-EGFP adenovirus and subjected to PS or OS for 24 h. Right: Quantification of alignment by measuring the orientation angle. n = 9 images from 3 biological replicates. Scale bar: 50 μm. D Quantitative RT-PCR (qRT-PCR) to detect anti-inflammatory transcription factors (KLF2 and KLF4) and proinflammatory genes (MCP1 and E-selectin) in HUVECs treated as in (B). Data were analyzed by two-way ANOVA followed by Tukey’s multiply test. E Schematic diagram of experimental design. F Representative gross images of carotid arteries from the indicated mice at 4 weeks after partial ligation. Scale bar: 2 mm. 3 different positions of carotid artery are showed, and the definitions of upper, middle, and lower are consistent with anatomical position. G Representative H&E and Oil red O staining of neointima in the left common carotid arteries from the Ddr1 WT and Ddr1iECKO mice at 4wk after ligation. Scale bar: 200 μm. H Quantification of the atherosclerotic lesion area. n = 7 mice. The most severe atherosclerotic lesion of the left common carotid artery was counted. Data were analyzed by two-way ANOVA followed by Tukey’s multiply test. I Representative Immunofluorescence staining of E-selectin, ICAM1, and VCAM1 in cross-sections of the left common carotid arteries from the Ddr1 WT and Ddr1iECKO mice at 1 week post-operation. Scale bar: 50 μm. Data were expressed as the means ± SEM.
Fig. 2
Fig. 2. Shear stress induces DDR1 activation and formation of liquid-like biomolecular condensates.
A Representative immunofluorescence of DDR1 in HUVECs subjected to PS or OS for six time periods (15 min, 30 min, 1 h, 3 h, 6 h and 24 h). HUVECs were grown on gelatin-coated glass slide. B Quantification of DDR1 condensates in (A), n = 60 images from 6 biological replicates. Data were expressed as the means ± SD. C Non-reducing SDS-PAGE to detect DDR1 oligomerization in HUVECs subjected to PS or OS for indicated time. D Quantification of the fraction of DDR1 monomer, dimer and oligomer, which was normalized to GAPDH and performed using ImageJ based on the analysis of the gray band intensity. n = 4 biological replicates. Data were expressed as the means ± SEM and analyzed by Kruskal-Wallis test with Dunn’s test. P value, ratio of DDR1 dimers and polymers to total DDR1. E Western blotting to assess DDR1 phosphorylation in HUVECs subjected to PS or OS for indicated time. 3 biological replicates were presented. F Schematic diagram of 3D microfluidic vascular model to produce disturbed or laminar flow. G Three-dimensional imaging of DDR1 droplets in HUVECs responding to laminar flow for 2 min. H Left: time-lapse images of HUVECs infected with DDR1-EGFP adenovirus, which seeded on gelatin-coated microfluidic chamber and subjected to laminar flow or disturbed flow for 3 h. DDR1 droplets were indicated by yellow arrows. Right: quantification of DDR1 condensates. n = 6 biological replicates. Data were expressed as the means ± SEM. I Schematic cartoon of aortic arch and thoracic aorta. J Left: En-face staining of DDR1 and VE-cadherin in the aortic arch and thoracic aorta of C57BL/6 wild-type mice. Right: quantification of DDR1 condensates. n = 20 images from 5 mice. K Colocalization analysis of DDR1 and VE-cadherin in (J). n = 20 images from 5 mice. Pearson’s R value (above threshold) was calculated by ImageJ Fiji software (Analyze-colocalization-coloc2). In (J, K), Data were all expressed as the means ± SEM analyzed by two-sided Mann–Whitney test. Scale bars, 20 μm.
Fig. 3
Fig. 3. DDR1 is a mechanosensor in endothelial cells.
A Schematic diagram of the magnetic tweezers assay. B, C Images of DDR1 condensates formation (yellow arrows) captured by total internal reflection fluorescence microscopy. HUVECs were infected with DDR1 adenovirus and incubated with collagen/ BSA-coated beads in (B), and incubated with anti-DDR1/IgG-coated beads in (C). Representative images of HUVECs loaded with Fluo-4AM dye and then incubated with collagen/ BSA-coated beads in (D), and anti-DDR1/IgG-coated beads in (E). Calcium responses were measured by calculating the fluorescent intensity of individual cells before (10 s), during (120 s), and after (30 s) stimulation. The position of dynabeads is indicated by white dashed circles. n = 16 cells from 4 biological replicates in (D). n = 8 cells from 4 biological replicates in (E). F Schematic diagram of a membrane-bound tension biosensor (MSS). MSS consists of a tension sensor module, which comprising an elastic spider silk protein inserted between ECFP and YPet, and two anchoring proteins. G The representative living cell images of YPet/ECFP emission ratio and DDR1-Cherry in EA.hy926 ECs subjected to laminar shear stress for 1 min and post-shear for 5 min. DDR1 droplets were indicated by white arrows. H The average time courses of FRET biosensors and quantification of number of DDR1 condensates in EA.hy926 ECs exposed to laminar shear stress. n = 9 biological replicates. I The representative living cell images of YPet/ECFP emission ratio and DDR1-Cherry in EA.hy926 ECs pretreated without or with cholesterol in complex with methyl-β-cyclodextrin (MβCD) (+MβCD-cholesterol). DDR1 droplets were indicated by white arrows. J Left: the average time courses of FRET biosensors in (I). Middle: quantification of number of DDR1 condensates in (I). Right: quantification of average condensate size in (I). n = 9 biological replicates. In (D, E and J), Data were all analyzed by two-sided Mann–Whitney test. K Western blotting to assess DDR1 phosphorylation in HUVECs subjected to laminar shear stress for 1 h or static. 3 biological replicates were presented. Data were all expressed as the means ± SEM. In (B, C), Scale bars, 5 μm. In (D, E, G and I), Scale bars, 10 μm.
Fig. 4
Fig. 4. The open conformation of DS-like domain is crucial for DDR1 mechanosensation.
A Schematic diagram of single-molecule magnetic tweezers measurements. B The representative force–extension curve of DDR1 extracellular domain protein pretreated without or with shear for 5 min. C Quantification of unfolding force and extension step size of DDR1 extracellular domain protein before- or post-shear. n = 7 biological replicates. Data were analyzed by Wilcoxon matched-pairs signed rank test (two-tailed). D Left: DDR1 extracellular domain crystal structure generated by SWISS-MODEL. Right: the expected structure of DS-like domain-locked mutant (D189C/F364C). E The representative force–extension curve of DDR1 locked mutant (D189C/F364C) pretreated without or with shear for 5 min. F Time-lapse images and quantification of DDR1 condensates in ECs transfected with DDR1 WT or locked mutant. G Live cell imaging and quantification of DDR1 WT or locked mutant in ECs after 10 μg/ml soluble collagen I stimulation. H Time-lapse images and quantification of DDR1 condensates in ECs transfected with DDR1 WT or C287A mutant. I Live cell imaging and quantification of DDR1 WT or locked mutant in ECs after 10 μg/ml soluble collagen I stimulation. In (FI), data were expressed as the means ± SEM and analyzed by two-tailed Mann–Whitney test. n = 8 biological replicates. J, K Left: dual-color FRAP of EA.hy926 ECs expressing DDR1 (WT/locked)-GFP and mCherry-DDR1 (WT/locked). ECs were subjected to 5 min pre-shear before FRET. The photobleaching area was indicated by yellow arrows. Right: schematic of mCherry-DDR1 (WT/locked) and DDR1 (WT/locked)-GFP expressed in ECs treated with anti-mCherry, and quantification of fluorescent intensity of the photobleaching area. n = 24 cells from 6 biological replicates. L Left: non-reducing SDS-PAGE to detect DDR1 oligomerization in EA.hy926 ECs transfected with DDR1-WT or DDR1-D189C/F364C(locked), ECs were subjected to PS for 1 h or static. Right: Quantification of the fraction of DDR1 monomer, dimer and oligomer. n = 4 biological replicates. Data were expressed as the means ± SEM and analyzed by Kruskal-Wallis test with Dunn’s test. P value, ratio of DDR1 dimers and polymers to total DDR1. M Schematic diagram of DS-like domain structure and DDR1 oligomerization before- or post-shear. Data were all expressed as the means ± SEM. In (FI), Scale bars, 10 μm. In (J, K), Scale bars, 5 μm.
Fig. 5
Fig. 5. Shear stress induces the association of YWHAE with DDR1 to regulate DDR1 phase separation.
A Protein-Protein interaction analysis of the IP-MS identified proteins. B Left: Co-IP between DDR1 and YWHAE in HUVECs cultured under the static condition or subjected to PS or OS for 3 h. IP was performed with anti-DDR1 antibody. HC: Heavy chain. Right: quantification of YWHAE immunoprecipitated with DDR1. n = 4 biological replicates. Data were expressed as the means ± SEM and analyzed by Kruskal–Wallis test with Dunn’s test. C Representative images of NIH3T3 cells expressing Opto-YWHAE. Scale bar, 10 μm. D Left: turbidity of YWHAE solution at different concentrations. Data were expressed as the means ± SD. n = 5 biological replicates. Right: representative fluorescence microscopy images of YWHAE solution at different concentrations. Scale bar, 10 μm. E Representative images of NIH3T3 cells expressing both Opto-YWHAE and DDR1-EGFP. Scale bar, 10 μm. F Schematic representations of full-length DDR1 (DDR1-FL), 416-913aa of DDR1 (DDR1-C) and 21-443aa of DDR1 (DDR1-N). G Cell-free phase separation assay showing droplet formation of YWHAE-Cherry with DDR1 (416-913aa)-EGFP (DDR1-C, 5 μM) or DDR1 (21-443aa)-EGFP (DDR1-N, 5 μM) in indicated concentrations. Scale bar, 10 μm. In (C, E, and G), experiments were repeated 3 times independently with similar results. H Turbidity assays of LLPS of DDR1 (416-913aa)-EGFP at different concentrations and YWHAE/DDR1 molar ratio. Data were expressed as the means ± SEM. n = 5 biological replicates. I Up: representative fluorescence microscopy images of DDR1 droplets with different YWHAE concentrations. Down: quantification of fluorescent intensity of the area indicated by the dashed circle after FRAP experiment. n = 6 biological replicates. Data were expressed as the means ± SD. Scale bar, 1 μm. J Representative fluorescence microscopy images of droplets formed by DDR1 with YWHAE in the presence of 1,6-HD or 150 mM NaCl. Scale bar, 10 μm. K Turbidity of DDR1 and DDR1/YWHAE in the presence of 1,6-HD or 150 mM NaCl. n = 6 biological replicates. Data were expressed as the means ± SEM and analyzed by Kruskal–Wallis test with Dunn’s test.
Fig. 6
Fig. 6. DDR1 can interact with YWHAE by C-terminal domain.
A Live cell imaging of DDR1(1 ~ 669 aa), DDR1(1 ~ 693 aa), DDR1-FL and YWHAE-Cherry in EA.hy926 ECs. ECs were subjected to disturbed flow for 3 h in microfluidic chambers. B Live cell imaging of DDR1-WT/K674A/S677A and YWHAE-WT/Y214A in EA.hy926 ECs. ECs were subjected to disturbed flow for 3 h. C Structural details of the DDR1-YWHAE interfaces generated with PyMol, DDR1 and YWHAE residues are shown as green and red sticks, respectively. D Co-IP between DDR1 and YWHAE in EA.hy926 ECs subjected to PS or OS for 3 h. Cells were transfected with the indicated constructs. IP was performed with anti-DDR1 antibody. Scale bars, 20 μm. In (A, B, D), experiments were repeated 3 times independently with similar results.
Fig. 7
Fig. 7. DDR1-YWHAE is required for the shear stress-induced activation of YAP.
A Immunofluorescence and quantification of YAP localization in HUVECs. The cells were subjected to PS or OS for 24 h. n = 18 images from 3 biological replicates. 10 ~ 15 cells per image. B Western blotting to assess DDR1 and YAP phosphorylation in HUVECs subjected to PS or OS for 24 h. 3 biological replicates were presented. C Quantitative RT-PCR analysis of the expressions of YAP target genes CTGF, CYR61 and ANKRD1 in HUVECs treated as in (A). n = 6 biological replicates. D Immunofluorescence and quantification of YAP localization in HUVECs subjected to PS or OS for 24 h. The cells were transfected with siRNAs specific for YWHAE or scrambled siRNA and incubated with DDR1-IN-1 (10 μmol/L) or the control reagent (DMSO) for 3 h before being subjected to shear. n = 18 images from 3 biological replicates. 8 ~ 12 cells per image. E Immunofluorescence and quantification of YAP localization in HUVECs subjected to PS or OS for 24 h. The cells were transfected with si-DDR1, both si-DDR1 and si-YWHAE, or scrambled siRNA. n = 18 images from 3 biological replicates. 12 ~ 16 cells per image. F Western blotting to assess DDR1 and YAP phosphorylation in HUVECs treated as in (D). 3 biological replicates were presented. G Quantitative RT-PCR analysis of the expressions of YAP target genes CTGF, CYR61 and ANKRD1 in HUVECs treated as in (D). n = 6 biological replicates. Data were all analyzed by two-way ANOVA followed by Tukey’s multiply test. Scale bars, 20 μm. Data were all expressed as the means ± SEM.
Fig. 8
Fig. 8. DDR1 mechanosensation mediates the flow-activation of YAP and endothelial dysfunction.
The schematic depicts DDR1 as a primary mechanosensor in ECs, orchestrating cellular responses to shear flow. In areas of atheroprotective laminar flow, YAP phosphorylation prompts its binding with 14-3-3 proteins. This leads to YAP localization in the cytoplasm and subsequent degradation. Conversely, in atheroprone disturbed flow areas, DDR1 perceives the flow, initiating force-induced DDR1 oligomerization. This results in the formation of liquid-like biomolecular condensates involving DDR1 and 14-3-3. These condensates inhibit YAP phosphorylation and cytoplasmic sequestration, resulting in YAP activation and consequent endothelial dysfunction.

Similar articles

Cited by

References

    1. Hahn C, Schwartz MA. Mechanotransduction in vascular physiology and atherogenesis. Nat. Rev. Mol. Cell Biol. 2009;10:53–62. - PMC - PubMed
    1. Davis MJ, Earley S, Li YS, Chien S. Vascular mechanotransduction. Physiol. Rev. 2023;103:1247–1421. - PMC - PubMed
    1. Chiu JJ, Chien S. Effects of disturbed flow on vascular endothelium: pathophysiological basis and clinical perspectives. Physiol. Rev. 2011;91:327–387. - PMC - PubMed
    1. Li J, et al. Piezo1 integration of vascular architecture with physiological force. Nature. 2014;515:279–282. - PMC - PubMed
    1. Mehta V, et al. The guidance receptor plexin D1 is a mechanosensor in endothelial cells. Nature. 2020;578:290–295. - PMC - PubMed

Publication types

MeSH terms

Substances