

Differential diagnosis of neurodegenerative dementias with the explainable MRI based machine learning algorithm MUQUBIA
- PMID: 37833302
- PMCID: PMC10575864
- DOI: 10.1038/s41598-023-43706-6
Differential diagnosis of neurodegenerative dementias with the explainable MRI based machine learning algorithm MUQUBIA
Erratum in
-
Author Correction: Differential diagnosis of neurodegenerative dementias with the explainable MRI based machine learning algorithm MUQUBIA.Sci Rep. 2024 Jan 18;14(1):1603. doi: 10.1038/s41598-024-51435-7. Sci Rep. 2024. PMID: 38238461 Free PMC article. No abstract available.
Abstract
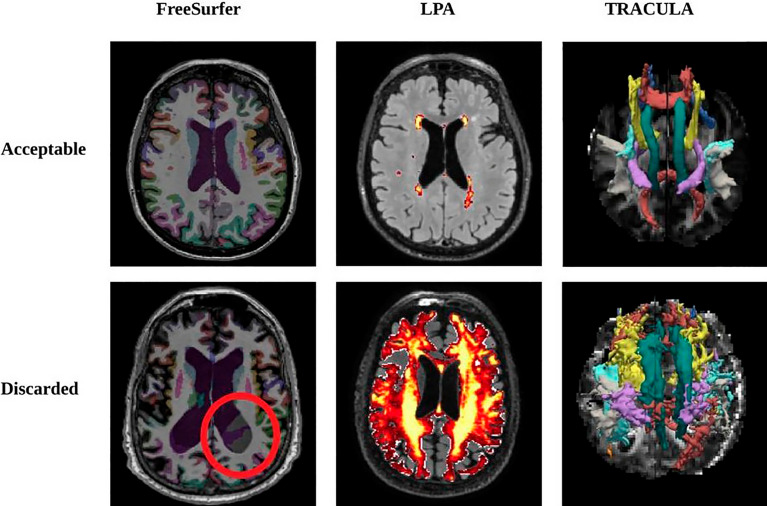
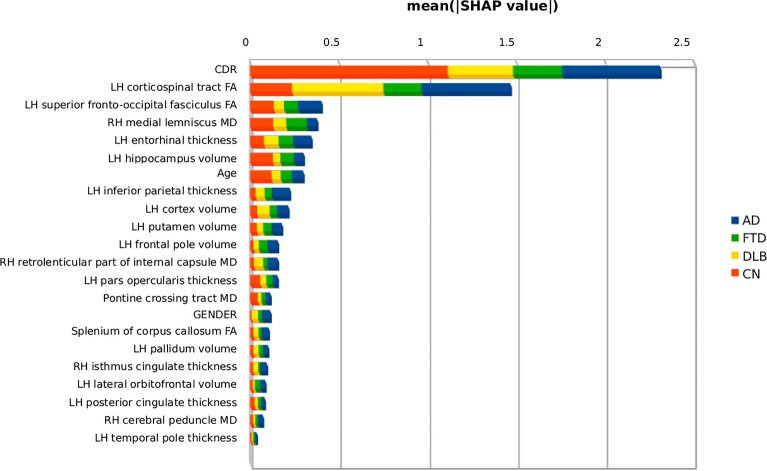
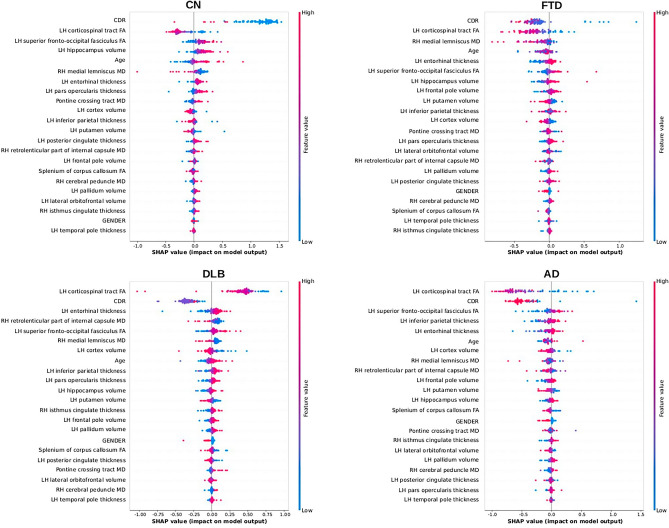
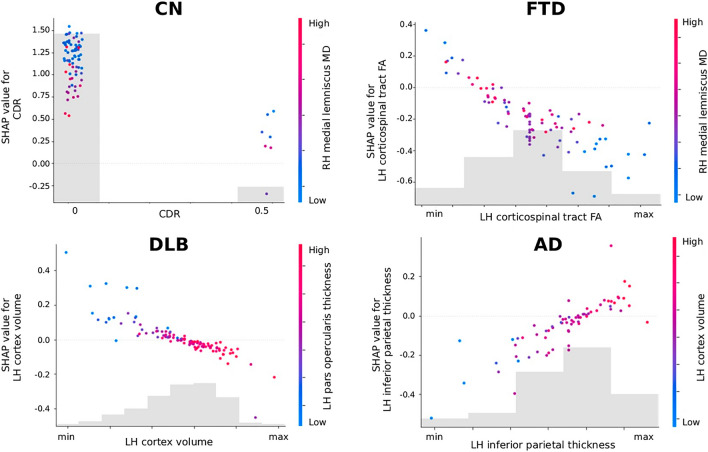
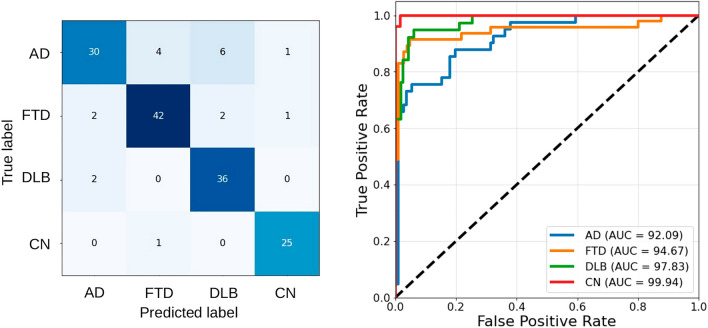
Biomarker-based differential diagnosis of the most common forms of dementia is becoming increasingly important. Machine learning (ML) may be able to address this challenge. The aim of this study was to develop and interpret a ML algorithm capable of differentiating Alzheimer's dementia, frontotemporal dementia, dementia with Lewy bodies and cognitively normal control subjects based on sociodemographic, clinical, and magnetic resonance imaging (MRI) variables. 506 subjects from 5 databases were included. MRI images were processed with FreeSurfer, LPA, and TRACULA to obtain brain volumes and thicknesses, white matter lesions and diffusion metrics. MRI metrics were used in conjunction with clinical and demographic data to perform differential diagnosis based on a Support Vector Machine model called MUQUBIA (Multimodal Quantification of Brain whIte matter biomArkers). Age, gender, Clinical Dementia Rating (CDR) Dementia Staging Instrument, and 19 imaging features formed the best set of discriminative features. The predictive model performed with an overall Area Under the Curve of 98%, high overall precision (88%), recall (88%), and F1 scores (88%) in the test group, and good Label Ranking Average Precision score (0.95) in a subset of neuropathologically assessed patients. The results of MUQUBIA were explained by the SHapley Additive exPlanations (SHAP) method. The MUQUBIA algorithm successfully classified various dementias with good performance using cost-effective clinical and MRI information, and with independent validation, has the potential to assist physicians in their clinical diagnosis.
© 2023. Springer Nature Limited.
Conflict of interest statement
The authors declare no competing interests.
Figures

References
Publication types
MeSH terms
Substances
Grants and funding
- P50 AG005142/AG/NIA NIH HHS/United States
- P50 AG016573/AG/NIA NIH HHS/United States
- P50 AG047266/AG/NIA NIH HHS/United States
- P50 AG025688/AG/NIA NIH HHS/United States
- P50 AG005133/AG/NIA NIH HHS/United States
- P50 AG005138/AG/NIA NIH HHS/United States
- P50 AG047366/AG/NIA NIH HHS/United States
- P30 AG028383/AG/NIA NIH HHS/United States
- P30 AG013854/AG/NIA NIH HHS/United States
- P30 AG053760/AG/NIA NIH HHS/United States
- P30 AG010124/AG/NIA NIH HHS/United States
- P50 AG023501/AG/NIA NIH HHS/United States
- P50 AG005131/AG/NIA NIH HHS/United States
- U01 NS100610/NS/NINDS NIH HHS/United States
- P30 AG010133/AG/NIA NIH HHS/United States
- P50 AG016574/AG/NIA NIH HHS/United States
- P50 AG005146/AG/NIA NIH HHS/United States
- U24 AG072122/AG/NIA NIH HHS/United States
- U01 AG024904/AG/NIA NIH HHS/United States
- P30 AG035982/AG/NIA NIH HHS/United States
- P50 AG008702/AG/NIA NIH HHS/United States
- P30 AG008051/AG/NIA NIH HHS/United States
- P50 AG005681/AG/NIA NIH HHS/United States
- P30 AG013846/AG/NIA NIH HHS/United States
- P50 AG047270/AG/NIA NIH HHS/United States
- P50 AG005136/AG/NIA NIH HHS/United States
- P30 AG049638/AG/NIA NIH HHS/United States
- P30 AG012300/AG/NIA NIH HHS/United States
- P50 AG005134/AG/NIA NIH HHS/United States
- P30 AG008017/AG/NIA NIH HHS/United States
- P30 AG010161/AG/NIA NIH HHS/United States
- R01 AG032306/AG/NIA NIH HHS/United States
- WT_/Wellcome Trust/United Kingdom
- P30 AG072976/AG/NIA NIH HHS/United States
- P30 AG010129/AG/NIA NIH HHS/United States
- P30 AG019610/AG/NIA NIH HHS/United States
- P30 AG072947/AG/NIA NIH HHS/United States
- U01 NS100620/NS/NINDS NIH HHS/United States
- P50 AG033514/AG/NIA NIH HHS/United States
LinkOut - more resources
Full Text Sources
Medical
Miscellaneous
