. 2023 Oct 13;14(1):6447.
doi: 10.1038/s41467-023-42103-x.

Extracellular vesicles could be a putative posttranscriptional regulatory mechanism that shapes intracellular RNA levels in Plasmodium falciparum

Affiliations

Extracellular vesicles could be a putative posttranscriptional regulatory mechanism that shapes intracellular RNA levels in Plasmodium falciparum

Mwikali Kioko et al. Nat Commun. .

Abstract

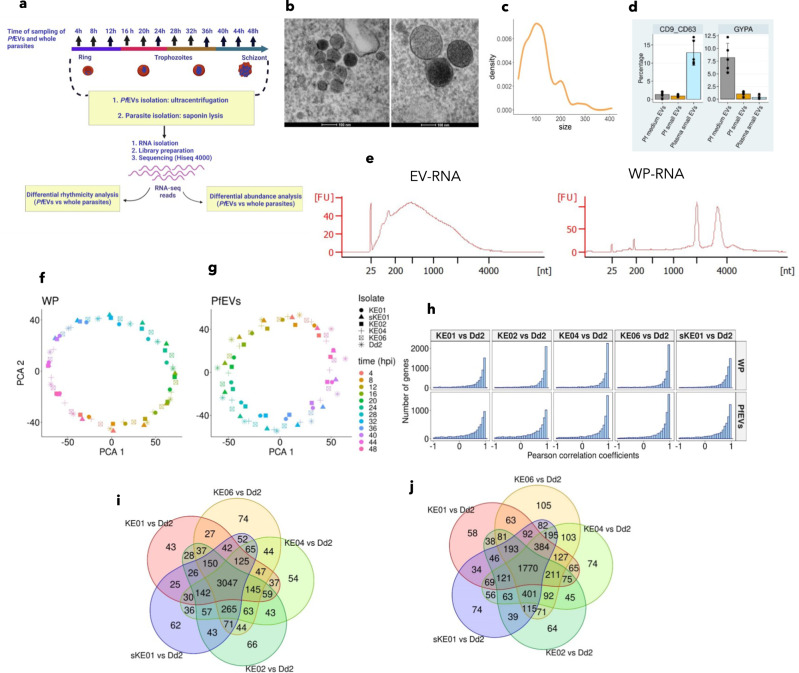
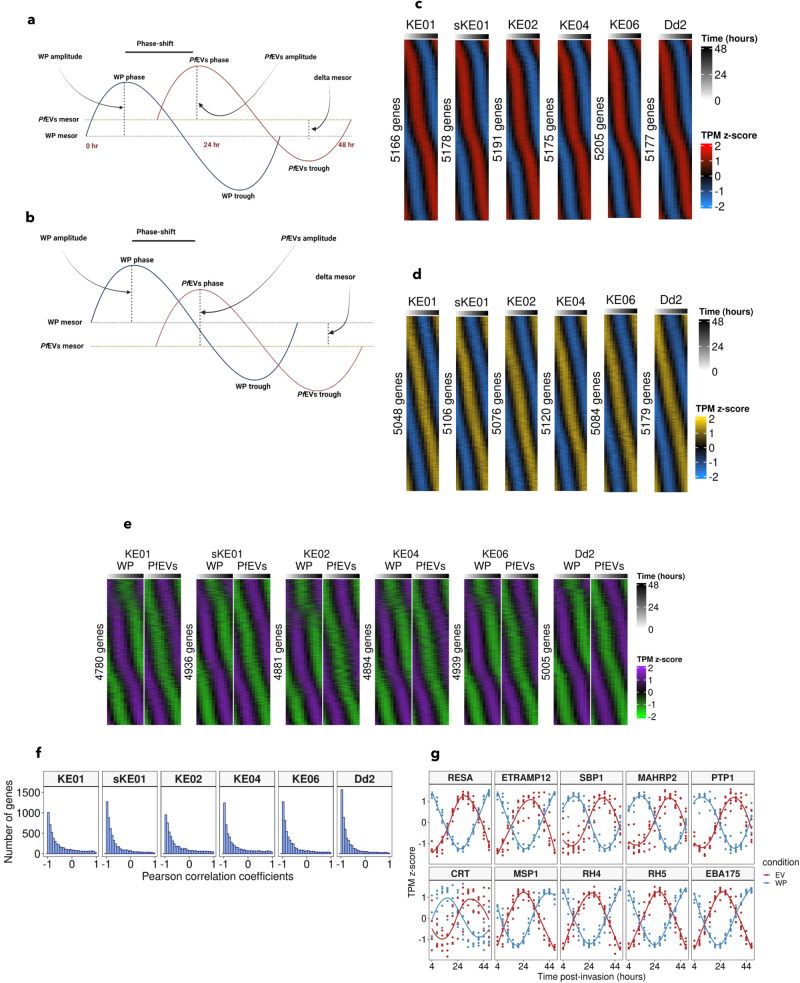
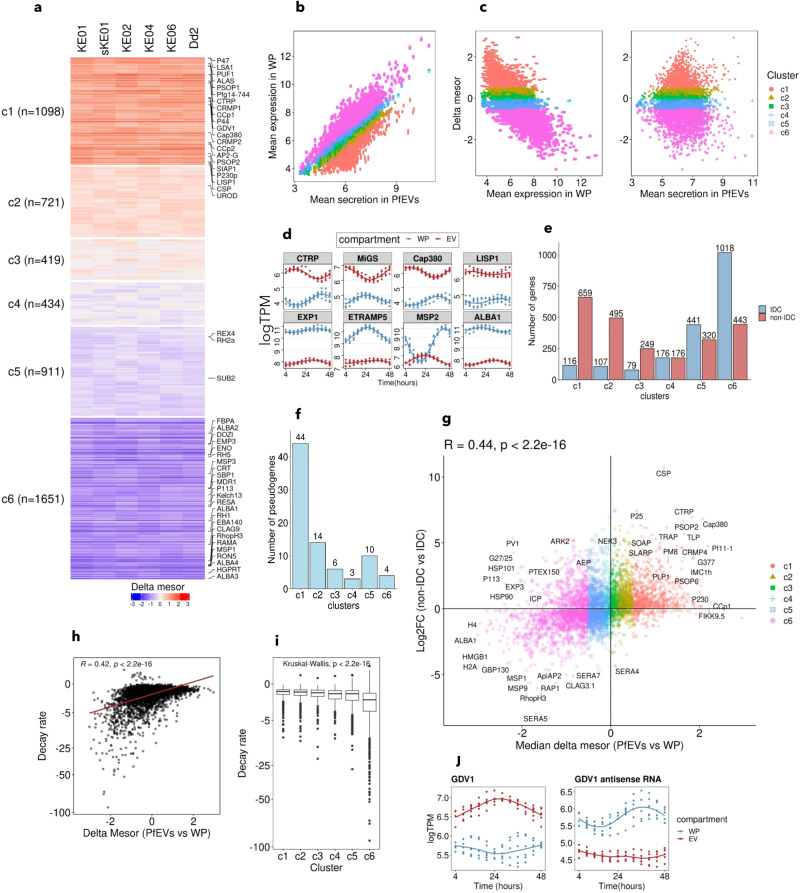
Plasmodium falciparum secretes extracellular vesicles (PfEVs) that contain parasite-derived RNA. However, the significance of the secreted RNA remains unexplored. Here, we compare secreted and intracellular RNA from asexual cultures of six P. falciparum lines. We find that secretion of RNA via extracellular vesicles is not only periodic throughout the asexual intraerythrocytic developmental cycle but is also highly conserved across P. falciparum isolates. We further demonstrate that the phases of RNA secreted via extracellular vesicles are discernibly shifted compared to those of the intracellular RNA within the secreting whole parasite. Finally, transcripts of genes with no known function during the asexual intraerythrocytic developmental cycle are enriched in PfEVs compared to the whole parasite. We conclude that the secretion of extracellular vesicles could be a putative posttranscriptional RNA regulation mechanism that is part of or synergise the classic RNA decay processes to maintain intracellular RNA levels in P. falciparum.


Conflict of interest statement

The authors declare no competing interests.

Figures

Fig. 1
Fig. 1. RNA secretion via PfEVs is conserved between P. falciparum isolates.
a Schematic summary of culture-conditioned medium (CCM) sampling, sample preprocessing and data analysis (created with BioRender.com). b Representative transmission electron microscopy image of sectioned P. falciparum EVs (PfEVs). Some have a conspicuously dark lumen, which shows they are rich in biological cargo. PfEVs images from 10 fields were captured. c Density plot of PfEV sizes (estimated from 177 images from 10 fields) shows that the isolated PfEVs have a median diameter of 100 nm, and >90% have a diameter of <200 nm. d Barplots showing (left) that Pf small EVs, which were the focus of the current study, have relatively lower expression of classical markers of small EVs, CD9 and CD63 compared to plasma-derived small EVs. Only the proportion positive for both CD9 and CD63 was gated. Barplots showing (right) that Pf small EVs have lower glycophorin (GYPA) expression than Pf medium EVs. The centre line represents the mean, while the limits represent ± standard deviation. The points represent n = 5 experiments. e Bioanalyser traces show that PfEVs lack the ribosomal RNA peaks in whole parasites (WP). f, g PCA plots showing that both WP and PfEVs samples assume the rhythmic circular shape of P. falciparum IDC transcriptomes. Samples cluster together based on the sampling time points irrespective of the isolate. h Histograms showing Pearson Correlation Coefficients (PCCs) calculated from the Fourier-transformed transcriptomes between KE01, sKE01, KE02, KE04 and KE06 using Dd2 as the reference. Venn diagram analysis WP (i) and PfEVs (j) gene profiles with PCC scores > 0.5 in the five comparisons of culture-adapted clinical isolates with Dd2. The high overlap implies that both WP and PfEVs transcriptomes are quite conserved between the isolates.
Fig. 2
Fig. 2. Secretion of RNA via PfEVs is rhythmic but phase-shifted compared to intracellular RNA.
Schematic representation of rhythmic parameters estimated from the RNAseq data using two scenarios (created using Biorender.com); a RNA abundance is higher in PfEVs than WP b RNA abundance is lower in PfEVs than WP. Phaseograms of blood-stage transcriptomes of c WP and d PfEVs obtained from the P. falciparum isolates (KE01, sKE01, KE02, KE04, KE06 and Dd2). The phaseograms were generated from the mean-centred Fourier transformed logTPM, and the genes are ordered along the y-axis based on their phase. The periodicity of genes was tested using the likelihood ratio test, and only those that met the unadjusted p-value threshold of <0.05 were used to create the phaseograms. The numbers on the left of each phaseogram represent the total number of significantly (based on the likelihood ratio test) phase-shifted genes at an unadjusted p-value < 0.05. e Phaseograms show that for the vast majority of P. falciparum genes, the peaks of RNA abundance in WP correspond to the trough of RNA secretion via PfEVs at the global level and vice versa. Only genes detected as significantly rhythmic in both WP and PfEVs were used to construct the phaseograms, and the order of genes in WP and PfEVs samples is the same in each isolate. Mean z-scoring of WP and PfEVs datasets was performed separately to capture the temporal trends in each compartment. f Histograms showing Pearson correlations between RNA abundance in PfEVs and WP g Phase-shift demonstration using combined plots of ten well-known P. falciparum genes; RESA (ring infected erythrocyte surface protein), ETRAMP12 (early transcribed membrane protein 12), SBP1 (skeleton binding protein 1), MAHRP2 (membrane-associated histidine-rich protein 2), PTP1 (PfEMP1 trafficking protein 1), CRT (chloroquine resistance transporter), MSP1 (merozoite surface protein 1), RH4 (reticulocyte homologue protein 4), RH5 (reticulocyte homologue protein 5) and EBA175 (erythrocyte binding antigen 175).
Fig. 3
Fig. 3. RNA of genes with no known function in IDC is enriched in PfEVs compared to WP.
a Heatmap of delta mesor obtained by comparing the RNA abundance in PfEVs to that of WP. The heatmap is split into six clusters based on the median delta mesor and consistency of relative RNA abundance between PfEVs and WP across isolates. Cluster c1 represents transcripts that are more abundant in PfEVs than WP (median delta mesor > 0.5), while c6 represents the most excluded from secretion via PfEVs (median delta mesor < −0.5). b A cross plot comparing mean abundance in PfEVs (x-axis) to mean abundance in WP (y-axis). Each dot is a gene, and colouration is based on the clusters identified in Fig. 3a. c MA plots comparing delta mesor (y-axis) to mean RNA abundance in WP or PfEVs. d Example profiles of c1 (CTRP, MiGS, Cap380 and LISP1) and c6 (EXP1,ETRAMP5,MSP2 and ALBA1) representatives. e Comparison of PfEV-RNA relative abundance with parasite-stage specific markers obtained from the Malaria Cell Atlas data. Most genes required by non-IDC stages of the parasite are enriched in PfEVs relative to the WP, while those required during the IDC stage are enriched in the WP. f Most pseudogenes have higher RNA levels in PfEVs than the WP (44 belong to cluster c1). g The relative abundance of RNA in PfEVs (x-axis) positively correlates (Spearman’s Rank correlation) with the relative expression in non-IDC stages (y-axis). h mRNA decay rates (published by Llinas lab) positively correlate (Spearman Rank correlation) with relative RNA enrichment in PfEVs. i Boxplots showing the average decay rates in the six clusters; cluster c6 transcripts, excluded from PfEVs, have the lowest decay rates. The centre lines represent the medians, limits represent the median ± interquartile range, and whiskers represent values 1.5 times above or below the 75th and 25th percentiles, respectively. Points depict values > 1.5 times and <3 times the interquartile range in each end of the boxplots. The number of genes in each cluster is the same as in Fig. 3a. j GDV1 antisense RNA is excluded from PfEVs, while its target GDV1 is preferentially secreted.

References

    1. Njuguna P, et al. Observational study: 27 years of severe malaria surveillance in Kilifi, Kenya. BMC Med. 2019;17:124. - PMC - PubMed
    1. WHO. World malaria report 2021. liv, p. 263 (World Health Organization, 2021).
    1. Roy S, Khatun T. Analysis of trend of malaria prevalence in the Ten Asian Countries from 2006 to 2011: a longitudinal study. Malar. Res. Treat. 2015;2015:620598. - PMC - PubMed
    1. Mitchell CL, et al. Evaluating malaria prevalence and land cover across varying transmission intensity in Tanzania using a cross-sectional survey of school-aged children. Malar. J. 2022;21:80. - PMC - PubMed
    1. Brown BJ, et al. Data-driven malaria prevalence prediction in large densely populated urban holoendemic sub-Saharan West Africa. Sci. Rep. 2020;10:15918. - PMC - PubMed

Publication types