. 2023 Oct 13;13(1):17415.
doi: 10.1038/s41598-023-44035-4.

A Monte Carlo model of the Dingo thermal neutron imaging beamline

Affiliations

A Monte Carlo model of the Dingo thermal neutron imaging beamline

Klaudiusz Jakubowski et al. Sci Rep. .

Abstract

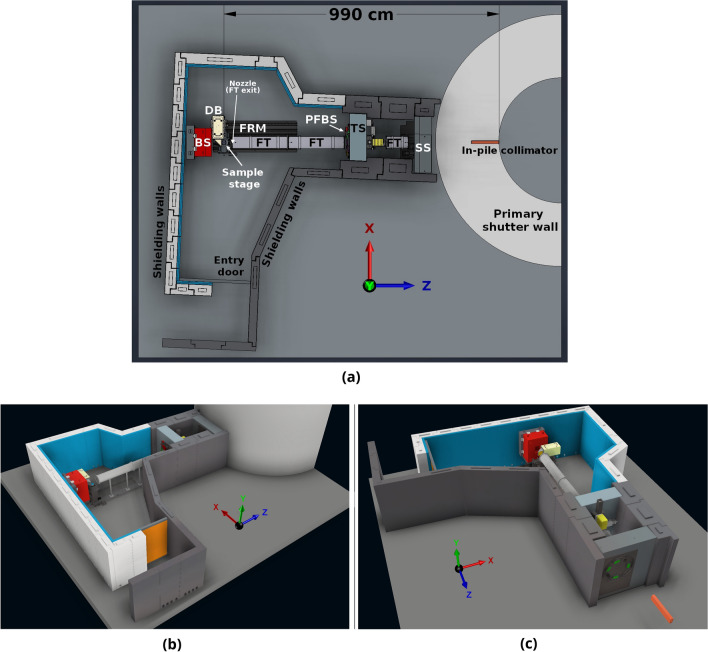
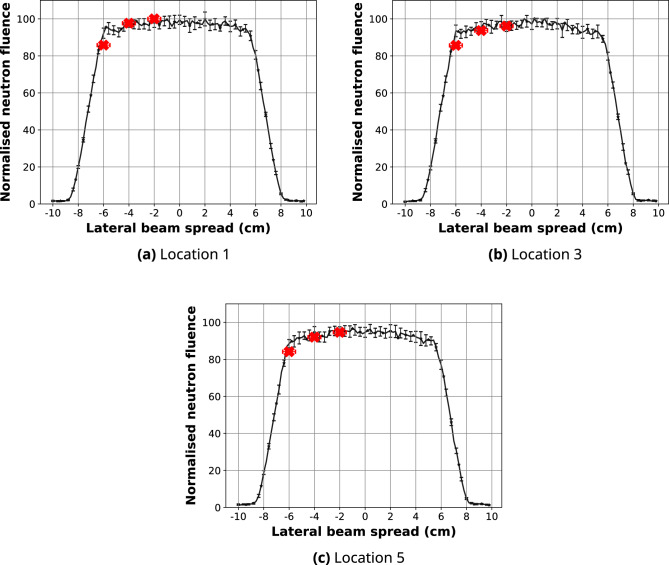
In this study, we present a validated Geant4 Monte Carlo simulation model of the Dingo thermal neutron imaging beamline at the Australian Centre for Neutron Scattering. The model, constructed using CAD drawings of the entire beam transport path and shielding structures, is designed to precisely predict the in-beam neutron field at the position at the sample irradiation stage. The model's performance was assessed by comparing simulation results to various experimental measurements, including planar thermal neutron distribution obtained in-beam using gold foil activation and [Formula: see text]B[Formula: see text]C-coated microdosimeters and the out-of-beam neutron spectra measured with Bonner spheres. The simulation results demonstrated that the predicted neutron fluence at the field's centre is within 8.1% and 2.1% of the gold foil and [Formula: see text]B[Formula: see text]C-coated microdosimeter measurements, respectively. The logarithms of the ratios of average simulated to experimental fluences in the thermal (E[Formula: see text] 0.414 eV), epithermal (0.414 eV < E[Formula: see text] 11.7 keV) and fast (E[Formula: see text] 11.7 keV) spectral regions were approximately - 0.03 to + 0.1, - 0.2 to + 0.15, and - 0.4 to + 0.2, respectively. Furthermore, the predicted thermal, epithermal and fast neutron components in-beam at the sample stage position constituted approximately 18%, 64% and 18% of the total neutron fluence.


Conflict of interest statement

The authors declare no competing interests.

Figures

Figure 1
Figure 1
ACNS Dingo beamline model—(a) schematics of the beamline structure, where SS secondary shutter, FT flight tubes, TS tertiary shutter, PFBS pre-flight tube beam slits, FRM floor rail mounting, DB detector box, BS beam stop; (b,c) visualisation generated using Autodesk Inventor 2022. Shielding roof has been removed in the visualisation. The primary shutter wall has been additionally omitted in (c).
Figure 2
Figure 2
Schematic drawing of the experimental setup, where circles denote the gold foils, and x denotes 10B4C-coated microdosimeter locations.
Figure 3
Figure 3
Simulation configuration illustrating the scoring plane used for the beam uniformity study and prediction of the in-beam neutron spectra, and the Bonner sphere experimental configuration.
Figure 4
Figure 4
Locations of the horizontal line-profiles. The locations are numbered 1-7 from bottom to top.
Figure 5
Figure 5
Line-profiles of the simulated 10 cm × 10 cm neutron fields at the sample stage position along the central axis (black) and + 5.5 cm away from the centre (red).
Figure 6
Figure 6
Line-profiles along the x-axis of the simulated 10 cm × 10 cm high-resolution neutron field after 2D normalisation to the maximum gold activation foil reading at Location 1 (black), compared to the experimental gold foil results (red circles). Positional variation in the experimental results is within ± 0.5 cm in x (error bars shown) and y directions. 95% confidence intervals for the simulated data are also shown.
Figure 7
Figure 7
Line-profiles along the x-axis of the simulated 10 cm × 10 cm high-resolution neutron field after 2D normalisation to the maximum microdosimeter reading at Location 1 (black), compared to the experimental 10B4C-coated microdosimeter results (red “x”). Positional variation in the experimental results is within ± 0.25 cm in x (error bars shown) and y directions. 95% confidence intervals for the simulated data are shown.
Figure 8
Figure 8
Normalised simulated (black) and experimental (red) out-of-beam neutron fluence per unit lethargy (upper graphs) and the percentage differences (lower graphs). 95% confidence intervals for the simulated data are shown.
Figure 9
Figure 9
Neutron spectra simulated in-beam (blue) at the sample stage and out-of-beam (black) at location 1. Red line denotes the unfolded Bonner sphere neutron spectrum at location 1.

References

    1. Salvemini F, Bevitt J, Liss KD, Garbe U. DINGO—The neutron imaging station at ANSTO: Embracing material science, palaeontology, and cultural heritage. Neutron News. 2016;27:14–19. doi: 10.1080/10448632.2016.1163982. - DOI
    1. Safavi-Naeini M, et al. Opportunistic dose amplification for proton and carbon ion therapy via capture of internally generated thermal neutrons. Sci. Rep. 2018;8:1. doi: 10.1038/s41598-018-34643-w. - DOI - PMC - PubMed
    1. Kiyanagi, Y., Sakurai, Y., Kumada, H. & Tanaka, H. Status of accelerator-based BNCT projects worldwide. In 25th International Conference on the Application of Accelerators in Research and Industry 1–9. 10.1063/1.5127704 (AIP Publishing, 2019).
    1. Dymova MA, Taskaev SY, Richter VA, Kuligina EV. Boron neutron capture therapy: Current status and future perspectives. Cancer Commun. 2020;40:406–421. doi: 10.1002/cac2.12089. - DOI - PMC - PubMed
    1. Suzuki M. Boron neutron capture therapy (BNCT): A unique role in radiotherapy with a view to entering the accelerator-based BNCT era. Int. J. Clin. Oncol. 2020;25:43–50. doi: 10.1007/s10147-019-01480-4. - DOI - PubMed