. 2023 Dec;20(12):1413-1427.
doi: 10.1038/s41423-023-01089-8. Epub 2023 Oct 13.

MST4 kinase regulates immune thrombocytopenia by phosphorylating STAT1-mediated M1 polarization of macrophages

Affiliations

MST4 kinase regulates immune thrombocytopenia by phosphorylating STAT1-mediated M1 polarization of macrophages

Jingjing Cao et al. Cell Mol Immunol. 2023 Dec.

Erratum in

Abstract

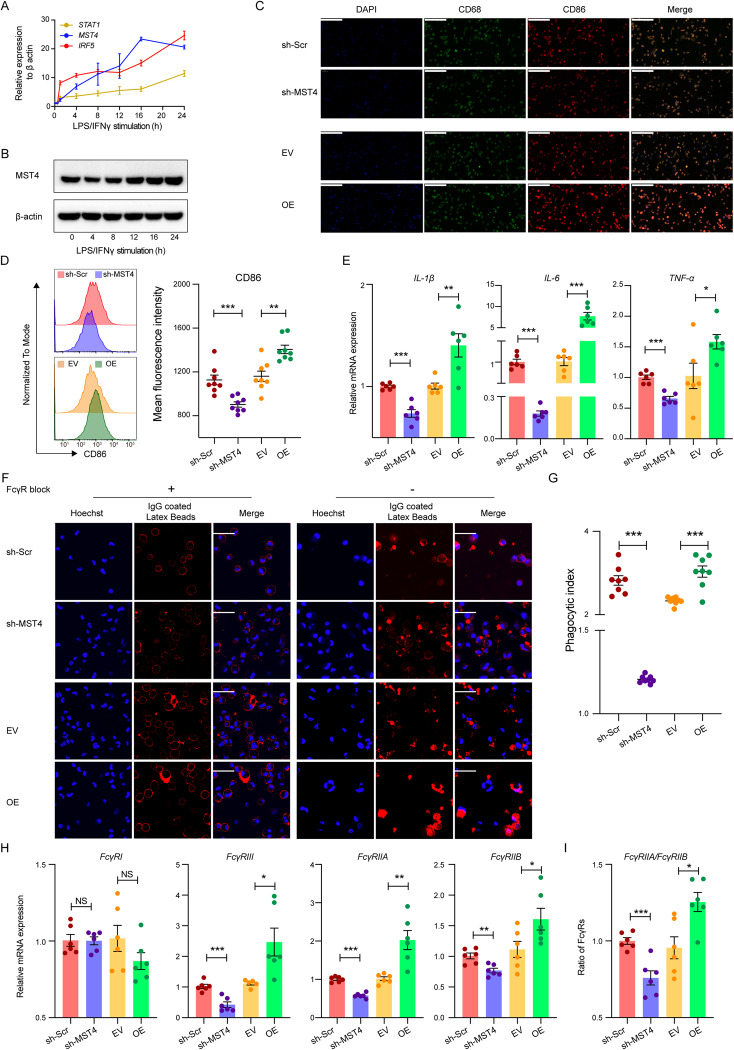
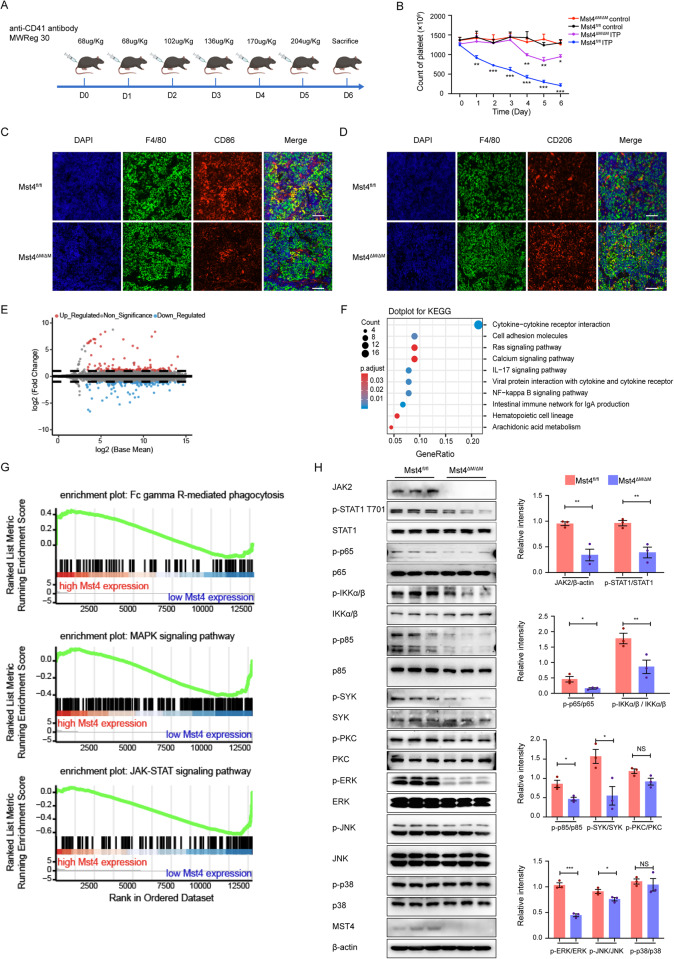
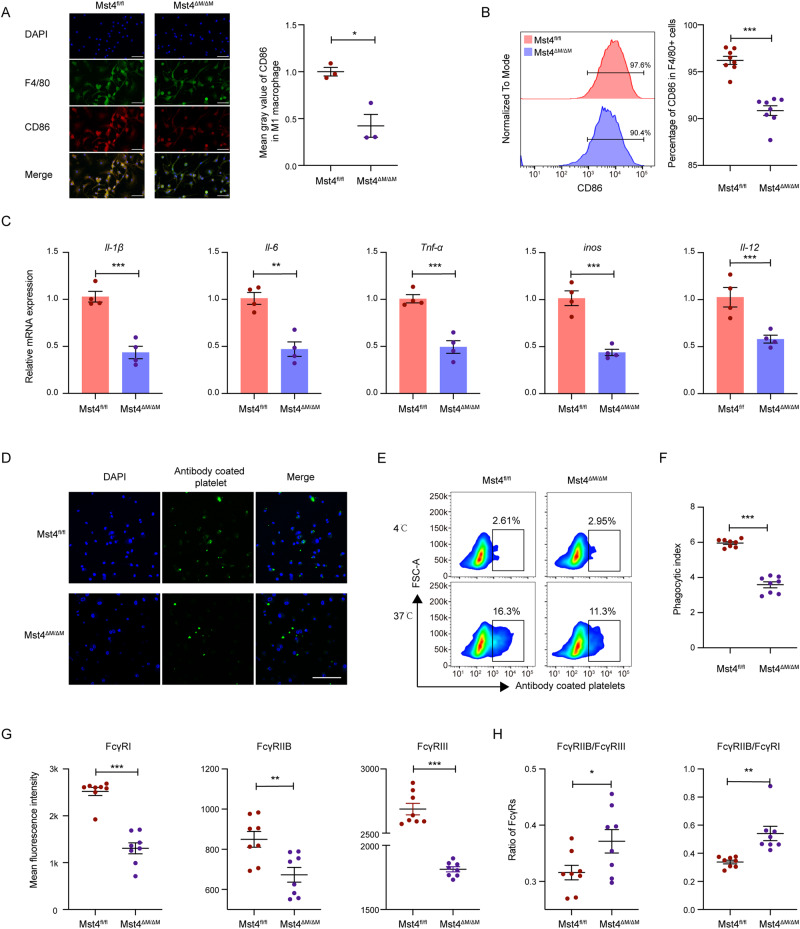
Primary immune thrombocytopenia (ITP) is an autoimmune hemorrhagic disorder in which macrophages play a critical role. Mammalian sterile-20-like kinase 4 (MST4), a member of the germinal-center kinase STE20 family, has been demonstrated to be a regulator of inflammation. Whether MST4 participates in the macrophage-dependent inflammation of ITP remains elusive. The expression and function of MST4 in macrophages of ITP patients and THP-1 cells, and of a macrophage-specific Mst4-/- (Mst4ΔM/ΔM) ITP mouse model were determined. Macrophage phagocytic assays, RNA sequencing (RNA-seq) analysis, immunofluorescence analysis, coimmunoprecipitation (co-IP), mass spectrometry (MS), bioinformatics analysis, and phosphoproteomics analysis were performed to reveal the underlying mechanisms. The expression levels of the MST4 gene were elevated in the expanded M1-like macrophages of ITP patients, and this elevated expression of MST4 was restored to basal levels in patients with remission after high-dose dexamethasone treatment. The expression of the MST4 gene was significantly elevated in THP-1-derived M1 macrophages. Silencing of MST4 decreased the expression of M1 macrophage markers and cytokines, and impaired phagocytosis, which could be increased by overexpression of MST4. In a passive ITP mouse model, macrophage-specific depletion of Mst4 reduced the numbers of M1 macrophages in the spleen and peritoneal lavage fluid, attenuated the expression of M1 cytokines, and promoted the predominance of FcγRIIb in splenic macrophages, which resulted in amelioration of thrombocytopenia. Downregulation of MST4 directly inhibited STAT1 phosphorylation, which is essential for M1 polarization of macrophages. Our study elucidates a critical role for MST4 kinase in the pathology of ITP and identifies MST4 kinase as a potential therapeutic target for refractory ITP.

Keywords: M1 polarization; Macrophages; Mammalian sterile-20-like kinase 4 (MST4); Primary immune thrombocytopenia; Signal transducer and activator of transcription-1 (STAT1).


Conflict of interest statement

The authors declare no competing interests.

Figures

Fig. 1
Fig. 1
M1 macrophages and expression of IRF5, CD80, IL-1β, IL-6, IL-12, TNF-a, and MST4 in M1 macrophages of ITP patients. AC Representative flow cytometry plots of CD14+CD86+ M1-like macrophages. The peripheral CD14+CD86+ M1-like macrophage population was expanded in ITP patients and restored to a lower level by the HD-DXM regimen in CR patients. DI In magnetically isolated CD14+ cells, the expression of IRF5, CD80, IL-1β, IL-6, IL-12, and TNF-a was increased in ITP patients, and the expression of IRF5, IL-1β, IL-6, and TNF-a was restored to a lower level by the HD-DXM regimen in CR patients. J, K The expression of MST4 in M1 macrophages was enhanced in ITP patients and was restored to a lower level by the HD-DXM regimen in CR patients. LN A positive correlation between MST4 and IRF5 was found in ITP patients (r = 0.59, p < 0.001), especially in CR-pre patients (r = 0.75, p < 0.001). The data are presented as the means ± SEMs in all the panels. P values were calculated using unpaired Student’s t test (A, B, DJ), paired Student’s t test (C, K), or Spearman’s correlation analysis (LN). *p < 0.05, **p < 0.01, ***p < 0.001. ITP, primary immune thrombocytopenia; HC healthy control, pre before treatment, post after treatment, HD-DXM high-dose dexamethasone, CR complete response, PR partial response, NR no response, NS no significance
Fig. 2
Fig. 2
MST4 kinase promotes the phagocytic capacity of M1 macrophages derived from THP-1 monocytes. THP-1 monocytes were stimulated with LPS + IFN-γ and collected at multiple time points. The expression of MST4 during the development of M1 macrophages was determined by qRT‒PCR (A) and immunoblot analysis (B). THP1 monocytes were transduced with lentivirus containing MST4-shRNA, control shRNA, cDNA of human MST4, or empty vector and were polarized into M1 macrophages by incubation with LPS + IFN-γ for 24 h. C Representative immunostaining images of M1 macrophages. Original magnification, ×200. Scale bar, 200 µm. D Representative FACS histogram plot of CD86 (left) and MFI quantification of CD86 in M1 macrophages (right). E The expression of IL-1β, IL-6, and TNF-α was decreased in M1 macrophages of the sh-MST4 group and increased in M1 macrophages of the OE group. M1 macrophages induced from THP-1 cells were incubated with IgG-coated latex beads for 2 h. F The phagocytosis of IgG-coated latex beads by M1 macrophages was compromised by blocking FcγRs (left), and the number of endocytic IgG-coated latex beads in M1 macrophages was decreased in the sh-MST4 group and increased in the OE group (right). Original magnification, ×400. Scale bar, 50 µm. G The phagocytic index (the ratio of IgG-coated latex bead-positive macrophages at 37 °C to that at 4 °C) was reduced in the sh-MST4 group and increased in the OE group, as revealed by a FACS analysis. HI The expression of FcγRI was not regulated by MST4. The expression of FcγRIIa, FcγRIIb, and FcγRIII was decreased in M1 macrophages of the sh-MST4 group, and FcγRIIb dominated. In M1 macrophages of the OE group, the expression of FcγRIIa, FcγRIIb, and FcγRIII was increased, and FcγRIIa dominated. The data are presented as the means ± SEMs in all the panels. P values were calculated using unpaired Student’s t test (D, E, G, H, I). *p < 0.05, **p < 0.01, ***p < 0.001. NS no significance, sh-MST4 MST4-specific short hairpin RNA, sh-Scr control shRNA with a scrambled sequence, EV empty vector, OE overexpression
Fig. 3
Fig. 3
MST4 deficiency in macrophages ameliorates thrombocytopenia in the passive murine ITP model. A Schematic of the murine passive ITP model. B Thrombocytopenia was ameliorated in Mst4ΔM/ΔM ITP mice. C, D Representative immunofluorescence images of M1 and M2 macrophages in spleens of Mst4ΔM/ΔM and Mst4fl/fl ITP mice. Original magnification, ×400. Scale bar, 50 µm. E MA plot of differentially expressed genes in splenic macrophages between Mst4fl/fl and Mst4ΔM/ΔM ITP mice (n = 4). The NF-κB pathways, JAK-STAT pathways, MAPK pathways, and FcγR-mediated phagocytosis were differently activated between Mst4ΔM/ΔM and Mst4fl/fl ITP mice, as revealed by KEGG (F) and gene set enrichment analyses (G). H Immunoblot analysis of the characterized proteins of the JAK-STAT (JAK2, STAT1(Tyr701)) pathway, FcγR-mediated phagocytosis (SYK, p85, PKC), NF-κB (Ikkα/β, NF-κB (p65)) pathway, and MAPK (ERK, JNK, p38) pathway in M1 macrophages of Mst4ΔM/ΔM and Mst4fl/fl ITP mice (left). The relative intensity (phosphorylated proteins relative to total protein or total protein relative to β-actin) is shown (right). β-actin was used as the loading control. The data are presented as the means ± SEMs in all the panels. *p < 0.05, **p < 0.01, ***p < 0.001
Fig. 4
Fig. 4
The M1 macrophage population and expression of FcγRs in macrophages are attenuated in Mst4ΔM/ΔM ITP mice. A Representative FACS histogram plots of CD86 (left) and CD206 (right) in F4/80+CD11B+ splenocytes of Mst4ΔM/ΔM and Mst4fl/fl ITP mice. B A decreased number of M1 macrophages, an expanded population of M2 macrophages, and a predominance of M2 macrophages in F4/80+CD11B+ splenic macrophages were observed in Mst4ΔM/ΔM ITP mice. C Representative FACS histogram plot of CD86 (left) and CD206 (right) in F4/80+CD11B+ cells of peritoneal lavage fluid from Mst4ΔM/ΔM and Mst4fl/fl ITP mice. D A decreased number of M1 macrophages, an expanded population of M2 macrophages, and a predominance of M2 macrophages in F4/80+CD11B+ cells were observed in the peritoneal lavage fluid of Mst4ΔM/ΔM ITP mice. E The expression of Il-1β, Il-6, Il-12, and Tnf-α was decreased significantly in magnetically sorted F4/80+ splenic macrophages of Mst4ΔM/ΔM ITP mice. F Representative FACS histogram plots of FcγRI, FcγRIIb, and FcγRIII in F4/80+CD11B+ splenic macrophages of Mst4ΔM/ΔM and Mst4fl/fl ITP mice. F4/80+CD11B+ splenic macrophages of Mst4ΔM/ΔM ITP mice showed enhanced expression of FcγRI, FcγRIIb, and FcγRIII (G) and a predominance of FcγRIIb (H). The data are presented as the means ± SEMs in all the panels. *p < 0.05, **p < 0.01, ***p < 0.001. MFI mean fluorescence intensity
Fig. 5
Fig. 5
The development and phagocytic capacity of M1 macrophages derived from BMDMs of Mst4ΔM/ΔM ITP mice are compromised. Bone marrow-derived macrophages (BMDMs) of Mst4ΔM/ΔM and Mst4fl/fl ITP mice were stimulated with LPS + IFN-γ for 24 h to generate M1 macrophages. A Representative immunostaining images of M1 macrophages (left). Original magnification, ×400. Scale bar, 50 µm. The quantification of the immunofluorescence intensity of CD86 (mean gray value) is shown. The mean gray value of the control group was normalized to 1 (right). B Representative FACS histogram of CD86 (left) and percentage of CD86 in M1 macrophages (right). C The expression of Il-1β, Il-6, Tnf-α, iNOS, and Il-12 was reduced in M1 macrophages of Mst4ΔM/ΔM ITP mice. DF M1 macrophages of Mst4ΔM/ΔM and Mst4fl/fl ITP mice were incubated with antibody-opsonized platelets for 2 h. Representative immunofluorescence staining of the phagocytosis assay without FcγR blocking was performed. Original magnification, ×400. Scale bar, 100 µm (D). Representative flow cytometry plots of the phagocytosis assay (E), and the phagocytic index was reduced in M1 macrophages of Mst4ΔM/ΔM ITP mice (F). M1 macrophages of Mst4ΔM/ΔM ITP mice showed decreased expression of FcγRI, FcγRIIb, and FcγRIII (G), and FcγRIIb dominated (H), as revealed by FACS analysis. The data are presented as the means ± SEMs in all the panels. *p < 0.05, **p < 0.01, ***p < 0.001. MFI mean fluorescence intensity
Fig. 6
Fig. 6
MST4 promotes the development of M1 macrophages by phosphorylating STAT1. A Summary of the functional similarities of the MST4 interactome in M1 macrophages. The lower and upper box boundaries represent the 25th and 75th percentiles, and the line in the box represents the median. The dashed line represents the cutoff value. Proteins with a higher average functional similarity (cutoff > 0.4) were considered central proteins within the MST4 interactome in M1 macrophages. B A total of 729 differentially phosphorylated sites were observed in M1 macrophages of Mst4fl/fl ITP mice compared with M1 macrophages of Mst4ΔM/ΔM ITP mice, as revealed by phosphoproteomics data. C Kinase-substrate enrichment analysis of the phosphoproteomic data using the clusterProfiler package and kinase-substrate “gene sets” assembled from PhosphoSitePlus. D Most common trend of amino acid sequences before and after phosphorylation sites revealed by the protein motif analysis. E Phosphorylation profile of STAT1 at Ser727. F The phosphorylation of Ser727 at STAT1 was relatively reduced in M1 macrophages from Mst4ΔM/ΔM ITP mice, as revealed by the phosphoproteomic analysis. Coimmunoprecipitation of STAT1 with MST4 (G) and MST4 with STAT1 (H) in lysates of M1 macrophages derived from bone marrow cells and incubated with IgG-coated latex beads for 2 h. Left margin, molecular size in kilodaltons. I The phosphorylation of Ser727 at STAT1 was reduced in M1 macrophages from Mst4ΔM/ΔM ITP mice, as revealed by the immunoblot analysis (left), and the quantification of relative intensity (phosphorylation of Ser727 in STAT1 relative to STAT1) is shown (right). β-actin served as the loading control. The data are presented as the means ± SEMs in all the panels. *p < 0.05
Fig. 7
Fig. 7
The activation of STAT1 rescues the compromised development of MST4-deficient M1 macrophages. A Immunoblot analysis of STAT1 and p-STAT1 in M1 macrophages induced from the sorted CD14+ monocytes of healthy volunteers and ITP patients (left) and quantification of relative intensity (phosphorylated proteins relative to STAT1) (right). β-actin served as the loading control. B LPS + IFN-γ-stimulated BMDMs from Mst4ΔM/ΔM and Mst4fl/fl ITP mice were cultured with a specific activator of STAT1 (2-NP, 50 µM). A representative FACS histogram of M1 macrophages and quantification of the percentage of CD86 in macrophages is shown (right). C The compromised expression of Il-1β, Il-6, and Tnf-α in M1 macrophages of Mst4ΔM/ΔM ITP mice was restored to a normal level in the presence of 2-NP. The data are presented as the means ± SEMs in all the panels. *p < 0.05, **p < 0.01, ***p < 0.001

Similar articles

Cited by

References

    1. Cooper N, Ghanima W. Immune thrombocytopenia. N Engl J Med. 2019;381:945–55. doi: 10.1056/NEJMcp1810479. - DOI - PubMed
    1. Hou Y, Xie J, Wang S, Li D, Wang L, Wang H, et al. Glucocorticoid receptor modulates myeloid-derived suppressor cell function via mitochondrial metabolism in immune thrombocytopenia. Cell Mol Immunol. 2022;19:764–76. doi: 10.1038/s41423-022-00859-0. - DOI - PMC - PubMed
    1. Zhuang X, Xu P, Ou Y, Shao X, Li Y, Ma Y, et al. Decreased cyclooxygenase-2 associated with impaired megakaryopoiesis and thrombopoiesis in primary immune thrombocytopenia. J Transl Med. 2023;21:540. doi: 10.1186/s12967-023-04389-9. - DOI - PMC - PubMed
    1. Shao X, Xu P, Ji L, Wu B, Zhan Y, Zhuang X, et al. Low-dose decitabine promotes M2 macrophage polarization in patients with primary immune thrombocytopenia via enhancing KLF4 binding to PPARγ promoter. Clin Transl Med. 2023;13:e1344. doi: 10.1002/ctm2.1344. - DOI - PMC - PubMed
    1. Audia S, Mahevas M, Samson M, Godeau B, Bonnotte B. Pathogenesis of immune thrombocytopenia. Autoimmun Rev. 2017;16:620–32. doi: 10.1016/j.autrev.2017.04.012. - DOI - PubMed

Publication types

LinkOut - more resources