. 2023 Oct 13;14(1):6473.
doi: 10.1038/s41467-023-42257-8.

USP36 stabilizes nucleolar Snail1 to promote ribosome biogenesis and cancer cell survival upon ribotoxic stress

Affiliations

USP36 stabilizes nucleolar Snail1 to promote ribosome biogenesis and cancer cell survival upon ribotoxic stress

Kewei Qin et al. Nat Commun. .

Abstract

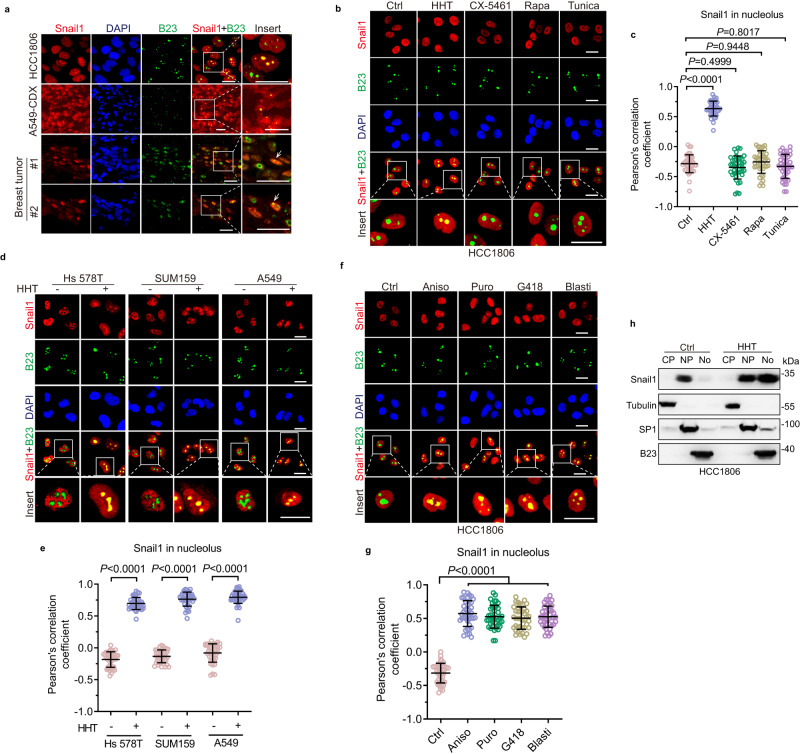
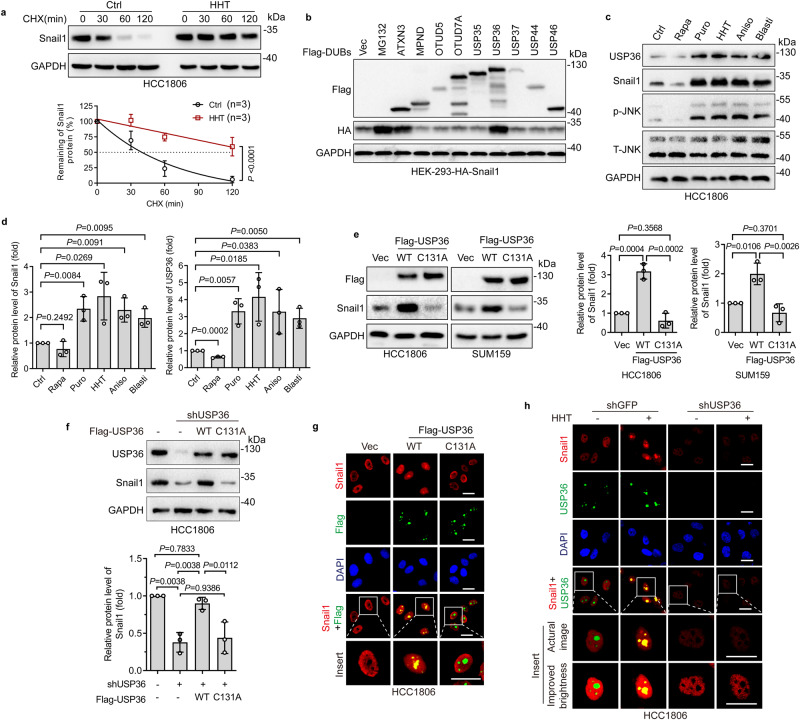
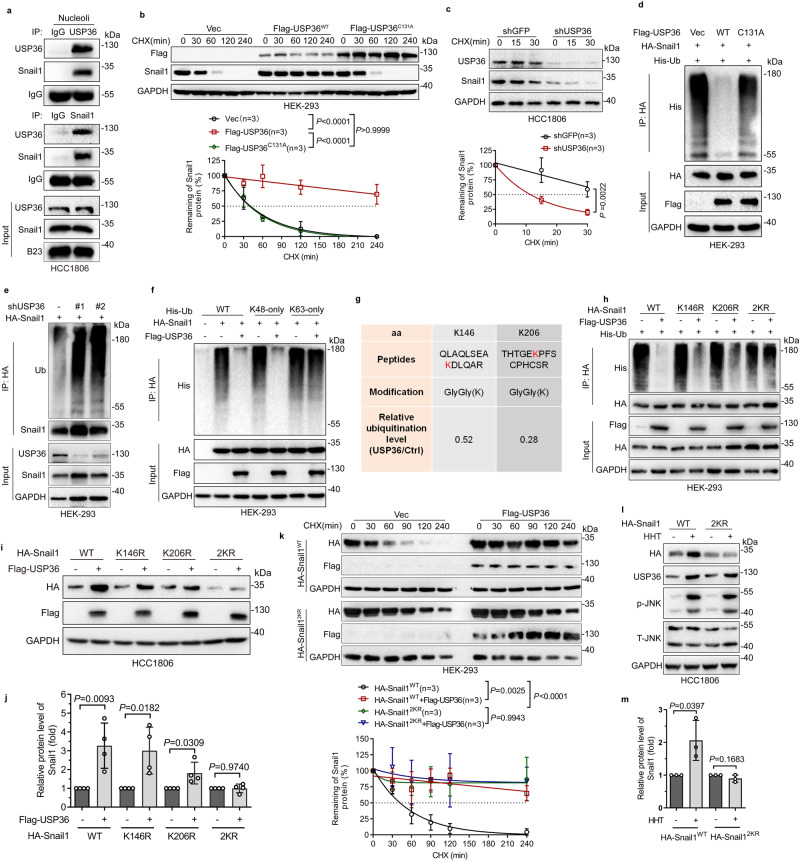
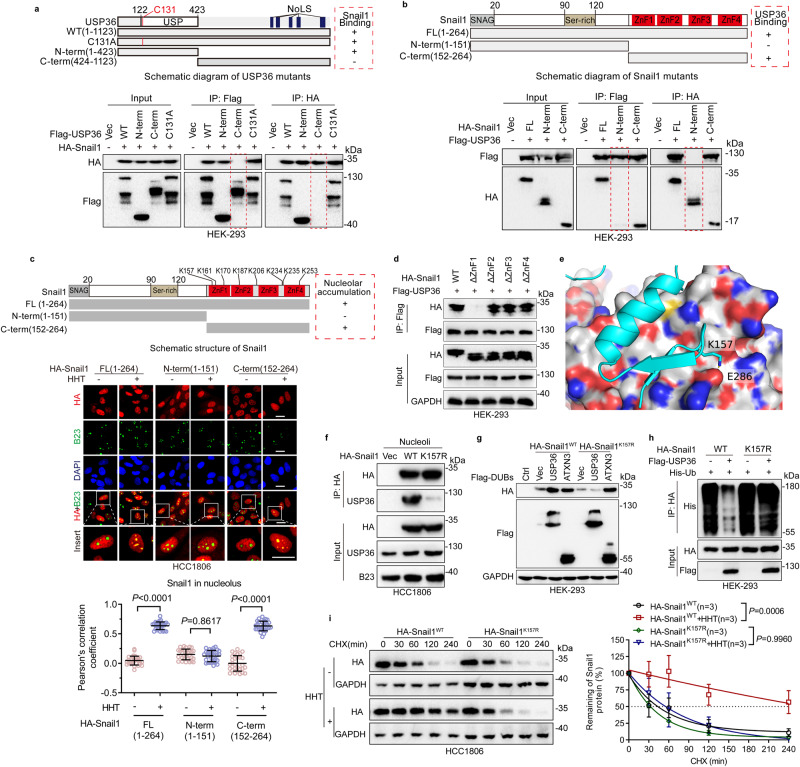
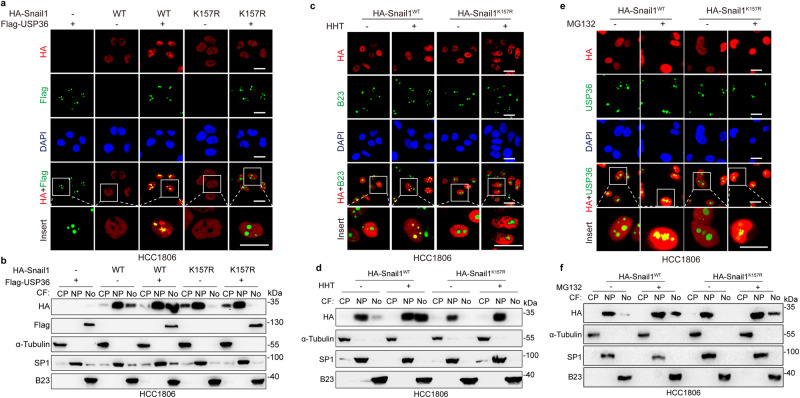
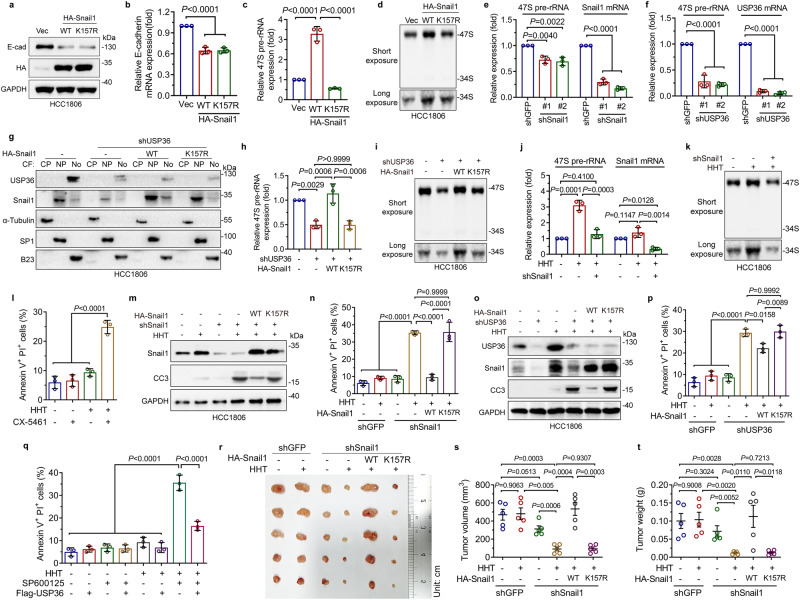
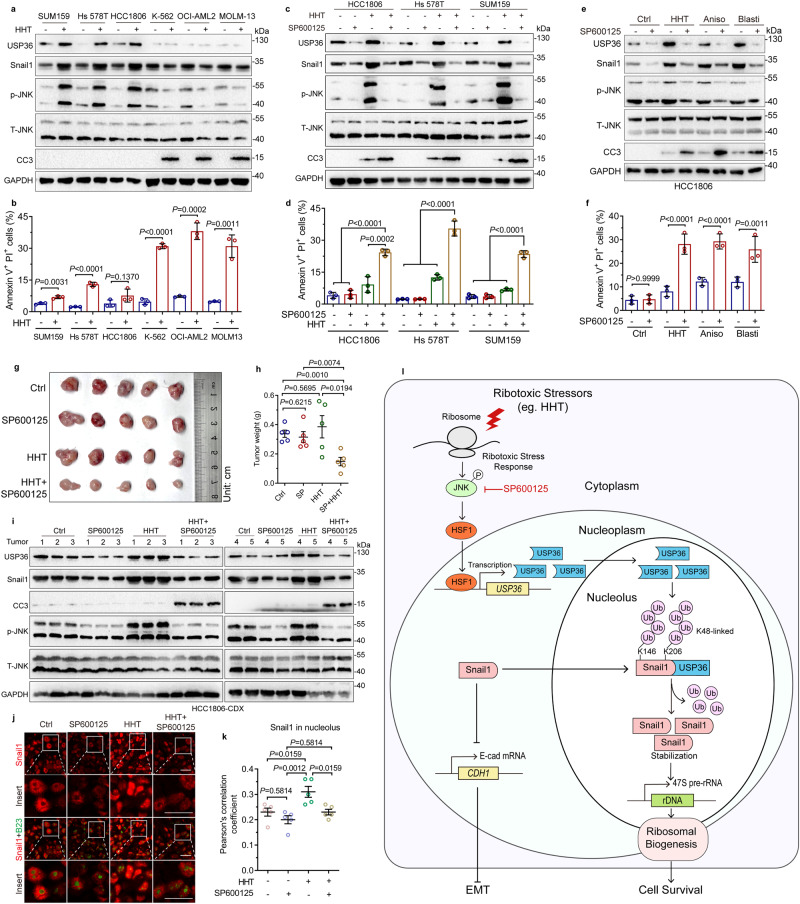
Tumor growth requires elevated ribosome biogenesis. Targeting ribosomes is an important strategy for cancer therapy. The ribosome inhibitor, homoharringtonine (HHT), is used for the clinical treatment of leukemia, yet it is ineffective for the treatment of solid tumors, the reasons for which remain unclear. Here we show that Snail1, a key factor in the regulation of epithelial-to-mesenchymal transition, plays a pivotal role in cellular surveillance response upon ribotoxic stress. Mechanistically, ribotoxic stress activates the JNK-USP36 signaling to stabilize Snail1 in the nucleolus, which facilitates ribosome biogenesis and tumor cell survival. Furthermore, we show that HHT activates the JNK-USP36-Snail1 axis in solid tumor cells, but not in leukemia cells, resulting in solid tumor cell resistance to HHT. Importantly, a combination of HHT with the inhibition of the JNK-USP36-Snail1 axis synergistically inhibits solid tumor growth. Together, this study provides a rationale for targeting the JNK-USP36-Snail1 axis in ribosome inhibition-based solid tumor therapy.


Conflict of interest statement

The authors declare no competing interests.

Figures

Fig. 1
Fig. 1. Ribotoxic stress promotes Snail1 nucleolar accumulation.
a Immunofluorescence staining assays were performed to examine Snail1 or nucleolus marker B23 in either fixed HCC1806 cells, frozen sections of A549 cell-derived xenograft tumor (A549-CDX), or paraffin sections of two clinical breast tumor samples. Notice that Snail1 was accumulated in the nucleolus in a few cells. b, c HCC1806 cells were treated with ribosome inhibitor HHT (20 ng/mL and hereafter), a Pol I inhibitor CX-5461 (200 nM), mTOR inhibitor rapamycin (Rapa, 20 nM), or ER stress inducer Tunicamycin (Tunica, 2 μg/mL) for 24 h. Cells were subjected to immunofluorescence staining analyses (b). The co-localization between Snail1 and B23 (as analyzed by Pearson’s correlation coefficient,) was quantified and statistically analyzed (c). d, e Hs 578T, SUM159, or A549 cells were treated with or without HHT for 24 h. Cells were subjected to immunofluorescence staining analyses (d). The co-localization between Snail1 and B23 was quantified and statistically analyzed (e). f, g HCC1806 cells were treated with a ribotoxic inducer anisomycin (Aniso, 50 ng/mL), puromycin (Puro, 200 ng/mL), G418 (1 μg/mL), or blasticidin (Blasti, 2 μg/mL) for 24 h. Cells were subjected to immunofluorescence staining analyses (f). The co-localization between Snail1 and B23 was quantified and statistically analyzed (g). h HCC1806 cells were treated with or without HHT for 24 h followed by cell fractionation and western blot analyses. CF Cellular fraction, CP Cytoplasm, NP Nucleoplasm, No Nucleolus. This experiment has been repeated for three times with similar results. Quantification of the co-localization between Snail1 and B23 using Pearson’s correlation coefficient (c, e, g). 40 cells derived from three independent experiments were randomly chosen and subjected to quantification analyses. Data were presented as mean ± SD. Comparisons were performed with unpaired two-tailed Student’s t test. Scale bar, 25 μm.
Fig. 2
Fig. 2. Ribotoxic stress upregulates USP36 to promote nucleolar Snail1 accumulation.
a HCC1806 cells were treated with or without HHT (20 ng/mL and hereafter) for 24 h prior to cycloheximide (CHX, 50 μg/mL) treatment for an indicated time interval. Cells were subjected to western blot analyses. The plots of Snail1 protein half-life were presented (n = 3 biologically independent samples). b HEK-293 cells expressing HA-Snail1 were transfected with an indicated deubiquitinase or vector control (Vec) for 48 h. Cells were subjected to western blot analyses. MG132-treated cell lysates were used as a control. c, d HCC1806 cells were treated with rapamycin (Rapa, 20 nM), puromycin (Puro, 200 ng/mL), HHT, anisomycin (Aniso, 50 ng/mL), or blasticidin (Blasti, 2 μg/mL) for 24 h. Cells were subjected to western blot analyses (c). The Snail1 or USP36 protein levels were quantified (d, n = 3 biologically independent samples). T-JNK, total JNK; p-JNK, phospho-JNK (Thr183/Tyr185). e HCC1806 or SUM159 cells were infected with a recombinant lentivirus carrying wild-type (WT) USP36 or USP36-C131A mutant for 48 h. Cells were subjected to western blot analyses. The Snail1 protein levels were quantified (n = 3 biologically independent samples). f HCC1806 expressing shUSP36 were infected with a recombinant lentivirus carrying WT USP36 or USP36-C131A mutant for 48 h. Cells were subjected to western blot analyses. The Snail1 protein levels were quantified (n = 3 biologically independent samples). g HCC1806 cells were infected with a recombinant lentivirus carrying Flag-USP36 (WT or C131A) for 48 h. Cells were subjected to immunofluorescence staining for endogenous nucleolar Snail1 co-localized with Flag-USP36. h HCC1806 cells expressing shUSP36 or shGFP were treated with or without HHT for 24 h. Cells were subjected to immunofluorescence staining analyses. These experiments have been repeated for three times with similar results (b, g, h). Data were presented as mean ± SD and comparisons were performed with one-way ANOVA with Tukey’s test (e, f), two-way ANOVA with Bonferroni’s test (a), and unpaired two-tailed Student’s t test (d). Scale bar, 25 μm.
Fig. 3
Fig. 3. USP36 deubiquitinates Snail1 on Lys146 and Lys206 to stabilize nucleolar Snail1.
a Cell lysates from purified nucleoli of HCC1806 cells were subjected to immunoprecipitation-western blot analyses. b, c HEK-293 cells expressing Flag-USP36 (WT or C131A) (b) or expressing shUSP36 or shGFP (c) were treated with cycloheximide (CHX, 50 μg/mL and hereafter) for an indicated time interval. Cells were subjected to western blot analyses. The plots of Snail1 protein half-life were presented (n = 3 biologically independent samples). df HEK-293-HA-Snail1 cells were transfected with Flag-USP36 (WT or C131A) in the presence of His-Ub for 48 h (d) or HEK-293 cells expressing shUSP36 (#1 or #2) or shGFP were transfected with HA-Snail1 for 48 h (e) or HEK-293-HA-Snail1 cells were transfected with Flag-USP36 in the presence of His-Ub (WT, K48-only, or K63-only) for 48 h (f). Cells were treated with proteasome inhibitor MG132 (10 μM and hereafter) for 6 h followed by immunoprecipitation-western blot analyses. g Two amino acid residues (K146 and K206) of Snail1 deubiquitinated by USP36 were shown. h HEK-293 cells express indicated plasmids for 48 h. Cells were treated with MG132 for 6 h followed by immunoprecipitation-western blot analyses. i, j HCC1806 cells express HA-Snail1 (WT, K146R, K206R, or 2KR) and Flag-USP36 for 48 h. Cells were subjected to western blot analyses (i). The Snail1 protein levels were quantified (j, n = 4 biologically independent samples). k HEK-293 cells expressing HA-Snail1-WT or HA-Snail1-2KR were transfected with Flag-USP36 or Vec for 48 h. Cells were treated with CHX for an indicated time interval followed by western blot analyses. The plots of Snail1 protein half-life were presented (n = 3 biologically independent samples). l, m HCC1806 cells expressing HA-Snail1-WT or HA-Snail1-2KR were treated with or without HHT for 24 h. Cells were subjected to western blot analyses (l). The Snail1 protein levels were quantified (m, n = 3 biologically independent samples). These experiments have been repeated for three times with similar results (a, df, h). Data were presented as mean ± SD and comparisons were performed with two-way ANOVA with Tukey’s (b, k) or Bonferroni’s (c) test and unpaired two-tailed Student’s t test (j, m).
Fig. 4
Fig. 4. Lys157 of Snail1 is essential for stable USP36-Snail1 protein complex formation.
a, b HEK-293 cells were co-transfected with indicated plasmids for 24 h. Cells were treated with proteasome inhibitor MG132 (10 μM and hereafter) for 6 h followed by immunoprecipitation-western blot analyses. c HCC1806 cells expressing an indicated Snail1 mutant were treated with or without HHT (20 ng/mL and hereafter) for 24 h followed by immunofluorescence staining. Quantification of the co-localization between Snail1 and B23 using Pearson’s correlation coefficient. Quantification was carried out on 30 cells derived from three independent experiments. d HEK-293 cells were co-transfected with indicated plasmids for 48 h. Cells were treated with MG132 for 6 h followed by immunoprecipitation-western blot analyses. e The projected structure of the USP domain comprising of linear amino acid sequences of USP36 (122–423 aa) was obtained from the Alphafold2 analyses, which was then used in protein-protein docking (ZDOCK) with the Snail1 protein crystal structure (3W5K [10.2210/pdb3W5K/pdb]). ZDOCK predicted that the lysine 157 (K157) of Snail1 protein is critical for its interaction with USP36. f HCC1806 cells were transfected with HA-Snail1WT or HA-Snail1K157R for 48 h. Cells were treated with MG132 for 6 h followed by immunoprecipitation-western blot analyses. g HEK-293 cells expressing HA-Snail1WT or HA-Snail1K157R were transfected with Flag-USP36 or Flag-ATXN3 for 48 h. Cells were subjected to western blot analyses. h HEK-293 cells expressing His-Ub and HA-Snail1WT or HA-Snail1K157R were transfected with or without Flag-USP36 for 48 h. Cells were treated with MG132 for 6 h followed by immunoprecipitation-western blot analyses. i HCC1806 cells expressing HA-Snail1WT or HA-Snail1K157R were treated with or without HHT for 24 h prior to cycloheximide (CHX, 50 μg/mL) treatment for an indicated time interval. Cell lysates were subjected to western blot analyses and plots for protein half-life were presented (n = 3 biologically independent samples). These experiments have been repeated for three times with similar results (a, b, dh). Data were presented as mean ± SD and comparisons were performed with two-way ANOVA with Tukey’s (i) and unpaired two-tailed Student’s t test) (c). Scale bar, 25 μm.
Fig. 5
Fig. 5. Lys157 of Snail1 is essential for Snail1 nucleolar accumulation.
a, b HCC1806 cells expressing HA-Snail1WT or HA-Snail1K157R were infected with a recombinant lentivirus carrying Flag-USP36 for 48 h, followed by immunofluorescence staining analyses (a) or a procedure of cellular fractionation, which were then subjected to western blot analyses for expression of Snail1 in CP Cytoplasm, NP Nucleoplasm, No Nucleolus (b). c, d HCC1806 cells stably expressing HA-Snail1WTor HA-Snail1K157R were treated with or without HHT (20 ng/mL) for 24 h. Cells were subjected to immunofluorescence staining (c) or a procedure of cellular fractionation, which were then subjected to western blot analyses for expression of Snail1 in CP, NP, or No (d). e, f HCC1806 cells expressing HA-Snail1WT or HA-Snail1K157R were treated with or without proteasome inhibitor MG132 for 6 h. Cells were subjected to immunofluorescence staining (e) or a procedure of cellular fractionation, which were subjected to western blot analyses for expression of Snail1 in CP, NP, or No (f). These experiments have been repeated for three times with similar results (af). Scale bar, 25 μm.
Fig. 6
Fig. 6. Activation of the nucleolar USP36-Snail1 axis promotes ribosome biogenesis to promote cancer cell survival upon ribotoxic stress.
ad HCC1806 cells expressing HA-Snail1WT or HA-Snail1K157R were subjected to western blot (a), qPCR (b, c, n = 3 biologically independent samples), or northern blot (d) analyses. e, f HCC1806 cells expressing shSnail1 (#1 or #2) or shUSP36 (#1 or #2) were subjected to qPCR analyses (n = 3 biologically independent samples). gi HCC1806 cells expressing indicated plasmids were subjected to cellular fractionation (g), qPCR (h, n = 3 biologically independent samples), or northern blot analyses (i). CP Cytoplasm, NP Nucleoplasm; No Nucleolus. j, k HCC1806 cells expressing shSnail1 were treated with or without HHT (20 ng/mL and hereafter) for 24 h. Cells were subjected to qPCR (j, n = 3 biologically independent samples) or northern blot analyses (k). l HCC1806 cells were treated with or without HHT in the presence or absence of CX-5461 (200 nM) for 48 h, followed by PI-Annexin V staining analyses (n = 3 biologically independent samples). mp HCC1806 cells expressing indicated plasmids were treated with or without HHT followed by western blot analyses (m, o) or FACS analyses (n, p, n = 3 biologically independent samples). CC3: Cleaved-Caspase-3. q HCC1806 cells expressing Flag-USP36 were treated with or without HHT in the presence or absence of a JNK inhibitor SP600125 (20 μM) for 48 h. Cells were subjected to FACS analyses (n = 3 biologically independent samples). rt HCC1806 cells (5 × 105), as indicated, were subcutaneously inoculated in 5-week-old female BALB/c nude mice (n = 5/group). On day 3 after inoculation, mice were intraperitoneally (i.p) injected with HHT (1 mg/kg) daily. Mice were monitored for tumor size and sacrificed on day 14 after i.p. Dissected tumors were photographed (r). Tumor volume (s) and weight (t) were presented. These experiments have been repeated for three times with similar results (a, d, g, i, k, m, o). Data were presented as mean ± SD (b, c, e, f, h, j, l, n, p, q) or SEM (s, t). Comparisons were performed with one-way ANOVA with Tukey’s test (b, c, e, f, h, j, l, n, p, q) and unpaired two-tailed Student’s t test (s, t).
Fig. 7
Fig. 7. Inhibition of JNK-USP36-Snail1 Signaling sensitizes solid tumor cells to HHT.
a, b Triple-negative breast cancer (SUM159, Hs 578T, and HCC1806) and non-lymphocytic leukemia (K-562, OCI-AML2, and MOLM-13) cells were treated with or without HHT (20 ng/mL and hereafter). Cells were subjected to western blot analyses (a) or FACS analyses (b). Annexin V + /PI+ cell populations were statistically analyzed (b, n = 3 biologically independent samples). c, d SUM159, Hs 578T, or HCC1806 cells were treated with or without a JNK inhibitor SP600125 (20 μM and hereafter) in the presence or absence of HHT. Cells were subjected to western blot analyses (c) or FACS analyses (d). Annexin V + /PI+ cell populations were statistically analyzed (d, n = 3 biologically independent samples). e, f HCC1806 cells were treated with HHT, anisomycin (Aniso, 50 ng/mL), or blasticidin (Blasti, 2 μg/mL) in the presence or absence of SP600125. Cells were subjected to western blot analyses (e) or FACS analyses (f). Annexin V + /PI+ cell populations were statistically analyzed (f, n = 3 biologically independent samples). gk HCC1806 cells (5 × 105) were subcutaneously inoculated in 5-week-old female BALB/c nude mice (n = 5/group). On day 3 after inoculation, mice were intraperitoneally (i.p) injected with SP600125 (15 mg/kg) and/or HHT (1 mg/kg) daily. Dissected tumors were photographed on day 17 after i.p (g). Tumor weights (h) were presented. The xenograft tumor samples were subjected to western blot analyses (i) or immunofluorescence staining (j). Pearson’s correlation coefficient was used to qualify the co-localization of Snail1 and B23, using images derived from immunostained tumor samples (k). Scale bar, 25 μm. l A model depicts that USP36 stabilizes nucleolar Snail1 to promote ribosome biogenesis and cancer cell survival in response to ribotoxic stress. These experiments have been repeated for three times with similar results (a, c, e). Data were presented as mean ± SD (b, d, f) or SEM (h, k). Comparisons were performed with one-way ANOVA with Tukey’s test (d, f, k) and unpaired two-tailed Student’s t test (b, h). CC3 Cleaved-Caspase-3, T-JNK total JNK, p-JNK phospho-JNK (Thr183/Tyr185).

References

    1. Turi Z, Lacey M, Mistrik M, Moudry P. Impaired ribosome biogenesis: mechanisms and relevance to cancer and aging. Aging. 2019;11:2512–2540. doi: 10.18632/aging.101922. - DOI - PMC - PubMed
    1. Pecoraro, A., Pagano, M., Russo, G. & Russo, A. Ribosome biogenesis and cancer: overview on ribosomal proteins. Int. J. Mol. Sci. 22, 5496 (2021). - PMC - PubMed
    1. Vind AC, Genzor AV, Bekker-Jensen S. Ribosomal stress-surveillance: three pathways is a magic number. Nucleic Acids Res. 2020;48:10648–10661. doi: 10.1093/nar/gkaa757. - DOI - PMC - PubMed
    1. Gürel G, Blaha G, Moore PB, Steitz TA. U2504 determines the species specificity of the A-site cleft antibiotics: the structures of tiamulin, homoharringtonine, and bruceantin bound to the ribosome. J. Mol. Biol. 2009;389:146–156. doi: 10.1016/j.jmb.2009.04.005. - DOI - PMC - PubMed
    1. Lü S, Wang J. Homoharringtonine and omacetaxine for myeloid hematological malignancies. J. Hematol. Oncol. 2014;7:2. doi: 10.1186/1756-8722-7-2. - DOI - PMC - PubMed

Publication types

Substances