. 2023 Oct 13;23(1):362.
doi: 10.1186/s12906-023-04193-4.

Murine sterile fecal filtrate is a potent pharmacological agent that exerts age-independent immunomodulatory effects in RAW264.7 macrophages

Affiliations

Murine sterile fecal filtrate is a potent pharmacological agent that exerts age-independent immunomodulatory effects in RAW264.7 macrophages

Bhawna Diwan et al. BMC Complement Med Ther. .

Abstract

Background: Sterile fecal filtrate (SFF) is being considered a safer alternative to fecal microbiota transplantation (FMT) therapy; however, its bioactive potency is very little understood. The present study thus assessed the age-dependent immunostimulatory and immunomodulatory attributes of murine SFF in vitro.

Methods: SFF from young (Y-SFF) and old (O-SFF) Swiss albino mice were prepared. Immunostimulatory and immunomodulatory effects of SFF were evaluated in resting and lipopolysaccharide (LPS) stimulated macrophage cells by measuring intracellular reactive oxygen species (ROS), nitric oxide (NO) production, inflammatory cytokines profile, as well as gene expression of oxidative and inflammatory transcription factors. SFF were also evaluated for native antioxidant capacity by measuring DPPH and ABTS free radical scavenging activity. Bioactive components present in SFF were also determined by GC/MS analysis.

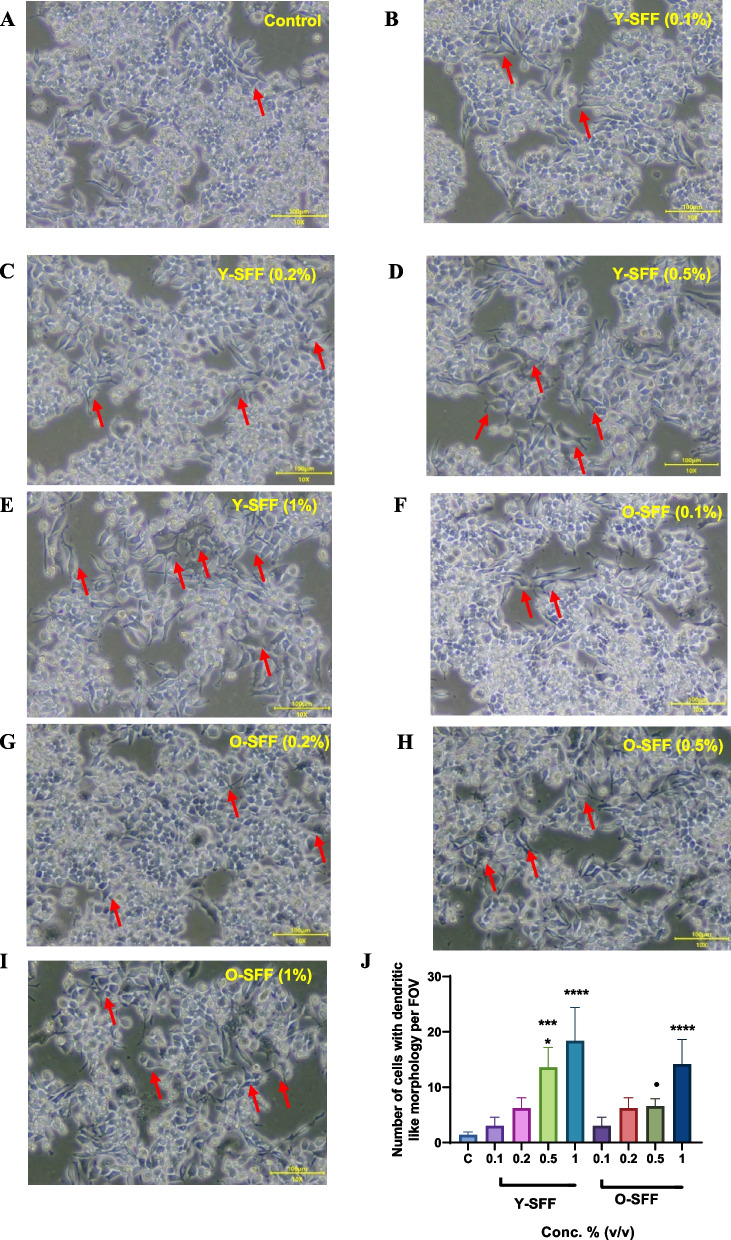
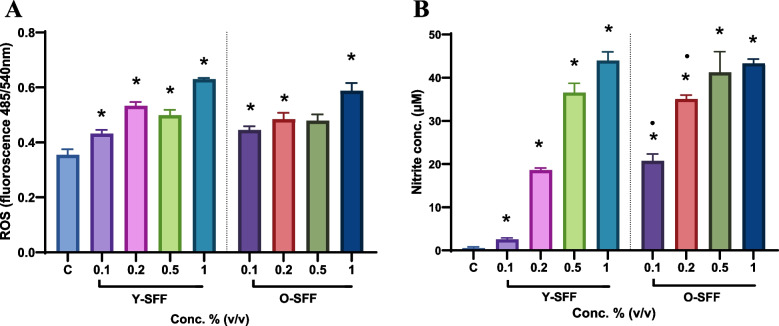
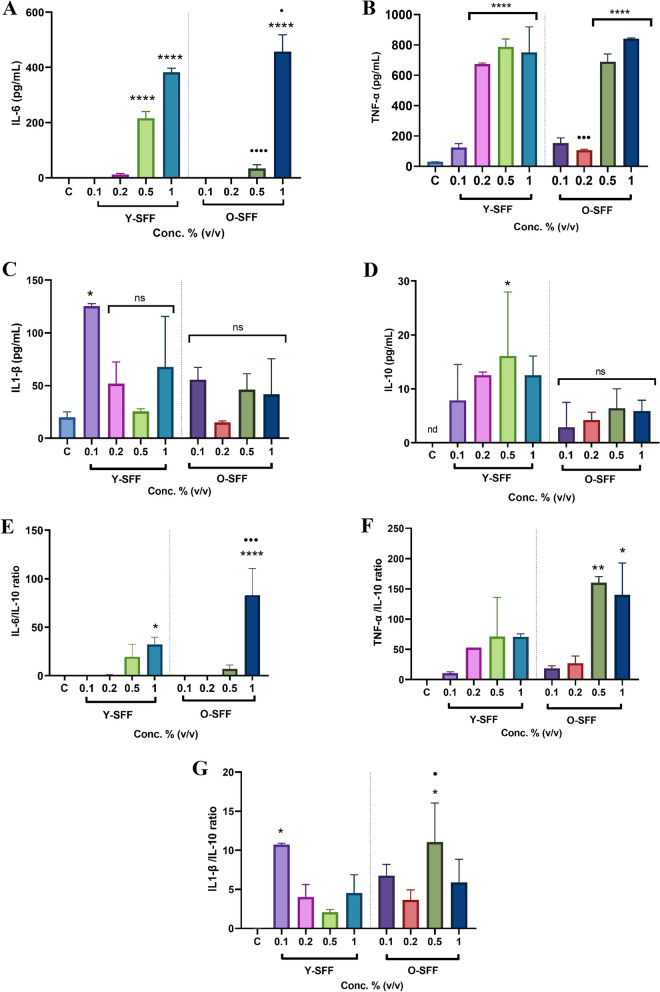
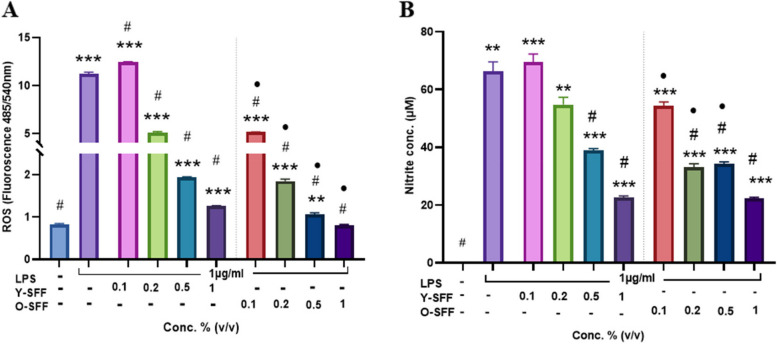
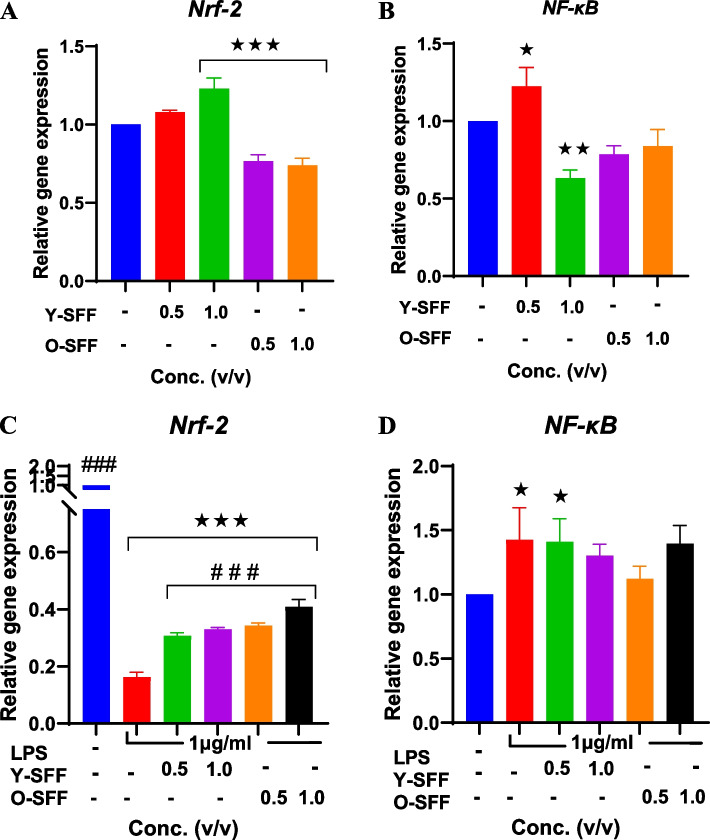
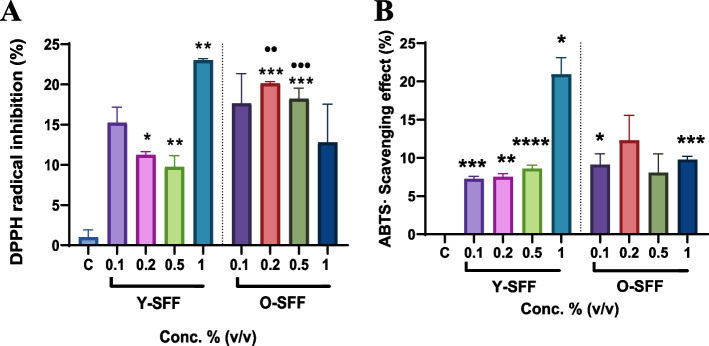
Results: Both Y-SFF and O-SFF induced potent immunostimulatory effects characterized by changes in cell morphology, a significant increase in NO production, ROS levels, and an increased ratio of pro-inflammatory (IL-6, TNF-α, IL-1β) to anti-inflammatory (IL-10) secretory proteins although no significant aggravation in the transcription of NF-κB and Nrf-2 could be observed. Application of LPS to cells significantly augmented a pro-oxidative and pro-inflammatory response which was much higher in comparison to Y-SFF or O-SFF application alone and mediated by strong suppression of Nrf-2 gene expression. Pre-treatment of macrophages with both Y-SFF and O-SFF robustly attenuated cellular hyperresponsiveness to LPS characterized by significantly decreased levels of NO, ROS, and inflammatory cytokines while a concomitant increase in anti-inflammatory protein (IL-10) was observed. Further, both Y-SFF and O-SFF strongly resisted LPS-induced downregulation of Nrf-2 expression although O-SFF appeared to protect cells slightly better from the overall LPS threat. Neat SFF samples exhibited moderate antioxidant capacity and GC/MS analysis of SFF revealed diverse volatile organic compounds characterized by alkanes, organosulphur compounds, furans, amides, amino acids, and antimicrobial elements.

Conclusion: Our results indicate that SFF is a potent stimulant of macrophages and confers strong anti-inflammatory effects regardless of donor age thereby suggesting its therapeutic efficacy in lieu of FMT therapy.

Keywords: Fecal microbiota transplantation; Inflammation; LPS; Macrophages; Sterile fecal filtrate.


Conflict of interest statement

The authors declare no competing interests.

Figures

Fig. 1
Fig. 1
Effect of (A) Y-SFF and (B) O-SFF on macrophage cell viability at different concentrations. Values are mean ± S.D (n = 3). *Represents significant difference as compared to the control group; **p ≤ 0.01, ***p ≤ 0.001
Fig. 2
Fig. 2
Microscopic images of macrophages showing the effect of SFF (A) Control (B-E) Y-SFF and (F-I) O-SFF on cell morphology at 10X magnification. J Number of cells with dendritic-like morphology per FOV for five regions. Values are mean ± S.D (n = 3). *Represents significant difference as compared to the control group; ***p ≤ 0.001, ****p ≤ 0.0001. •Represents significant difference between Y-SFF and O-SFF at the selected mean; •p ≤ 0.05
Fig. 3
Fig. 3
Influence of Y-SFF and O-SFF exposure on (A) Intracellular levels of ROS and (B) NO production in macrophages at different concentrations. Values are mean ± S.D (n = 3). *Represents significant difference as compared to the control group; *p ≤ 0.05, •Represents significant difference between Y-SFF and O-SFF at the selected mean
Fig. 4
Fig. 4
Effect of Y-SFF and O-SFF exposure on interleukins production (A) IL-6 (B) TNF-α (C) IL-1β (D) IL-10 (E) IL-6/IL-10 ratio (F) TNF-α /IL-10 ratio (G) IL-1β/IL-10 ratio production in macrophages at different concentrations. Values are mean ± S.D (n = 3). *Represents significant difference as compared to the control group; *p ≤ 0.05, **p ≤ 0.01, ***p ≤ 0.001, ****p ≤ 0.0001 •Represents significant difference between Y-SFF and O-SFF at the selected mean; •p ≤ 0.05, ••p ≤ 0.01, •••p ≤ 0.001, ••••p ≤ 0.0001
Fig. 5
Fig. 5
Microscopic images of macrophages showing the morphological effects of LPS and SFF. A Control B LPS C-F LPS and Y-SFF at different concentrations G-J LPS and O-SFF at different concentrations at 10X magnification. K Number of cells with dendritic-like morphology per FOV for five regions. Values are mean ± S.D (n = 3). *Represents significant difference as compared to the control group; *p ≤ 0.05, •Represents significant difference between Y-SFF and O-SFF at the selected mean; •••p ≤ 0.001, ••••p ≤ 0.0001. #Represents significant difference as compared to the LPS group at ###p ≤ 0.001, ####p ≤ 0.0001
Fig. 6
Fig. 6
Influence of Y-SFF and O-SFF exposure in attenuating LPS-induced oxidative stress in macrophages (A) Intracellular levels of ROS and (B) NO production at different concentrations. Values are mean ± S.D (n = 3). *Represents significant difference as compared to the control group; *p ≤ 0.05, **p ≤ 0.01, ***p ≤ 0.001, ****p ≤ 0.0001 •Represents significant difference between Y-SFF and O-SFF at the selected mean; •p ≤ 0.05. #Represents significant difference as compared to the LPS group at #p ≤ 0.05
Fig. 7
Fig. 7
Immunomodulatory effects of Y-SFF and O-SFF treatment in attenuating LPS-induced inflammatory stress in macrophages (A) IL-6 (B) TNF-α (C) IL-1β (D) IL-10 (E) IL-6/IL-10 ratio (F) TNF-α /IL-10 ratio (G) IL-1β/IL-10 ratio production in macrophages at different concentrations. Values are mean ± S.D (n = 3). *Represents significant difference as compared to the control group; *p ≤ 0.05, **p ≤ 0.01, ***p ≤ 0.001, ****p ≤ 0.0001 •Represents significant difference between Y-SFF and O-SFF at the selected mean; •p ≤ 0.05, ••p ≤ 0.01, •••p ≤ 0.001, ••••p ≤ 0.0001. #Represents significant difference as compared to the LPS group at.#p ≤ 0.05
Fig. 8
Fig. 8
Influence of SFF on relative gene expression of Nrf-2 and NF-κB during (A, B) immunostimulation and (C, D) during immunomodulation in response to LPS treatment. Values are mean ± S.D (n = 3). *Represents significant difference as compared to the control group; *p ≤ 0.05, **p ≤ 0.01, ***p ≤ 0.001, ****p ≤ 0.0001. ###Represents significant difference as compared to the LPS group at.#p ≤ 0.001
Fig. 9
Fig. 9
Estimation of inherent antioxidant capacity of Y-SFF and O-SFF (A) DPPH radical scavenging assay (B) ABTS radical scavenging assay. Values are mean ± S.D (n = 3). *Represents significant difference as compared to the control group, *p ≤ 0.05 **p ≤ 0.01, ***p ≤ 0.001, ****p ≤ 0.001 •Represents significant difference between Y-SFF and O-SFF at the selected mean; •p ≤ 0.05, ••p ≤ 0.01, •••p ≤ 0.001

References

    1. Zheng D, Liwinski T, Elinav E. Interaction between microbiota and immunity in health and disease. Cell Res. 2020;30(6):492–506. doi: 10.1038/s41422-020-0332-7. - DOI - PMC - PubMed
    1. Rothschild D, Weissbrod O, Barkan E, Kurilshikov A, Korem T, Zeevi D, et al. Environment dominates over host genetics in shaping human gut microbiota. Nature. 2018;555(7695):210–215. doi: 10.1038/nature25973. - DOI - PubMed
    1. Muscogiuri G, Cantone E, Cassarano S, Tuccinardi D, Barrea L, Savastano S, et al. Gut microbiota: a new path to treat obesity. Int J Obes Suppl. 2019;9(1):10–19. doi: 10.1038/s41367-019-0011-7. - DOI - PMC - PubMed
    1. Pisani A, Rausch P, Bang C, Ellul S, Tabone T, Cordina CM, et al. Dysbiosis in the gut microbiota in patients with inflammatory bowel disease during remission. Microbiol Spectr. 2022;10(3):e00616–e622. doi: 10.1128/spectrum.00616-22. - DOI - PMC - PubMed
    1. Lu J, Ma KL, Ruan XZ. Dysbiosis of gut microbiota contributes to the development of diabetes mellitus. Infect Microbes Dis. 2019;1(2):43–48. doi: 10.1097/IM9.0000000000000011. - DOI