. 2023 Oct 13;18(1):7.
doi: 10.1186/s13064-023-00175-x.

Neocortex neurogenesis and maturation in the African greater cane rat

Affiliations

Neocortex neurogenesis and maturation in the African greater cane rat

Oluwaseun Mustapha et al. Neural Dev. .

Abstract

Background: Neocortex development has been extensively studied in altricial rodents such as mouse and rat. Identification of alternative animal models along the "altricial-precocial" spectrum in order to better model and understand neocortex development is warranted. The Greater cane rat (GCR, Thyronomys swinderianus) is an indigenous precocial African rodent. Although basic aspects of brain development in the GCR have been documented, detailed information on neocortex development including the occurrence and abundance of the distinct types of neural progenitor cells (NPCs) in the GCR are lacking.

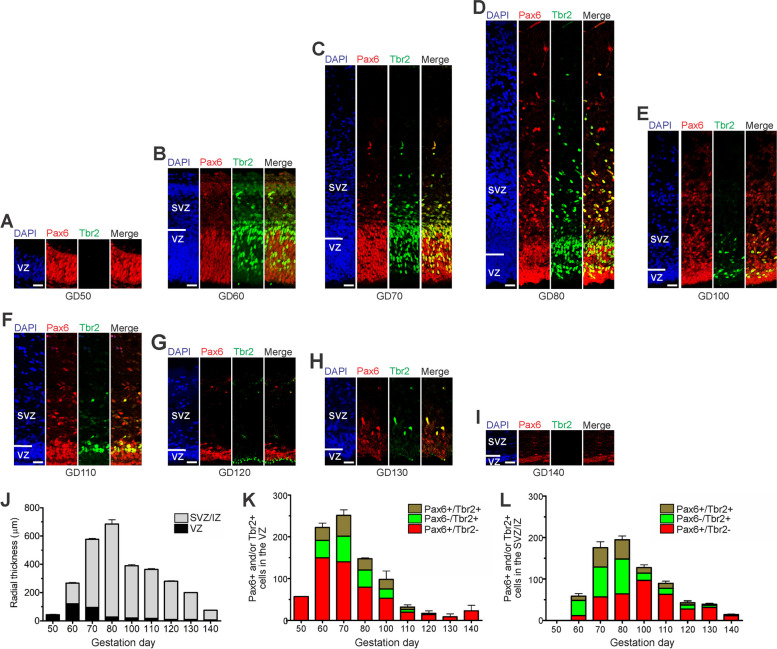
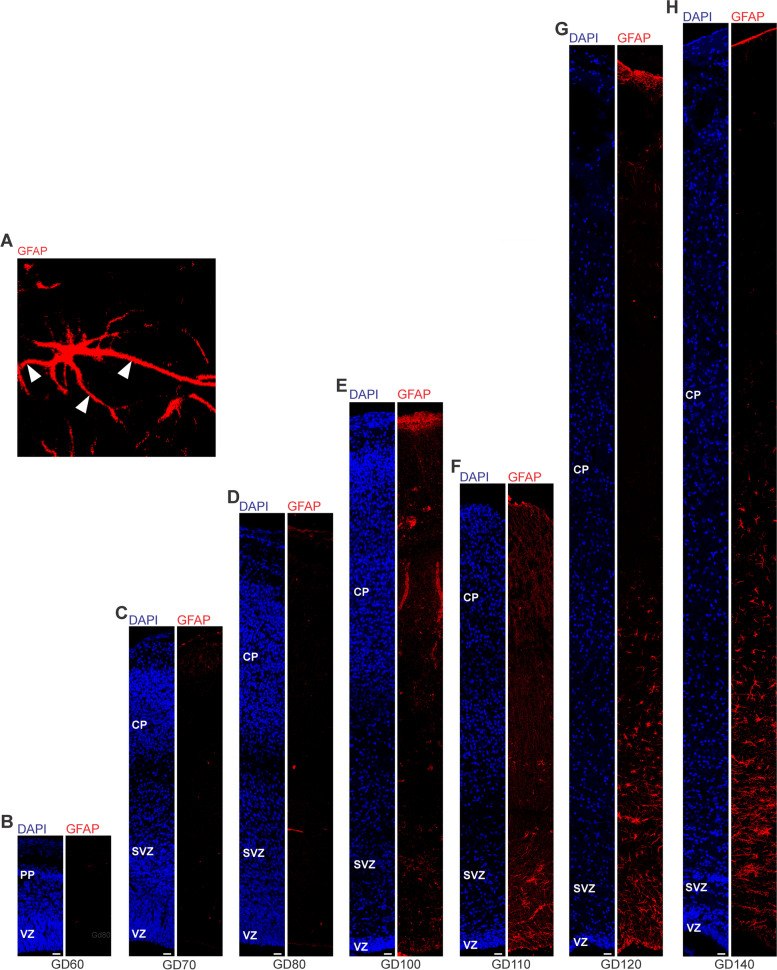
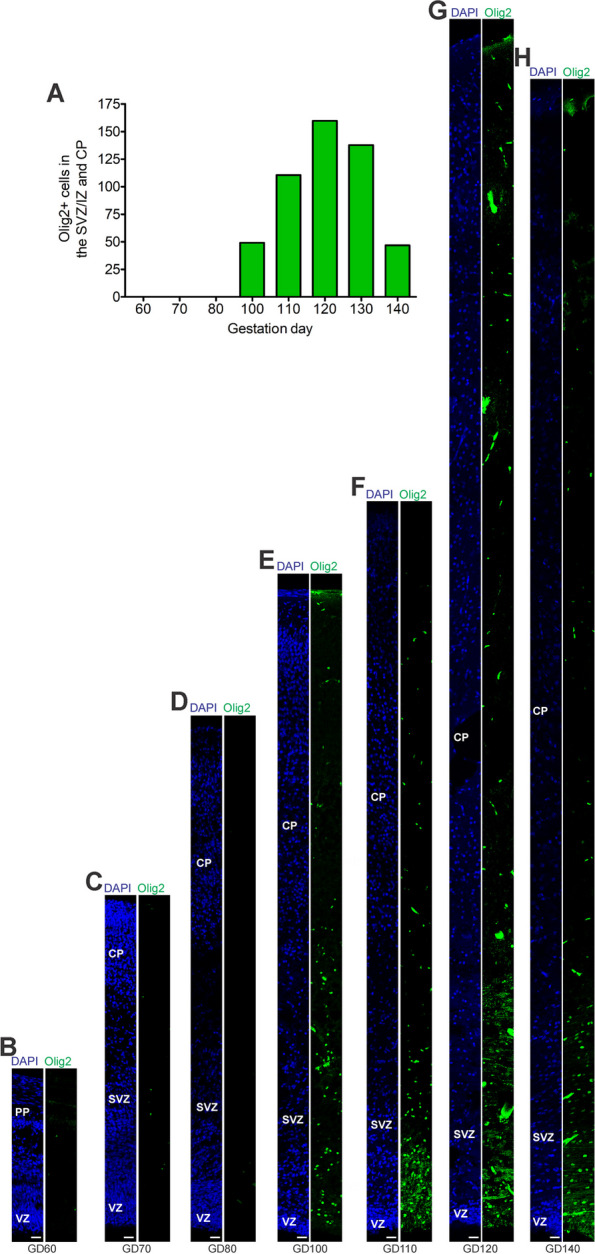
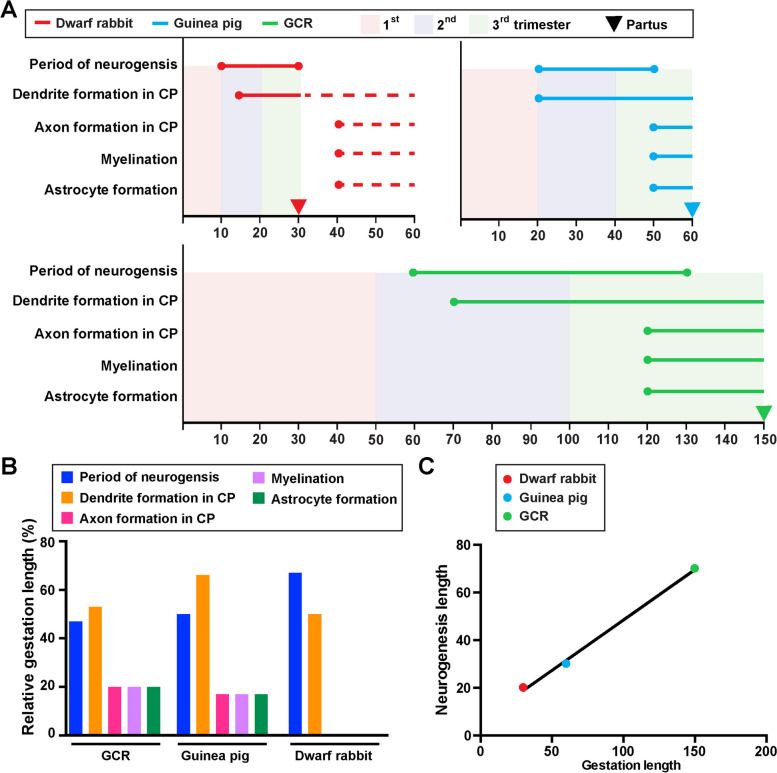
Methods: GCR embryos and fetuses were obtained from timed pregnant dams between gestation days 50-140 and their neocortex was analyzed by immunofluorescence staining using characteristic marker proteins for NPCs, neurons and glia cells. Data were compared with existing data on closely related precocial and altricial species, i.e. guinea pig and dwarf rabbit.

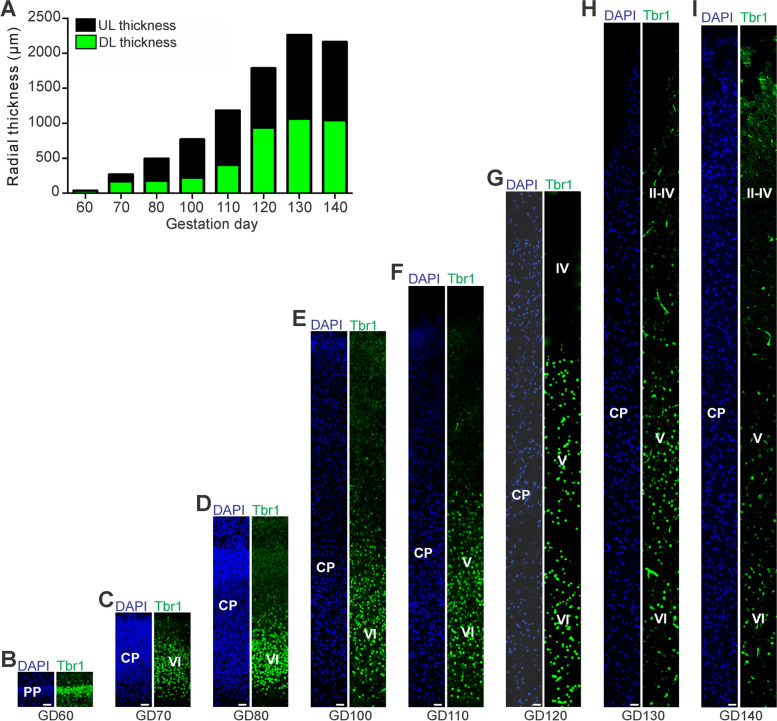
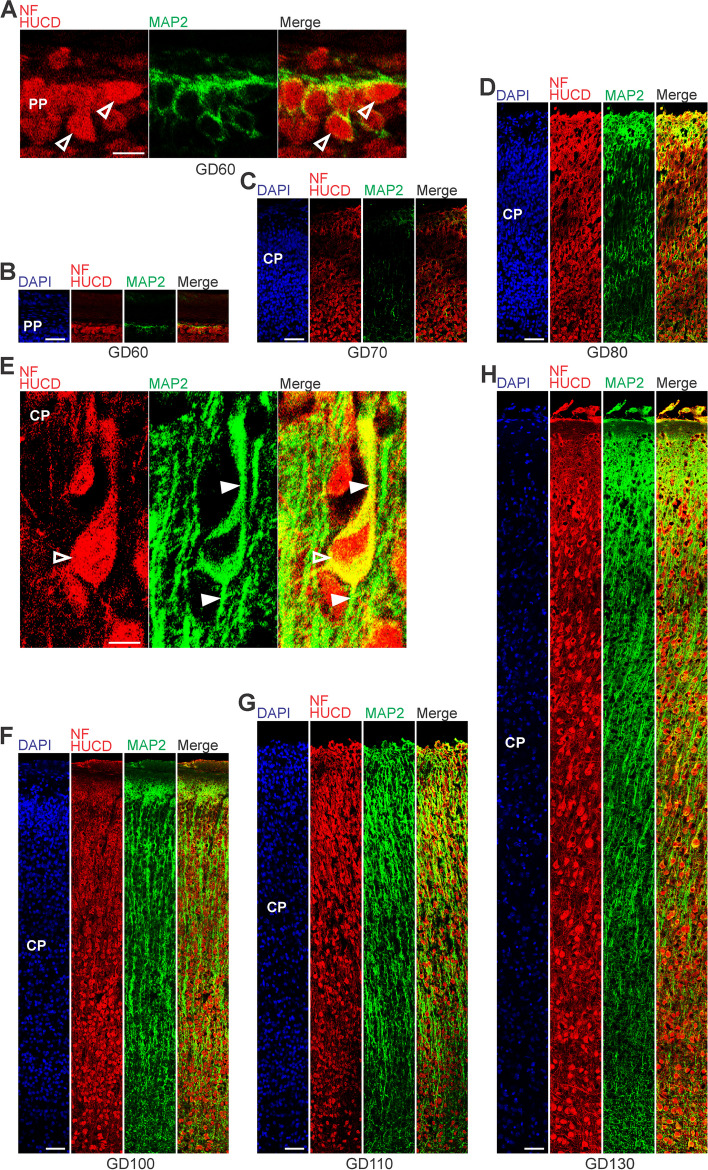
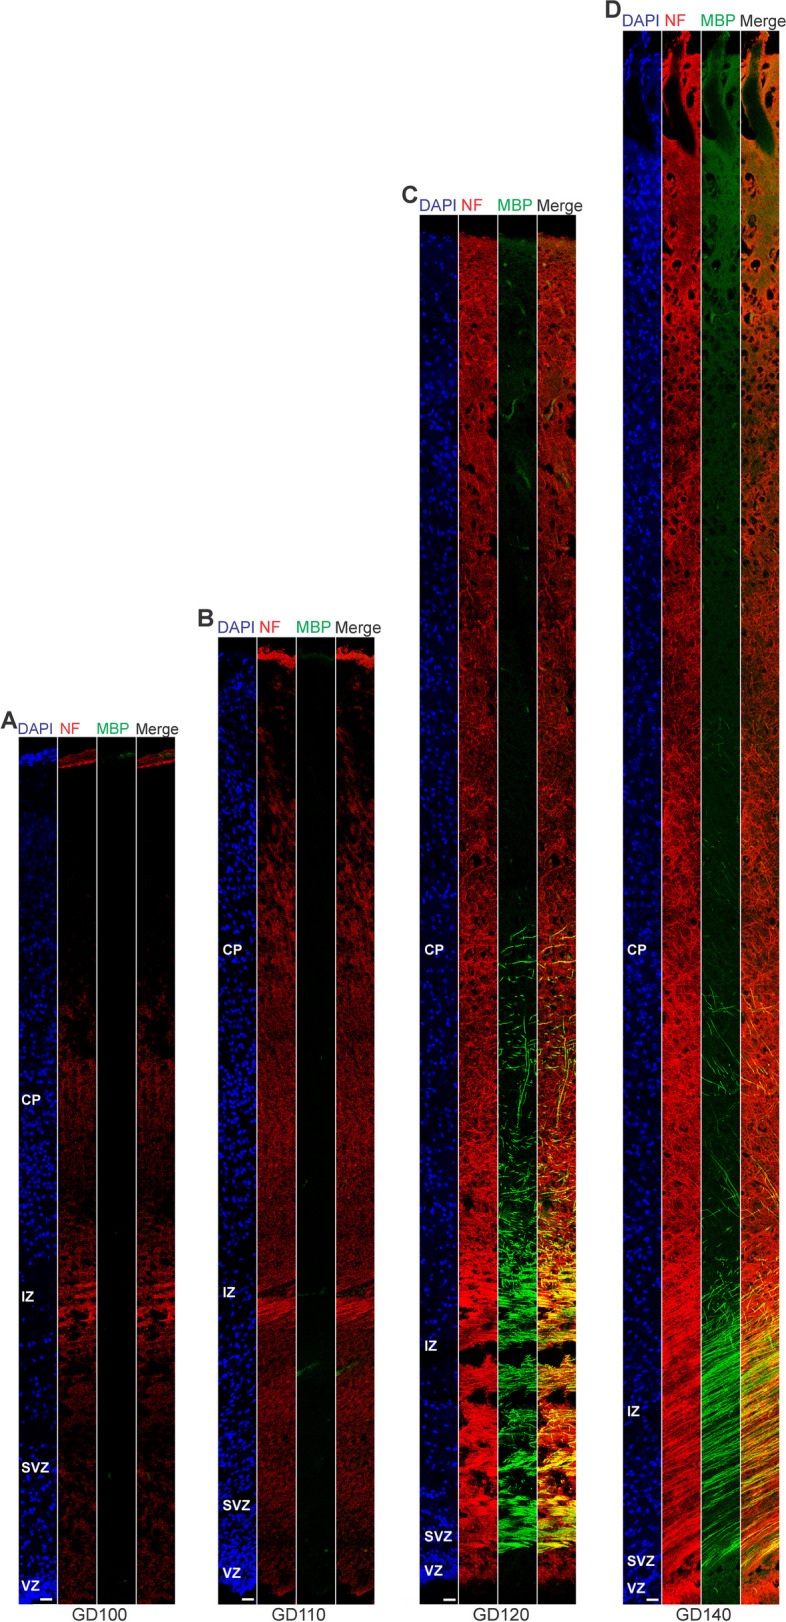
Results: The primary sequence of neuro- and gliogenesis, and neuronal maturation is preserved in the prenatal GCR neocortex. We show that the GCR exhibits a relatively long period of cortical neurogenesis of 70 days. The subventricular zone becomes the major NPC pool during mid-end stages of neurogenesis with Pax6 + NPCs constituting the major basal progenitor subtype in the GCR neocortex. Whereas dendrite formation in the GCR cortical plate appears to initiate immediately after the onset of neurogenesis, major aspects of axon formation and maturation, and astrogenesis do not begin until mid-neurogenesis. Similar to the guinea pig, the GCR neocortex exhibits a high maturation status, containing neurons with well-developed dendrites and myelinated axons and astrocytes at birth, thus providing further evidence for the notion that a great proportion of neocortex growth and maturation in precocial mammals occurs before birth.

Conclusions: Together, this work has deepened our understanding of neocortex development of the GCR, of the timing and the cellular differences that regulate brain growth and development within the altricial-precocial spectrum and its suitability as a research model for neurodevelopmental studies. The timelines of brain development provided by this study may serve as empirical reference data and foundation in future studies in order to model and better understand neurodevelopment and associated alterations.

Keywords: Altricial; Grasscutter; Greater cane rat; Neocortex development; Neurogenesis; Neuron maturation; Precocial.


Conflict of interest statement

The authors declare no competing interests.

Figures

Fig. 1
Fig. 1
Pax6 and Tbr2 expression in the germinal zones of the developing GCR neocortex. A–I Double-Immunofluorescence for Pax6 (red) and Tbr2 (green) and DAPI staining (blue) on 20 µm cryosections of GD50 and 30 µm cryosections of GD60-140 GCR neocortex. Scale bars, 25 µm. A, B The entire cortical is shown. C–I The top margin of the image corresponds to the transition zone SVZ/intermediate zone. J Quantification of the radial thickness of the germinal zones in the developing GCR neocortex. K, L Quantification of Pax6 + /Tbr2– (red), Pax6 + /Tbr2 + (brown) and Pax6–/Tbr2 + (green) NPCs in the VZ (K) and SVZ (L), expressed as number of cells per 100 µm ventricular surface. Cortical wall corresponding to a total ventricular surface of 309–1426 µm was analyzed. (J–L) Data represent mean ± SEM and are from two fetuses each. VZ, ventricular zone; SVZ/IZ, subventricular zone/intermediate zone; CP, cortical plate
Fig. 2
Fig. 2
Tbr1 expression in the cortical plate of the developing GCR neocortex. A Quantification of radial thickness of the upper (Tbr1–) and deeper (Tbr2 +) layers of the developing neocortex. Data are from one fetus each. B–I Immunofluorescence for Tbr1 (green) and DAPI staining (blue) on 30 µm cryosections of GD60-140 GCR neocortex. The bottom margin corresponds to the apical boundary of the PP (B) or the transition zone SP/CP (C–I). Scale bars, 25 µm. A–I DL, deep layer; UL, upper layer; PP, preplate; CP, cortical plate; SP, subplate
Fig. 3
Fig. 3
MAP2, Hu C/D and neurofilament expression in the preplate and cortical plate of the developing GCR neocortex. A–H Combined immunofluorescence for NF and HUCD (red), and MAP2 (green) and DAPI staining (blue) on 30 µm cryosections of GD60-140 GCR neocortex. A Images show neurons with Hu C/D + soma (open arrowhead) in higher magnification of GD60 GCR neocortex. Scale bar, 100 µm. B–D The bottom margin corresponds to the apical boundary of the preplate (B) or the transition zone SP/CP (C, D). Scale bars, 50 µm. E Images show neurons with Hu C/D + soma (open arrowhead) and extending Map2 + dendrites (solid arrowhead) in higher magnification of GD130 GCR neocortex. Scale bar, 100 µm. F–H The bottom margin corresponds to the transition zone SP/CP. Scale bars, 100 µm. A–H PP, preplate; CP, cortical plate; SP, subplate
Fig. 4
Fig. 4
Neurofilament and MBP expression in the cortical wall of the developing GCR neocortex. A–D. Double-Immunofluorescence for neurofilament (NF) (red) and MBP (green) and DAPI staining (blue) on 30 µm cryosections of GD100-140 GCR neocortex. The entire cortical wall is shown. VZ, ventricular zone; SVZ, subventricular zone; IZ, intermediate zone; CP, cortical plate. Scale bars, 25 µm
Fig. 5
Fig. 5
GFAP expression in the cortical wall of the developing GCR neocortex. A–H. Immunofluorescence for GFAP (red) and DAPI staining (blue) on 30 µm cryosections of GD60-140 GCR neocortex. (A) Image show GFAP + astrocyte with soma and extending processes (solid arrowhead) in higher magnification of GD120 GCR neocortex. Scale bar, 100 µm. B–H The entire cortical wall is shown. Scale bars, 25 µm. VZ, ventricular zone; SVZ, subventricular zone; IZ, intermediate zone; CP, cortical plate
Fig. 6
Fig. 6
Olig2 expression in the cortical wall of the developing GCR neocortex. A Quantification of Olig2 + cells in cortical wall of the GD60-140 GCR neocortex, expressed as number of cells per 100 µm ventricular surface. Cortical wall corresponding to a total ventricular surface of 640–2035 µm was analyzed. Data are from one fetus each. B–H Immunofluorescence for Olig2 (green) and DAPI staining (blue) on 30 µm cryosections of GD60-140 GCR neocortex. The entire cortical wall is shown. VZ, ventricular zone; SVZ, subventricular zone; IZ, intermediate zone; CP, cortical plate. Scale bars, 25 µm
Fig. 7
Fig. 7
Comparison of specific neurodevelopmental timelines of the neocortex of the GCR, dwarf rabbit and guinea pig neocortex. A Onset and duration of the period of neurogenesis, dendrite formation, axon formation, myelination, and astrocyte formation in the developing GCR (green), dwarf rabbit (red) and guinea pig (blue) neocortex. Data for the period of neurogenesis in the GCR are based on the development of Tbr2 + NPCs in the SVZ (Fig. 1); data for dendrite formation, axon formation, myelination, and astrocyte formation in the GCR are based on immunofluorescence staining (Figs. 2, 3, 4 and 5). Data for dwraf rabbit and guinea pig are obtained from the literature [59]. Dashed lines indicate development after birth. Arrows indicate the respective time of birth (partus). CP, cortical plate. B Relative lengths of duration of the period of neurogenesis, dendrite formation, axon formation, myelination, and astrocyte formation, expressed as percentage of gestation, in the GCR, dwarf rabbit and guinea pig. C Plot of the relationship between the neurogenic period and gestation length, both expressed in absolute days, in the GCR (green), dwarf rabbit (red) and guinea pig (green). The linear regression curve is plotted: y = 0,4231*x + 6,154, P < 0.05. Pearson correlation coefficient r = 0.9986, P = 0.0334

Similar articles

References

    1. Adu EK, Yeboah S. On the use of the perineal stain as an index of sexual maturity and breeding condition in the male greater cane rat, Thryonomys swinderianus. Temminck Trop Anim Health Prod. 2003;35(5):433–439. doi: 10.1023/A:1025867512986. - DOI - PubMed
    1. Akpan MO, Samuel OM, Emikpe BO. Regional skin histomorphology in adult greater cane rats (Thryonomys swinderianus): a pilot study. Int J Vet Sci Med. 2018;6(2):219–226. doi: 10.1016/j.ijvsm.2018.11.001. - DOI - PMC - PubMed
    1. Aluko FA, Salako AE, Ngere LO, Awojobi HA. Reproductive history of cane rat: a review of the reproduction and reproductive performance. J Agric Soc Res. 2014;14(1):109–115.
    1. Álvarez-Hernán G, de Mera-Rodríguez JA, Hernández-Núñez I, Acedo A, Marzal A, Gañán Y, et al. Timing and distribution of mitotic activity in the retina during precocial and altricial modes of avian development. Front Neurosci. 2022;16:853544. doi: 10.3389/fnins.2022.853544. - DOI - PMC - PubMed
    1. Andrews MG, Subramanian L, Salma J, Kriegstein AR. How mechanisms of stem cell polarity shape the human cerebral cortex. Nat Rev Neurosci. 2022;23(12):711–724. doi: 10.1038/s41583-022-00631-3. - DOI - PMC - PubMed

LinkOut - more resources