. 2023 Oct 14;20(1):52.
doi: 10.1186/s12979-023-00376-2.

Effects of autologous serum on TREM2 and APOE in a personalized monocyte-derived macrophage assay of late-onset Alzheimer's patients

Affiliations

Effects of autologous serum on TREM2 and APOE in a personalized monocyte-derived macrophage assay of late-onset Alzheimer's patients

Neriman Eren et al. Immun Ageing. .

Abstract

Background: Age-associated deterioration of the immune system contributes to a chronic low-grade inflammatory state known as "inflammaging" and is implicated in the pathogenesis of late-onset Alzheimer's disease (LOAD). Whether changes in the tissue environment caused by circulatory factors associated with aging may alter the innate immune response is unknown. Monocyte-derived macrophages (Mo-MФs) infiltrating the brain alongside microglia are postulated to play a modulatory role in LOAD and both express triggering receptor expressed on myeloid cells 2 (TREM2). Apolipoprotein E (APOE) acts as a ligand for TREM2, and their role in amyloid beta (Aβ) clearance highlights their importance in LOAD. However, the influence of the patient's own milieu (autologous serum) on the synthesis of TREM2 and APOE in infiltrating macrophages remains unknown.

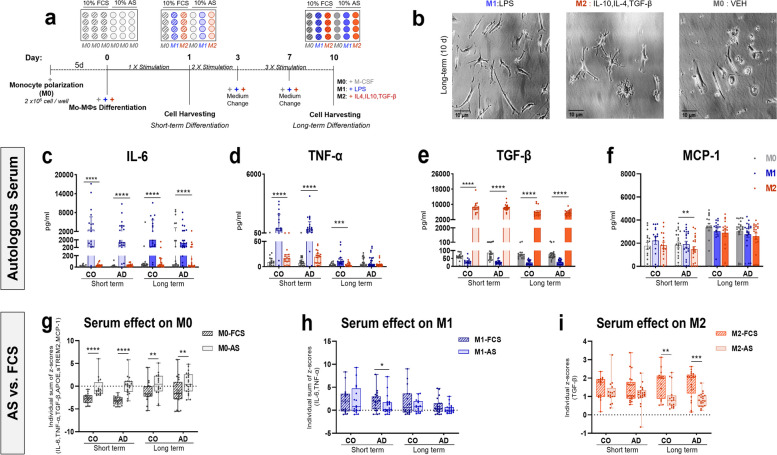
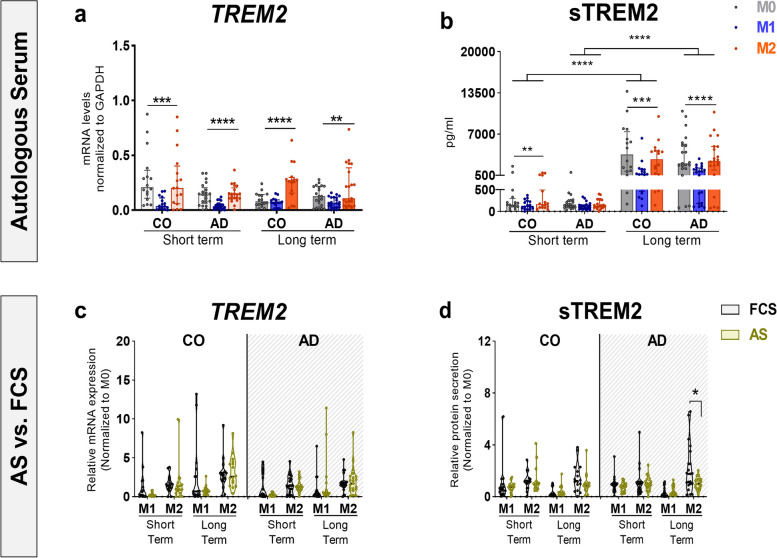
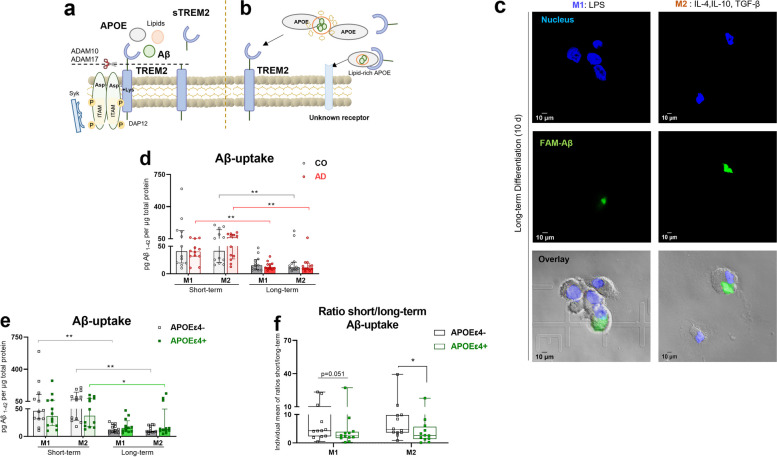
Objectives: To functionally assess patient-specific TREM2 and APOE synthesis, we designed a personalized assay based on Mo-MФs using monocytes from LOAD patients and matched controls (CO). We assessed the influence of each participant's own milieu, by examining the effect of short- (1 day) and long- (10 days) term differentiation of the cells in the presence of the donor´s autologous serum (AS) into M1-, M2- or M0-macrophages. Additionally, sex differences and Aβ-uptake ability in short- and long-term differentiated Mo-MФs were assessed.

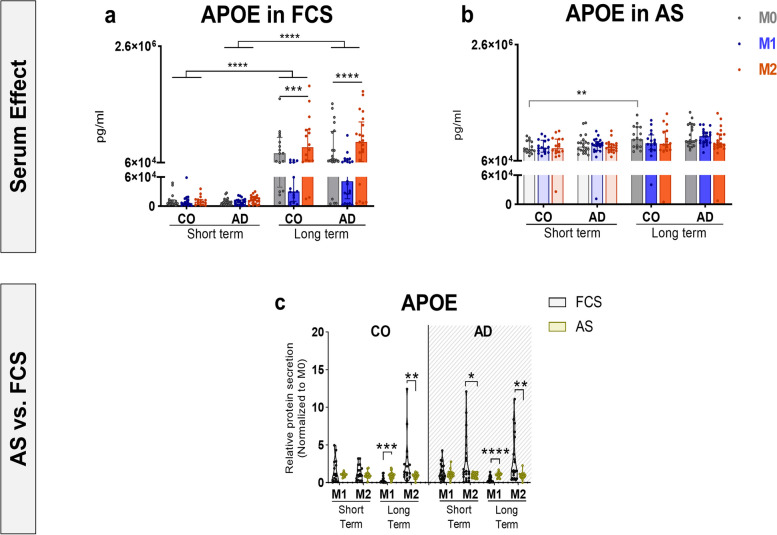
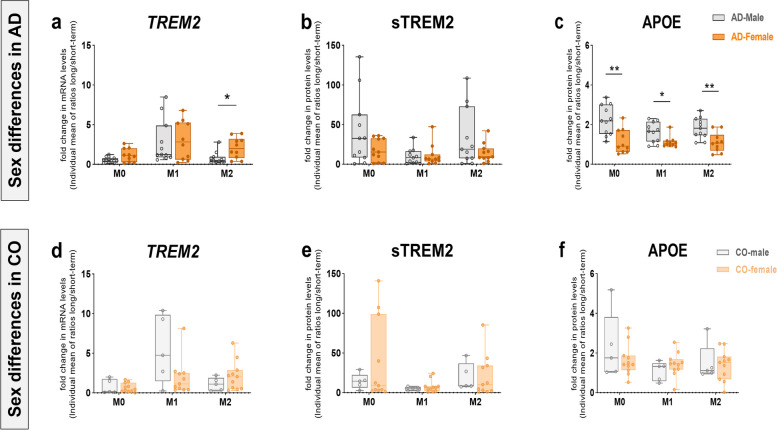
Results: We showed a time-dependent increase in TREM2 and APOE protein levels in LOAD- and CO-derived cells. While AS did not differentially modulate TREM2 compared to standard fetal calf serum (FCS), AS decreased APOE levels in M2 macrophages but increased levels in M1 macrophages. Interestingly, higher levels of TREM2 and lower levels of APOE were detected in female- than in male- LOAD patients. Finally, we report decreased Aβ-uptake in long-term differentiated CO- and LOAD-derived cells, particularly in APOEε4(+) carriers.

Conclusions: We demonstrate for the first time the suitability of a personalized Mo-MФ cell culture-based assay for studying functional TREM2 and APOE synthesis in a patient's own aged milieu. Our strategy may thus provide a useful tool for future research on diagnostic and therapeutic aspects of personalized medicine.

Keywords: APOE; Amyloid-beta uptake; Inflammaging; Late-onset Alzheimer's disease; Monocyte-derived macrophages; Patient-derived personalized assay; Sex differences; TREM2.


Conflict of interest statement

The authors declare no competing interests.

Figures

Fig. 1
Fig. 1
Short- and long-term differentiation of patient-derived M0-, M1- and M2- macrophages in autologous serum (AS). a Experimental design: Mo-MФs were differentiated for the total periods of 6 and 15 days with M-CSF, of which respectively the last 1 (short-term) and 10 days (long-term) were under differentiation to M1 (LPS), M2 (IL-4, IL10, TGF-β) and M0 (vehicle) macrophages in AS or FCS. b Morphology of the Mo-MФs after long-term differentiation in AS observed with a Zeiss Axiovert 10 inverted microscope and captured with a SWIFT Cam SC500 5.1 MP. Magnification = 25x, scale bar = 10 µm. Secretion levels of c IL-6 and d TNF-α; e TGF-β and f MCP-1 inflammatory markers in short-term and long-term differentiated Mo-MФs from patients with AD (n = 21) and CO (n = 16) in AS. Effect of AS vs. FCS on short-term and long-term g M0, h M1 and i M2 differentiated macrophages from patients with AD (n = 21) and CO (n = 16). Dots represent individual participant values. c-f Closed bars and symbols represent M0 (light grey for short-term; dark grey for long-term), M1 (light blue for short-term; dark blue for long-term) and M2 (light orange for short-term; dark orange for long-term) macrophages respectively. g-i Closed bars and symbols represent M0 (grey with pattern for FCS; without pattern for AS), M1 (blue with pattern for FCS; without pattern for AS) and M2 (orange with pattern for FCS; without pattern for AS) macrophages respectively. The Friedman ANOVA test or Wilcoxon signed rank test (paired) was used to compare within-group differences. Significant values of ANOVA tests were then subjected to Dunn's multiple comparison test with Bonferroni correction. Statistical significance was determined at the p ≤ 0.05 level unless a Bonferroni adjustment was required for multiple comparisons (p = 0.0167 (p/n, assuming n = 3 comparisons))
Fig. 2
Fig. 2
Autologous serum modulation of TREM2 synthesis in short- and long-term differentiated Mo-MФs and serum effect. a TREM2 mRNA and b sTREM2 levels in Mo-MФ cultures from AD patients (n = 21) and CO (n = 16) in AS. Effect of AS vs. FCS on c TREM2 mRNA and d sTREM2 levels in short-term and long-term Mo-MФs from AD patients (n = 21) and CO (n = 16). Dots represent individual participant values. a, b Closed bars and symbols represent M0 (light grey for short-term; dark grey for long-term), M1 (light blue for short-term; dark blue for long-term) and M2 (light orange for short-term; dark orange for long-term) macrophages respectively. c, d Closed violins and symbols represent AS (green) and FCS (dark grey). mRNA (normalized to GAPDH) expression was measured with RT-qPCR. The Friedman ANOVA test or Wilcoxon signed rank test (paired) was used to compare within-group differences. Significant values of ANOVA tests were then subjected to Dunn's multiple comparison test with Bonferroni correction. Statistical significance was determined at the p ≤ 0.05 level unless a Bonferroni adjustment was required for multiple comparisons) p* < 0.0167 (p/n, assuming n = 3 comparison)
Fig. 3
Fig. 3
APOE synthesis in short- and long-term differentiated Mo-MФs and serum effects. APOE secretion levels in Mo-MФs cultures from AD patients (n = 21) and CO (n = 16) a in FCS or b in AS. c Effects of AS vs. FCS on APOE secretion levels in short-term and long-term Mo-MФs from AD patients (n = 21) and CO (n = 16). Dots represent individual participant values. a, b Closed bars and symbols represent M0 (light grey for short-term; dark grey for long-term), M1 (light blue for short-term; dark blue for long-term) and M2 (light orange for short-term; dark orange for long-term) macrophages respectively. c Closed violins and symbols represent AS (green) and FCS (dark grey). mRNA (normalized to GAPDH) expression was measured with RT-qPCR. The Friedman ANOVA test or Wilcoxon signed rank test (paired) was used to compare within-group differences. Significant values of ANOVA tests were then subjected to Dunn's multiple comparison test with Bonferroni correction. Statistical significance was determined at the p ≤ 0.05 level unless a Bonferroni adjustment was required for multiple comparisons) p* < 0.0167 (p/n, assuming n = 3 comparison)
Fig. 4
Fig. 4
Sex differences in TREM2 and APOE levels in patient-specific Mo-MФs. Fold increase in a TREM2 mRNA, b sTREM2 and c APOE levels in Mo-MФ cultures from AD-female patients (n = 10) vs. AD-male patients (n = 11) after long-term compared to short-term differentiation in AS. Fold increase in d TREM2 mRNA, e sTREM2 and f APOE levels in Mo-MФs cultures from CO-female patients (n = 11) vs. CO-male patients (n = 5) after long-term compared to short-term differentiation in AS. a-f Closed bars and circle symbols represent male (dark grey for AD, light grey for CO) or female (dark orange for AD, light orange for CO) patients. mRNA (normalized to GAPDH) expression was measured with RT-qPCR. A pairwise comparison of groups was performed with the Mann Whitney U-test (paired groups) (*p < 0.05, **p < 0.01, ***p < 0.001)
Fig. 5
Fig. 5
Lower Aβ-uptake of APOEε4( +)- derived M1- and M2- macrophages. a, b Schematic overview of TREM2 proteolytic cleavage product sTREM2 formation and TREM2-modulated Aβ uptake. c Confocal microscopy analysis of fluorescence Aβ (green)-uptake by long-term differentiated M1- and M2- macrophages in FCS at 24 h, representative of 3 independent experiments. Staining for the nucleus (blue) shows that Aβ1-42 peptides are internalized within the cells. Magnification = 63x, scale bar = 10 µm. Comparison of Aβ-uptake ability of M1- and M2- differentiated macrophages in FCS from patients with d AD vs. CO (n = 12, per group) and e APOEε4(+) and APOEε4(-) (n = 12, per group). f Genotype effect on the fold change in Aβ-uptake ability due to long-term compared to short-term M1-and M2- macrophage differentiation in FCS. Aβ-uptake levels in Mo-MФs were quantified with a bead-based immunoassay. Dots represent individual participant values (circle for AD and CO; square for APOEε4(+) and APOEε4(-)). Closed bars and symbols represent CO (light grey for short-term; dark grey for long-term) vs. AD (light red for short-term; dark red for long-term) and APOEε4(-) (light grey for short-term; dark grey for long-term) vs. APOEε4(+) (light green for short-term; dark green for long-term). Open bars and symbols represent APOEε4(-) (black), while open bars and closed symbols represent APOEε4(+) (green). The Friedman ANOVA was used to compare within-group differences, while the Mann Whitney U-test (paired groups) was used to assess between-group differences. Significant values of ANOVA tests were then subjected to Dunn's multiple comparison test with Bonferroni correction. Statistical significance was determined at the p ≤ 0.05 level unless a Bonferroni adjustment was required for multiple comparisons (p* < 0.0167 (p/n, assuming n = 3 comparison)

References

    1. Prince M. World Alzheimer Report 2015: The Global Impact of Dementia | Alzheimer’s Disease International. World Alzheimer’s Report. 2015.
    1. Sheppard O., & Coleman M. Alzheimer’s Disease: Etiology, Neuropathology and Pathogenesis. Alzheimer’s Disease: Drug Discovery. 2020:1–22. 10.36255/EXONPUBLICATIONS.ALZHEIMERSDISEASE.2020.CH1.
    1. Talwar P., Sinha J., Grover S., Rawat C., Kushwaha S., Agarwal R., Taneja V., & Kukreti R. Dissecting Complex and Multifactorial Nature of Alzheimer’s Disease Pathogenesis: a Clinical, Genomic, and Systems Biology Perspective. Molecular Neurobiology 2015 ;53(7): 4833–4864. 10.1007/S12035-015-9390-0. - PubMed
    1. Heneka M. T., O’Banion M. K., Terwel D., & Kummer M. P. Neuroinflammatory processes in Alzheimer’s disease. J Neural Trans 2010;117(8):117(8):919–947. 10.1007/S00702-010-0438-Z. - PubMed
    1. Regen F., Hellmann-Regen J., Costantini E., & Reale M. Neuroinflammation and Alzheimer’s Disease: Implications for Microglial Activation. Current Alzheimer Research. 2017;14(11). 10.2174/1567205014666170203141717. - PubMed