. 2023 Oct 13;22(1):170.
doi: 10.1186/s12943-023-01876-x.

Pan-cancer spatially resolved single-cell analysis reveals the crosstalk between cancer-associated fibroblasts and tumor microenvironment

Affiliations

Pan-cancer spatially resolved single-cell analysis reveals the crosstalk between cancer-associated fibroblasts and tumor microenvironment

Chenxi Ma et al. Mol Cancer. .

Abstract

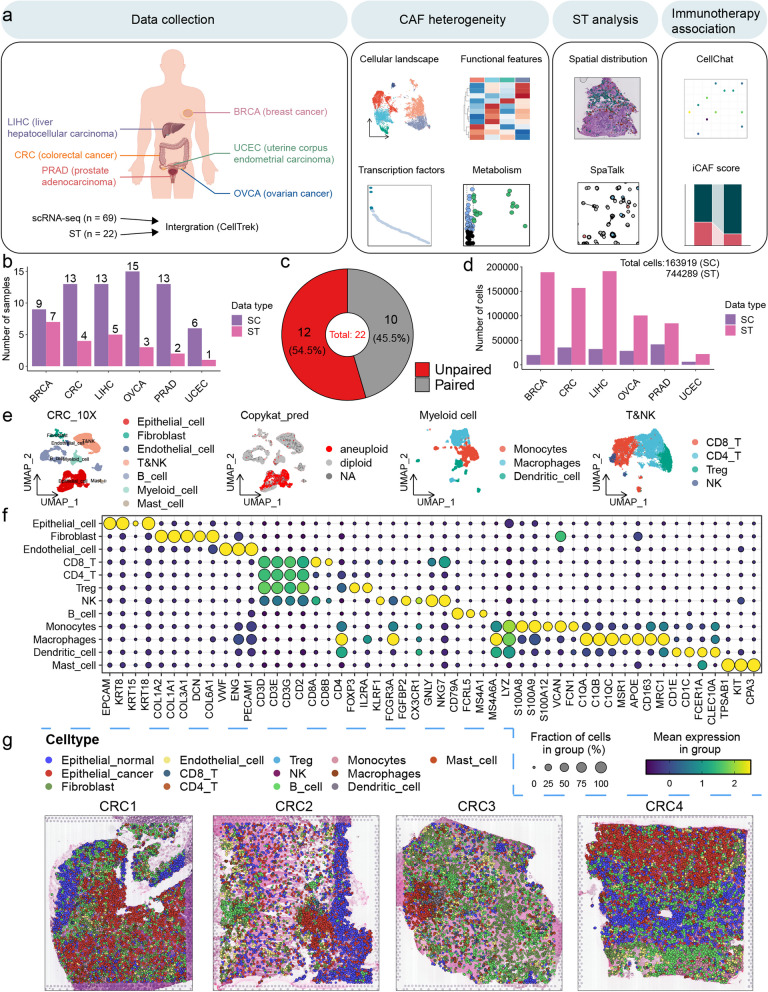
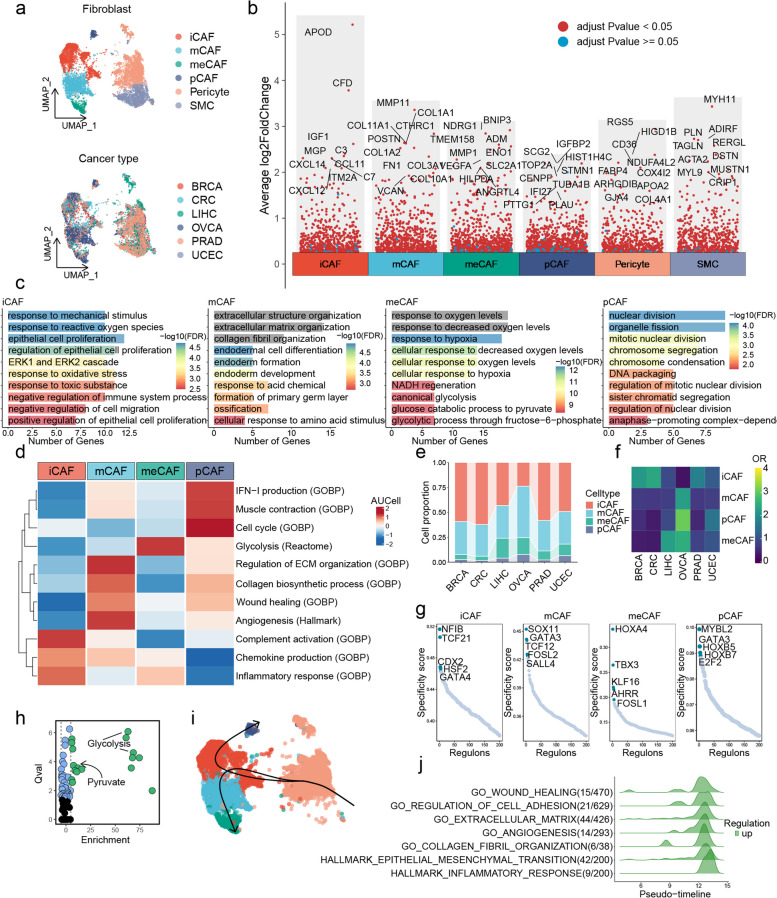
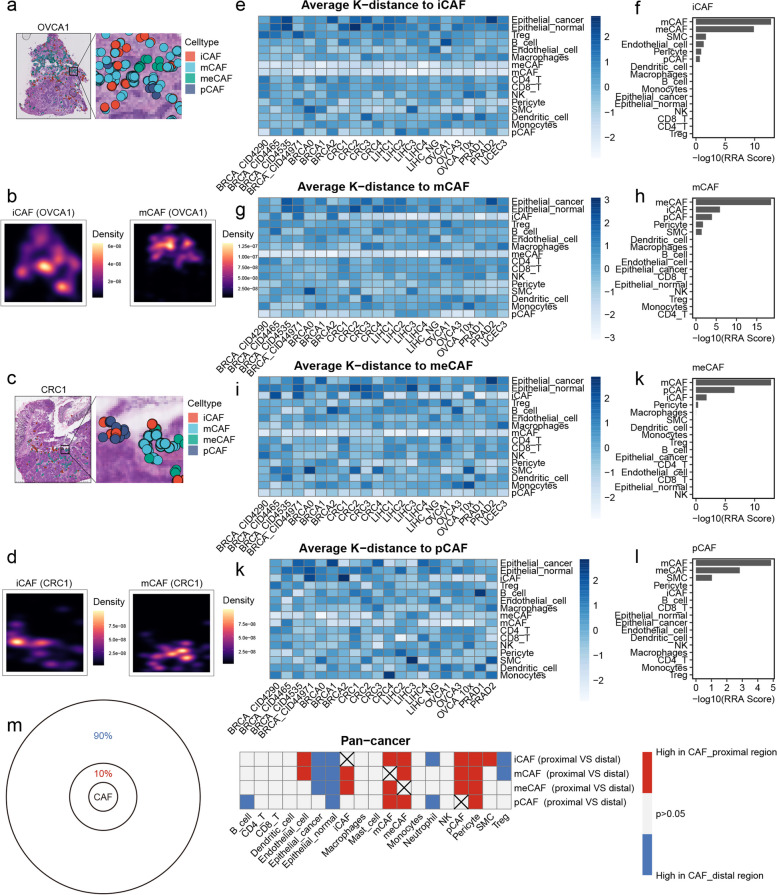
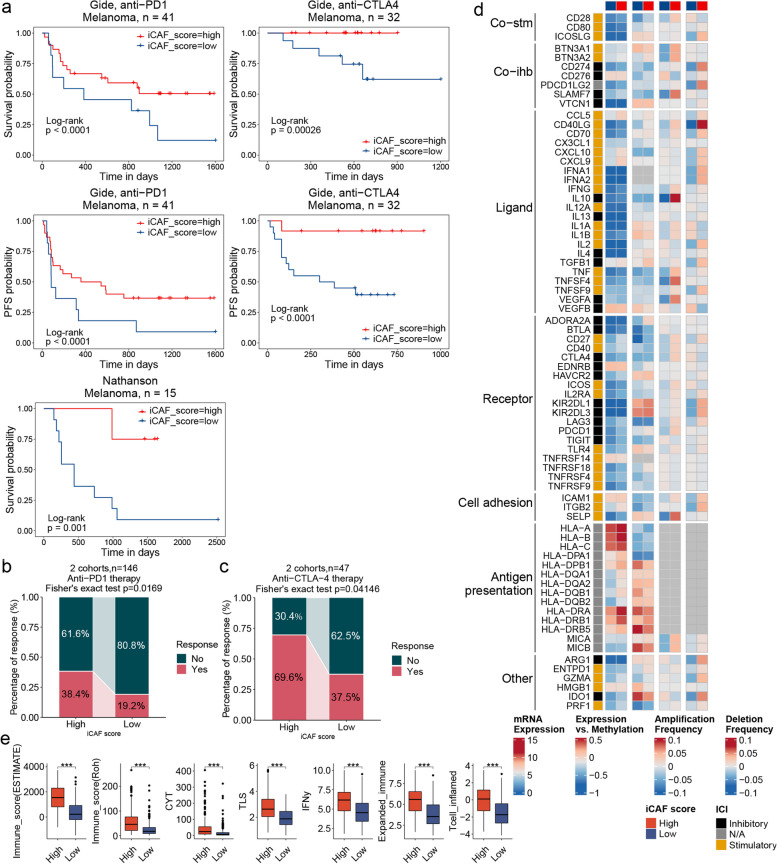
Cancer-associated fibroblasts (CAFs) are a heterogeneous cell population that plays a crucial role in remodeling the tumor microenvironment (TME). Here, through the integrated analysis of spatial and single-cell transcriptomics data across six common cancer types, we identified four distinct functional subgroups of CAFs and described their spatial distribution characteristics. Additionally, the analysis of single-cell RNA sequencing (scRNA-seq) data from three additional common cancer types and two newly generated scRNA-seq datasets of rare cancer types, namely epithelial-myoepithelial carcinoma (EMC) and mucoepidermoid carcinoma (MEC), expanded our understanding of CAF heterogeneity. Cell-cell interaction analysis conducted within the spatial context highlighted the pivotal roles of matrix CAFs (mCAFs) in tumor angiogenesis and inflammatory CAFs (iCAFs) in shaping the immunosuppressive microenvironment. In patients with breast cancer (BRCA) undergoing anti-PD-1 immunotherapy, iCAFs demonstrated heightened capacity in facilitating cancer cell proliferation, promoting epithelial-mesenchymal transition (EMT), and contributing to the establishment of an immunosuppressive microenvironment. Furthermore, a scoring system based on iCAFs showed a significant correlation with immune therapy response in melanoma patients. Lastly, we provided a web interface ( https://chenxisd.shinyapps.io/pancaf/ ) for the research community to investigate CAFs in the context of pan-cancer.

Keywords: Cancer-associated fibroblasts; Pan-cancer analysis; Single-cell RNA sequencing; Spatial transcriptomics; Tumor immunotherapy; Tumor microenvironment.


Conflict of interest statement

The authors declare no competing interests.

Figures

Fig. 1
Fig. 1
A pan-cancer spatial single-cell transcriptome atlas. a Schematic depicting the study design. The cancer types included in this pan-cancer study were displayed in the first image on the left, created by Figdraw. b The number of samples in the pan-cancer analysis of scRNA-seq and ST. c Pie chart showing the proportion of ST sections that have corresponding scRNA-seq data from the same patient compared to those without such corresponding scRNA-seq data. d The number of cells in the pan-cancer analysis of scRNA-seq and ST. e Uniform Manifold Approximation and Projection (UMAP) plots showing the major cell types in CRC. f Bubble heatmap showing the expression of marker genes for the major cell types in CRC. g Spatial cell charting of CRC using CellTrek
Fig. 2
Fig. 2
CAF heterogeneity in pan-cancer. a UMAP plots showing the integration of fibroblasts across six different cancer types by Harmony. b Differential expression analysis showing the upregulated genes for each fibroblast subtype. An adjusted p value < 0.05 is indicated in red, while an adjusted p value ≥ 0.05 is indicated in blue. c GO enrichment analysis of upregulated genes in each CAF subtype. d Heatmap showing pathway activities scored by AUCell in each CAF subtype. e Proportion of CAF subtypes across multiple cancer types. f Heatmap showing the ORs of CAF subtypes in each cancer type. g Scatter plot showing the RSSs in each CAF subtype. The top 5 regulons are highlighted. h SCAP analysis of metabolic pathways in meCAFs. i Slingshot trajectory analysis of CAFs. j GeneSwitches analysis of pathway activity changes in the transition pathway from pericytes to iCAFs
Fig. 3
Fig. 3
Spatial distribution characteristics of CAFs. a Spatial cell charting of CAFs in OVCA1 using CellTrek. b Density plots showing high-density regions of iCAFs and mCAFs in OVCA1. c Spatial cell charting of CAFs in CRC1 using CellTrek. d Density plots showing high-density regions of iCAFs and mCAFs in CRC1. e Heatmap showing the average k-distance from different cell types to iCAFs in each tissue tissue slice. The columns were scaled. f Integrated ranking of cell types based on proximity to iCAFs using RRA algorithm across 22 tissue slices. g Heatmap showing the average k-distance from different cell types to mCAFs in each tissue slice. The columns were scaled. h Integrated ranking of cell types based on proximity to mCAFs using RRA algorithm across 22 tissue slices. i Heatmap showing the average k-distance from different cell types to meCAFs in each tissue slice. The columns were scaled. j Integrated ranking of cell types based on proximity to meCAFs using RRA algorithm across 22 tissue slices. k Heatmap showing the average k-distance from different cell types to pCAFs in each tissue slice. The columns were scaled. l Integrated ranking of cell types based on proximity to pCAFs using RRA algorithm across 22 tissue slices. m Left: Circular plot showing the proportions of proximal and distal regions of CAFs. Right: heatmap showing the enrichment of various cell types in the proximal and distal regions for each CAF subpopulation. The paired t-test was used to compare the differences in cell proportions between the proximal and distal regions for each CAF subpopulation. Red color represents enrichment of a cell type in the proximal region of CAFs, while blue color represents enrichment of a cell type in the distal region of CAFs. Only p values < 0.05 are shown
Fig. 4
Fig. 4
Effect of CAFs on TME through paracrine signaling. a GO enrichmet of ligands from mCAFs to endothelial cells. b GO enrichmet of ligands from iCAFs to macrophages. c GO enrichmet of ligands from iCAFs to CD8 + T cells. d Integrated ranking of LRIs based on number of LRIs from mCAFs to endothelial cells using RRA algorithm across 22 tissue slices. e Integrated ranking of LRIs based on number of LRIs from iCAFs to macrophages using RRA algorithm across 22 tissue slices. f Integrated ranking of LRIs based on number of LRIs from iCAFs to CD8 + T cells using RRA algorithm across 22 tissue slices. g Spatial distribution of the LGALS1-PTPRC interaction on two spatial transcriptomics tissue slices (BRCA0 and LIHC1). h Representative immunofluorescence images of CFD (red) and CD8 (green) in tissues from three patients with BRCA and three patients with LIHC. Scale bar represents 20 μm
Fig. 5
Fig. 5
Anti-PD1 treatment influences the communication between iCAFs and TME. a UMAP plot showing the fibroblasts subpopulations in BRCA immunotherapy cohort. b Heatmap showing the expression of marker genes in fibroblast subpopulations. c UMAP plots showing the temporal alterations of fibroblasts subpopulations. d Boxplot showing the differences in cell proportions between patients with and without clonal expansion before anti-PD1 treatment. Statistical analysis was performed using unpaired t-tests; *P < 0.05, **P < 0.01, ***P < 0.001. e Boxplot showing the differences in cell proportions between patients with and without clonal expansion on anti-PD1 treatment. Statistical analysis was performed using unpaired t-tests; *P < 0.05, **P < 0.01, ***P < 0.001. f Differential cell–cell interaction signaling pathway alterations in iCAFs during anti-PD-1 treatment compared to pre-treatment. g Upregulated LRIs in iCAFs during anti-PD-1 treatment compared to pre-treatment. h Downregulated LRIs in iCAFs during anti-PD-1 treatment compared to pre-treatment
Fig. 6
Fig. 6
iCAF score correlate with immunotherapy response. a Kaplan–Meier plots showing the prognostic value of iCAF score in the melanoma immunotherapy cohorts. P-values were calculated by log-rank test. b Percentage of anti − PD1 therapy response among melanoma patients with high and low iCAF scores. Statistical analysis was performed using Fisher's exact test. c Percentage of anti − CTLA − 4 therapy response among melanoma patients with high and low iCAF scores. Statistical analysis was performed using Fisher's exact test. d Heatmap showing immune modulators in melanoma patients with high and low iCAF scores. From left to right: mRNA expression (median-normalized expression levels of immune modulators); expression versus methylation (Spearman correlation between expression of immune modulators and DNA methylation beta-values); amplification frequency (difference in the proportion of immune modulators amplifications between patients with high or low iCAF scores and the proportion of immune modulators amplifications in all patients.); and the deletion frequency (as amplifications). e Boxplot showing the comparison of immune related scores in melanoma patients with high and low iCAF scores. Statistical analysis was performed using Wilcoxon rank-sum tests; *P < 0.05, **P < 0.01, ***P < 0.001

References

    1. Li Y, Jin J, Bai F. Cancer biology deciphered by single-cell transcriptomic sequencing. Protein Cell. 2022;13:167–179. doi: 10.1007/s13238-021-00868-1. - DOI - PMC - PubMed
    1. Xu M, Zhang T, Xia R, Wei Y, Wei X. Targeting the tumor stroma for cancer therapy. Mol Cancer. 2022;21:208. doi: 10.1186/s12943-022-01670-1. - DOI - PMC - PubMed
    1. Chhabra Y, Weeraratna AT. Fibroblasts in cancer: Unity in heterogeneity. Cell. 2023;186:1580–1609. doi: 10.1016/j.cell.2023.03.016. - DOI - PMC - PubMed
    1. Pei L, et al. Roles of cancer-associated fibroblasts (CAFs) in anti- PD-1/PD-L1 immunotherapy for solid cancers. Mol Cancer. 2023;22:29. doi: 10.1186/s12943-023-01731-z. - DOI - PMC - PubMed
    1. Tsoumakidou M. The advent of immune stimulating CAFs in cancer. Nat Rev Cancer. 2023;23:258–269. doi: 10.1038/s41568-023-00549-7. - DOI - PubMed

Publication types

LinkOut - more resources