Valorization Strategies in CO2 Capture: A New Life for Exhausted Silica-Polyethylenimine
- PMID: 37833862
- PMCID: PMC10572583
- DOI: 10.3390/ijms241914415
Valorization Strategies in CO2 Capture: A New Life for Exhausted Silica-Polyethylenimine
Abstract
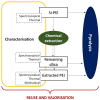
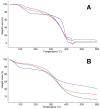
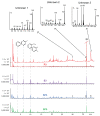
The search for alternative ways to give a second life to materials paved the way for detailed investigation into three silica-polyethylenimine (Si-PEI) materials for the purpose of CO2 adsorption in carbon capture and storage. A solvent extraction procedure was investigated to recover degraded PEIs and silica, and concomitantly, pyrolysis was evaluated to obtain valuable chemicals such as alkylated pyrazines. An array of thermal (TGA, Py-GC-MS), mechanical (rheology), and spectroscopical (ATR-FTIR, 1H-13C-NMR) methods were applied to PEIs extracted with methanol to determine the relevant physico-chemical features of these polymers when subjected to degradation after use in CO2 capture. Proxies of degradation associated with the plausible formation of urea/carbamate moieties were revealed by Py-GC-MS, NMR, and ATR-FTIR. The yield of alkylpyrazines estimated by Py-GC-MS highlighted the potential of exhausted PEIs as possibly valuable materials in other applications.
Keywords: carbon capture; pyrolysis; silica-PEI adsorbent; solvent extraction.
Conflict of interest statement
The authors declare no conflict of interest.
Figures


References
-
- Matthews H.D., Weaver A.J. Committed Climate Warming. Nat. Geosci. 2010;3:142–143. doi: 10.1038/ngeo813. - DOI
-
- Al-Ghussain L. Global Warming: Review on Driving Forces and Mitigation: Global Warming: Review on Driving Forces and Mitigation. Environ. Prog. Sustain. Energy. 2019;38:13–21. doi: 10.1002/ep.13041. - DOI
-
- Yoro K.O., Daramola M.O. Advances in Carbon Capture. Elsevier; Amsterdam, The Netherlands: 2020. CO2 Emission Sources, Greenhouse Gases, and the Global Warming Effect; pp. 3–28.
MeSH terms
Substances
LinkOut - more resources
Full Text Sources
Miscellaneous

