. 2023 Oct 3;24(19):14852.
doi: 10.3390/ijms241914852.

Aβ1-42 Accumulation Accompanies Changed Expression of Ly6/uPAR Proteins, Dysregulation of the Cholinergic System, and Degeneration of Astrocytes in the Cerebellum of Mouse Model of Early Alzheimer Disease

Affiliations

Aβ1-42 Accumulation Accompanies Changed Expression of Ly6/uPAR Proteins, Dysregulation of the Cholinergic System, and Degeneration of Astrocytes in the Cerebellum of Mouse Model of Early Alzheimer Disease

Maxim L Bychkov et al. Int J Mol Sci. .

Abstract

Alzheimer disease (AD) is a widespread neurodegenerative disease characterized by the accumulation of oligomeric toxic forms of β-amyloid (Aβ1-42) and dysfunction of the cholinergic system in the different brain regions. However, the exact mechanisms of AD pathogenesis and the role of the nicotinic acetylcholine receptors (nAChRs) in the disease progression remain unclear. Here, we revealed a decreased expression of a number of the Ly6/uPAR proteins targeting nAChRs in the cerebellum of 2xTg-AD mice (model of early AD) in comparison with non-transgenic mice both at mRNA and protein levels. We showed that co-localization of one of them, - neuromodulator Lynx1, with α7-nAChR was diminished in the vicinity of cerebellar astrocytes of 2xTg-AD mice, while Aβ1-42 co-localization with this receptor present was increased. Moreover, the expression of anti-inflammatory transcription factor KLF4 regulating transcription of the Ly6/uPAR genes was decreased in the cerebellum of 2xTg-AD mice, while expression of inflammatory cytokine TNF-α was increased. Based on these data together with observed astrocyte degeneration in the cerebellum of 2xTg-AD mice, we suggest the mechanism by which expression of the Ly6/uPAR proteins upon Aβ pathology results in dysregulation of the cholinergic system and particularly of α7-nAChR function in the cerebellum. This leads to enhanced neuroinflammation and cerebellar astrocyte degeneration.

Keywords: Alzheimer disease; Ly6/uPAR; Lynx1; Lypd6; PSCA; SLURP-1; astrocytes; motor memory; nicotinic acetylcholine receptor.


Conflict of interest statement

The authors declare no conflict of interest.

Figures

Figure 1
Figure 1
Analysis of changes in Lypd6, Lypd6b, SLURP-1, PSCA, Lynx1, and α7-nAChR expression in the cerebellum of Tg and 2Tg-AD mice. (ad, left panels) Analysis of Lypd6, Lypd6b, Slurp-1, and Psca mRNA expression level normalized to expression level of the β-actin, Gpdh, and Rpl13a housekeeping genes and presented as relative mRNA level ± SEM (n = 6). (ad, central panels) Representative Western blotting membranes for analysis of Lypd6, Lypd6b, SLURP-1, and PSCA expression in the cerebellum of three (1–3) Tg and three (1–3) 2xTg-AD mice. The positions of GPI-anchored and secreted PSCA are indicated as “GPI” and “S”, respectively. The whole Western blotting membranes are shown in Figure S1a–d. (ad, right panels) Quantification of protein expression level of Lypd6, Lypd6b, SLURP-1, and PSCA normalized to β-actin expression level, the data presented as normalized protein band intensity ± SEM (n = 6 for Tg and 5 for 2xTg-AD mice). (e) Analysis of Lynx1 and α7-nAChR expression. Gene expression level of Lynx1 and Chrna7 (left panel) was normalized to expression level of the β-actin, Gpdh, and Rpl13a housekeeping genes and presented as relative mRNA level ± SEM (n = 6). Representative Western blotting membrane for analysis of α7-nAChR and Lynx1 expression in the cerebellum of three (1–3) Tg and three (1–3) 2xTg-AD mice is shown at the right panel. The whole Western blotting membranes are shown in Figure S1e. (f) Analysis of expression of the Lynx1 and α7-nAChR proteins normalized to β-actin expression, the data presented as normalized protein band intensity ± SEM (n = 6 for Tg and 5 for 2xTg-AD mice). On the right panel, analysis of the α7-nAChR/Lynx1 ratio is presented (n = 6 for Tg and 5 for 2xTg-AD mice). * (p < 0.05), ** (p < 0.01), *** (p < 0.001), and **** (p < 0.0001) indicate significant difference between the data groups according to the two-sided t-test. # (p < 0.05) and ## (p < 0.01) indicate significant difference between the data groups according to the Mann–Whitney u-test.
Figure 2
Figure 2
Analysis of Lynx1 and α7-nAChR expression and their co-localization in the cerebellum of Tg (n = 5) and 2Tg-AD (n = 8) mice. (a) Examples of the Lynx1 and α7-nAChR clusters reconstructed using the Imaris software. The contacting Lynx1 and α7-nAChR clusters are indicated by the arrows, scale—10 µm. (b,c) Analysis of the quantity and intensity (left and right panels, respectively) of the Lynx1 and α7-nAChR clusters. The data are presented as the number of the clusters ± SEM or as the cluster staining intensity normalized to the intensity of background of image ± SEM. (d) % of the Lynx1 clusters co-localized with the α7-nAChR clusters. (e) Examples of the maximum intensity of z-stack projections in the slices of the cerebellum, the contacts between the Lynx1 (magenta) and α7-nAChR (green) clusters are indicated by the arrows, scale—10 µm. (f) Analysis of the Lynx1 and α7-nAChR clusters’ co-localization by the Pearson’s regression, the data presented as the correlation coefficient ± SEM. * (p < 0.05), ** (p < 0.01), and **** (p < 0.0001) indicate significant difference between the data groups according to the two-sided t-test.
Figure 3
Figure 3
Analysis of the α7-nAChR partners extracted from the homogenate of cerebellum of Tg (a,d) and 2xTg-AD (b,e) mice by affinity extraction using NHS-Sepharose resin coupled with α-Bgtx (n = 3). The empty resin blocked by 500 mM ethanolamine +5% skim milk was used as a negative control. Analysis was performed by Western blotting. Whole Western blotting membranes are shown in Figure S3 for Tg mice and in Figure S4 for 2xTg-AD mice. For α7-nAChR, two bands were observed, corresponding to the whole and hydrolyzed subunits (shown by the arrows). The total intensity of the two bands was used for the quantification. (c) Analysis of the ratio of the intensities of the bands from (a,b) corresponding to the Lynx1 and α7-nAChR proteins extracted by α-Bgtx. Data presented as the Lynx1/α7-nAChR band intensity ratio + SEM (n = 3); * (p < 0.05) indicates significant difference between the data groups according to the two-sided t-test.
Figure 4
Figure 4
Analysis of α7-nAChR and Aβ1-42 expression and co-localization in the cerebellum of Tg and 2Tg-AD mice. (a) Example of analysis of Aβ1-42 expression in the cerebellum of three Tg and three 2xTg-AD mice by Western blotting. The whole Western blotting membranes are shown in Figure S5. (b) Analysis of expression level of Aβ1-42 normalized to expression level of β-actin; the data are presented as normalized protein band intensity ± SEM (n = 6 for Tg and 5 for 2xTg-AD mice). (c) Examples of the Aβ1-42 and α7-nAChR clusters reconstructed using the Imaris software, some contacting Aβ1-42 and α7-nAChR clusters are indicated by arrows, scale—10 µm. (d,e) Analysis of the quantity and intensity of the Aβ1-42 and α7-nAChR clusters. The data are presented as the number of the clusters ± SEM or as the cluster staining intensity normalized to the intensity of background of image ± SEM (n = 5 for Tg and 8 for 2xTg-AD mice). (f) % of the Aβ1-42 clusters co-localized with the α7-nAChR clusters in the cerebellum of Tg and 2xTg-AD mice (n = 5 for Tg and 8 for 2xTg-AD mice). (g) Examples of the maximum intensity of z-stack projections in the slices of the cerebellum of Tg and 2xTg-AD mice; the contacts between the Aβ1-42 (magenta) and α7-nAChR (green) clusters are indicated by the arrows, scale—10 µm. (h) Analysis of the Aβ1-42 and α7-nAChR clusters co-localization by the Pearson’s regression; the data are presented as the correlation coefficient ± SEM (n = 5 for Tg and 8 for 2xTg-AD mice). * (p < 0.05), ** (p < 0.01), and **** (p < 0.0001) indicate significant difference between the data groups according to the two-sided t-test ## (p < 0.01) and ### (p < 0.001) indicates a significant difference between the data groups according to the Mann-Whitney u-test.
Figure 5
Figure 5
Analysis of KLF4 and TNF-α expression in the cerebellum of Tg- and 2xTg-AD mice. (a) Analysis of Klf4 gene expression (left) and KLF4 expression at the protein level (right) in the cerebellum of Tg and 2xTg-AD mice. Gene expression was normalized to expression of β-actin, Gpdh, and Rpl13a housekeeping genes and presented as a relative mRNA level ± SEM (n = 6). Analysis of KLF4 protein expression was performed by Western blotting, and its quantification (n = 5–6) is shown on the right panel. The whole Western blotting membranes are shown in Figure S6. (b) Tnfa mRNA expression level was normalized to the expression levels of β-actin, Gpdh, and Rpl13a housekeeping genes and presented as the log of the relative mRNA level ± SEM (n = 6). *** (p < 0.001) and **** (p < 0.0001) indicate significant difference between the data groups according to the two-sided t-test.
Figure 6
Figure 6
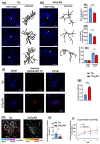
Analysis of astrocyte morphology, main progenitors’ area, and astrocyte branching in Tg and 2xTG-AD mice. (a,b) Representative images of astrocytes in the cerebellum of non-transgenic and transgenic mice, initial images, and reconstructed astrocyte morphology by the “filament tracer” of the Imaris software are shown at the left and right panels, respectively. Arrows show the positions of individual cells, scale—10 µm. (c) Average length of the main progenitors of individual astrocytes stained by GFAP was assayed using the Imaris software. (d) Area occupied by the astrocyte was calculated by the ImageJ 1.5 software. Please note that this area is not the actual volume of the astrocytic domain and indicates only the spread of the main progenitors of the astrocyte, which can be stained by a GFAP antibody. (e) Astrocytic progenitors of the first and second order were counted manually using the reconstructed main astrocytic progenitors. All data presented as mean ± SEM (n = 5 for Tg and 8 for 2Tg-AD mice); (f) Examples of the maximum intensity of z-stack projections in the slices of the cerebellum of Tg and 2xTg-AD mice, stained for cleaved cytokeratin 18 (magenta) and GFAP (blue), scale—10 µm; (g) Analysis of co-localization of the astrocyte stained by Ab to GFAP and cleaved cytokeratin 18; (h) Example of the Lynx1 and α7-nAChR clusters’ distribution within the astrocytic area. Arrows indicate the contacting Lynx1 and α7-nAChR clusters (i) Analysis of co-localization of the Lynx1 and α7-nAChR clusters within the astrocyte (n = 5 for Tg and 8 for 2xTg-AD mice). * (p < 0.05), ** (p < 0.01), *** (p < 0.001), **** (p < 0.0001) indicate a significant difference between the data groups according to the two-sided t-test. (j). Motor learning test in Tg (n = 13) and 2xTg-AD (n = 9) mice. The performance dynamics in the rotarod test over the 4 consecutive days is expressed as percentage of baseline (1-day) values.
Figure 7
Figure 7
Suggested model of the cholinergic dysregulation in the cerebellum of 2Tg-AD mice. Aβ1-42 burden leads to down-regulation of expression of anti-inflammatory transcription factor KLF4, regulating expression of the Ly6/uPAR proteins, which in turn modulate α7-nAChR function. This drives interaction of Aβ1-42 with α7-nAChR, which results in dysregulation of this receptor, promotes neuroinflammation with increased expression of inflammatory cytokine TNF-α, and leads to degeneration of astrocytes and further neurodegeneration and cognitive function impairment.

References

    1. Global Action Plan on the Public Health Response to Dementia 2017–2025. [(accessed on 1 November 2022)]. Available online: https://www.who.int/publications-detail-redirect/9789241513487.
    1. Liang C.-S., Li D.-J., Yang F.-C., Tseng P.-T., Carvalho A.F., Stubbs B., Thompson T., Mueller C., Shin J.I., Radua J., et al. Mortality Rates in Alzheimer’s Disease and Non-Alzheimer’s Dementias: A Systematic Review and Meta-Analysis. Lancet Healthy Longev. 2021;2:e479–e488. doi: 10.1016/S2666-7568(21)00140-9. - DOI - PubMed
    1. Hampel H., Hardy J., Blennow K., Chen C., Perry G., Kim S.H., Villemagne V.L., Aisen P., Vendruscolo M., Iwatsubo T., et al. The Amyloid-β Pathway in Alzheimer’s Disease. Mol. Psychiatry. 2021;26:5481–5503. doi: 10.1038/s41380-021-01249-0. - DOI - PMC - PubMed
    1. Muralidar S., Ambi S.V., Sekaran S., Thirumalai D., Palaniappan B. Role of Tau Protein in Alzheimer’s Disease: The Prime Pathological Player. Int. J. Biol. Macromol. 2020;163:1599–1617. doi: 10.1016/j.ijbiomac.2020.07.327. - DOI - PubMed
    1. Lasala M., Fabiani C., Corradi J., Antollini S., Bouzat C. Molecular Modulation of Human A7 Nicotinic Receptor by Amyloid-β Peptides. Front. Cell. Neurosci. 2019;13:37. doi: 10.3389/fncel.2019.00037. - DOI - PMC - PubMed

MeSH terms

Substances