. 2023 Oct 6;24(19):14953.
doi: 10.3390/ijms241914953.

Diaphragm Fatigue in SMNΔ7 Mice and Its Molecular Determinants: An Underestimated Issue

Affiliations

Diaphragm Fatigue in SMNΔ7 Mice and Its Molecular Determinants: An Underestimated Issue

Francesca Cadile et al. Int J Mol Sci. .

Abstract

Spinal muscular atrophy (SMA) is a genetic disorder characterized by the loss of spinal motor neurons leading to muscle weakness and respiratory failure. Mitochondrial dysfunctions are found in the skeletal muscle of patients with SMA. For obvious ethical reasons, the diaphragm muscle is poorly studied, notwithstanding the very important role that respiratory involvement plays in SMA mortality. The main goal of this study was to investigate diaphragm functionality and the underlying molecular adaptations in SMNΔ7 mice, a mouse model that exhibits symptoms similar to that of patients with intermediate type II SMA. Functional, biochemical, and molecular analyses on isolated diaphragm were performed. The obtained results suggest the presence of an intrinsic energetic imbalance associated with mitochondrial dysfunction and a significant accumulation of reactive oxygen species (ROS). In turn, ROS accumulation can affect muscle fatigue, cause diaphragm wasting, and, in the long run, respiratory failure in SMNΔ7 mice. Exposure to the antioxidant molecule ergothioneine leads to the functional recovery of the diaphragm, confirming the presence of mitochondrial impairment and redox imbalance. These findings suggest the possibility of carrying out a dietary supplementation in SMNΔ7 mice to preserve their diaphragm function and increase their lifespan.

Keywords: SMA; diaphragm muscle; ergothioneine; muscle fatigue.


Conflict of interest statement

The authors declare no conflict of interest.

Figures

Figure 1
Figure 1
Alterations of contractile functions in SMA diaphragm. (a) Mean values of twitch time to peak (TTP), twitch half relaxation time (TTR), twitch specific tension (Po/CSA), and specific tetanic tension determined in ex vivo functional analysis in the diaphragm muscles (WT, n = 21; SMA, n = 17). (b) Fatigue index (percentage of the maximal tetanic force) (WT, n = 12; SMA, n = 12). (c) Gene (by RT-PCR) expression (WT, n = 5; SMA, n = 3) and protein (by Western blot) expression (WT, n = 8; SMA, n = 7) of sarcoplasmic reticulum Ca2+ ATPase pumps (SERCA1 and 2). The level of protein target was normalized against the level of the housekeeping tubulin measured in the same blot. Representative Western blots are shown. Bars represent means± SD. Individual data are represented as scatter plots. * p ≤ 0.05 ** p ≤ 0.01 *** p ≤ 0.001**** p ≤ 0.0005.
Figure 2
Figure 2
Energy imbalance in SMA diaphragm. (a) Mean values of the ratio between the content in the phosphorylated (p) and total forms for AMPK determined by Western blots (WT, n = 6; SMA, n = 5). (b) Gene expression of PGC1α, Sirtuin1 (SIR1) and NRF1 by RT-PCR (WT, n = 5; SMA, n = 3). (c) Protein expression of PGC1α (WT, n = 4; SMA, n = 5) and mitochondrial import receptor subunit TOM-20 (WT, n = 7; SMA, n = 7) determined by Western blots. The level of protein target was normalized against the level of the housekeeping tubulin measured in the same blot. Representative Western blots are shown. Bars represent means ± SD. Individual data are represented as scatter plots. * p ≤ 0.05 ** p ≤ 0.01.
Figure 3
Figure 3
Up-regulation of OXPHOS complexes in SMA diaphragm. Experiments were performed on controls (WT, n = 4) and SMA phenotype (SMA, n = 4) diaphragms. Mean values of the components of the mitochondrial respiratory chain determined by Western blots. The level of protein target was normalized against the level of the same blot. stained with Comassie. Representative Western blots are shown. Bars represent means ± SD. Individual data are represented as scatter plots. * p ≤ 0.05.
Figure 4
Figure 4
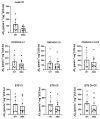
Mitochondrial respiration indices (LEAK—Resting non-phosphorylating electron transfer, OXPHOS—Oxidative phosphorylation, ETS—electron transfer system) are not changed in the complexes evaluated (Complex I—CI and Complex II—CII, both complexes—CI + CII) in SMA diaphragm. Experiments were performed on controls (WT, n = 8) and SMA phenotype (SMA, n = 8) diaphragms. Mean values of the mitochondrial respiration indices. Bars represent means ± SD. Individual data are represented as scatter plots.
Figure 5
Figure 5
Alteration of markers of mitochondrial dynamics in SMA diaphragm. (a) Protein levels of OPA1, MNF1, MNF2 and FIS1 determined by Western blots (WT, n = 6; SMA, n = 6). (b) Phosphorylation of serine 616 and serine 637 of DPR1 (WT, n = 7; SMA, n = 7). The level of protein target was normalized against the level of the housekeeping tubulin measured in the same blot. Representative Western blots are shown. Bars represent means ± SD. Individual data are represented as scatter plots. ** p ≤ 0.01.
Figure 6
Figure 6
Alteration in autophagy and mitophagy processes in SMA diaphragm. (a) The ratio between the active form and the inactive form of LC3B (LC3BII/LC3BI) (WT, n = 7; SMA, n = 7) and protein levels of p62 (WT, n = 5; SMA, n = 6), determined by Western blots. (b) Gene expression of BNIP3 by RT-PCR (WT, n= 8; SMA, n= 7). (c) Protein levels of mitophagy makers PINK1 and PARKIN (WT, n = 6; SMA, n = 6), determined by Western blots. The level of protein target was normalized against the level of the housekeeping tubulin measured in the same blot. Representative Western blots are shown. Bars represent means ± SD. Individual data are represented as scatter plots. * p ≤ 0.05 ** p ≤ 0.01.
Figure 7
Figure 7
Presence of redox imbalance and ROS accumulation in SMA diaphragm. (a) Protein levels of carbonylated proteins revealed by Oxyblot analysis (WT, n= 3; SMA, n= 3). (b) Gene expression of NRF2 by RT-PCR (WT, n = 8; SMA n = 7). (c) Protein levels of SOD1 (WT, n = 6; SMA, n = 6), Catalase (WT, n = 5; SMA, n = 7), HSP27 (WT, n = 6; SMA, n= 4), HSP70 (WT, n = 4; SMA, n = 2) and Piroxiredoxin 3 (PRDX3) (WT, n= 5; SMA, n= 3), determined by Western blots. The level of protein target was normalized against the level of the housekeeping tubulin measured in the same blot. Representative Western blots are shown. Bars represent means ± SD. Individual data are represented as scatter plots. * p ≤ 0.05.
Figure 8
Figure 8
Recovery of contractile functions in SMA diaphragm following ergothioneine exposure. Experiments were performed on diaphragms of controls (WT), SMA phenotype (SMA), controls treated with ergothioneine (WT + ERGO), and SMA phenotype treated with ergothioneine (SMA + ERGO). (a) Mean values of twitch time to peak (TTP), twitch half relaxation time (TTR), twitch specific tension (Po/CSA) and specific tetanic tension (WT, n = 21; SMA, n = 17; WT + ERGO, n = 5 and SMA + ERGO, n = 7). (b) Fatigue index (percentage of the maximal tetanic force) (WT, n = 12; SMA, n = 12, WT + ERGO, n = 3 and SMA + ERGO, n = 8). Bars represent means ± SD. Individual data are represented as scatter plots. * p ≤ 0.05 ** p ≤ 0.01 *** p ≤ 0.001 **** p ≤ 0.0005 SMA vs. WT; # p ≤ 0.05 ### p ≤ 0.001 SMA vs. SMA+ERGO.

References

    1. Schroth M.K. Special considerations in the respiratory management of spinal muscular atrophy. Pediatrics. 2009;123((Suppl. 4)):S245–S249. doi: 10.1542/peds.2008-2952K. - DOI - PubMed
    1. Prior T.W. Spinal muscular atrophy: A time for screening. Curr. Opin. Pediatr. 2010;22:696–702. doi: 10.1097/MOP.0b013e32833f3046. - DOI - PubMed
    1. Lefebvre S., Bürglen L., Reboullet S., Clermont O., Burlet P., Viollet L., Benichou B., Cruaud C., Millasseau P., Zeviani M. Identification and characterization of a spinal muscular atrophy-determining gene. Cell. 1995;80:155–165. doi: 10.1016/0092-8674(95)90460-3. - DOI - PubMed
    1. Lorson C.L., Hahnen E., Androphy E.J., Wirth B. A single nucleotide in the SMN gene regulates splicing and is responsible for spinal muscular atrophy. Proc. Natl. Acad. Sci. USA. 1999;96:6307–6311. doi: 10.1073/pnas.96.11.6307. - DOI - PMC - PubMed
    1. Yeo C.J.J., Darras B.T. Overturning the Paradigm of Spinal Muscular Atrophy as Just a Motor Neuron Disease. Pediatr. Neurol. 2020;109:12–19. doi: 10.1016/j.pediatrneurol.2020.01.003. - DOI - PubMed

Substances

LinkOut - more resources