. 2023 Oct 9;24(19):15032.
doi: 10.3390/ijms241915032.

Multi-Omics Profiling of Human Endothelial Cells from the Coronary Artery and Internal Thoracic Artery Reveals Molecular but Not Functional Heterogeneity

Affiliations

Multi-Omics Profiling of Human Endothelial Cells from the Coronary Artery and Internal Thoracic Artery Reveals Molecular but Not Functional Heterogeneity

Alexey Frolov et al. Int J Mol Sci. .

Abstract

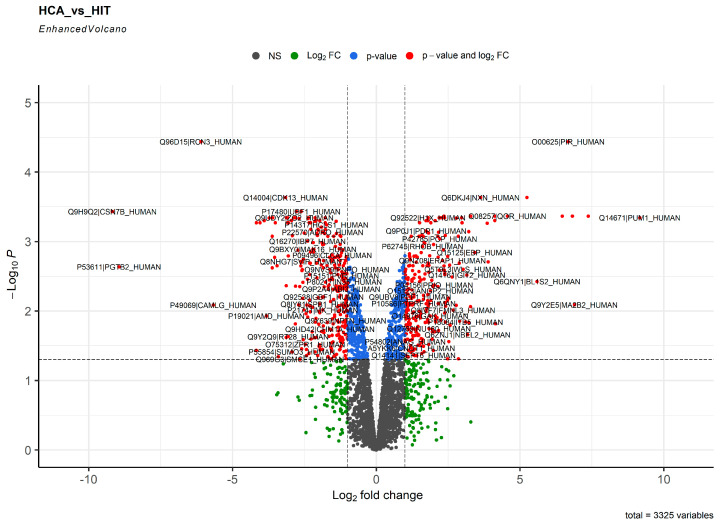
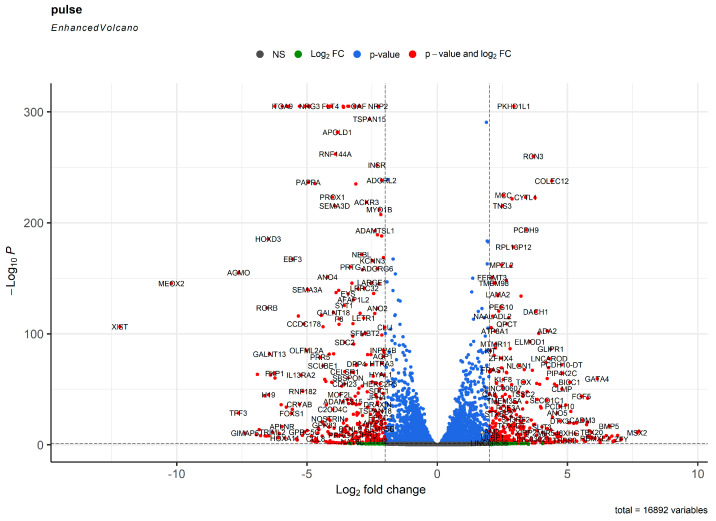
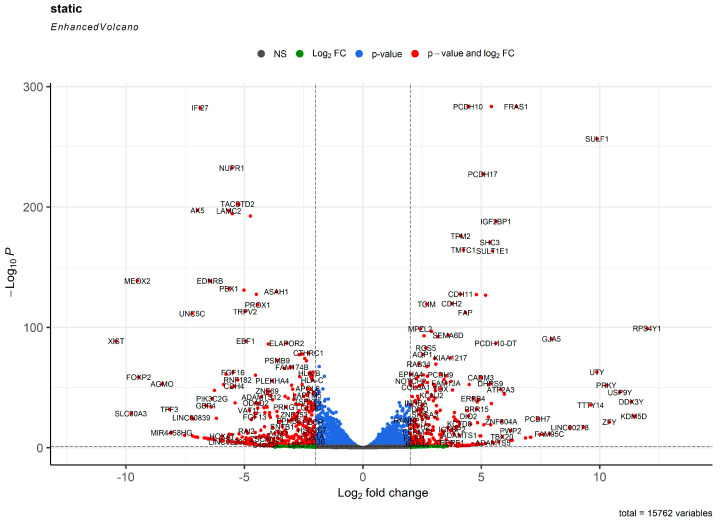
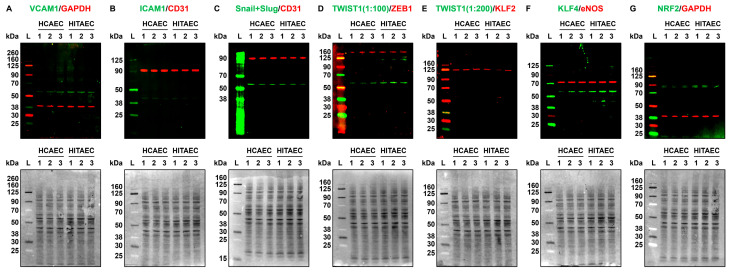
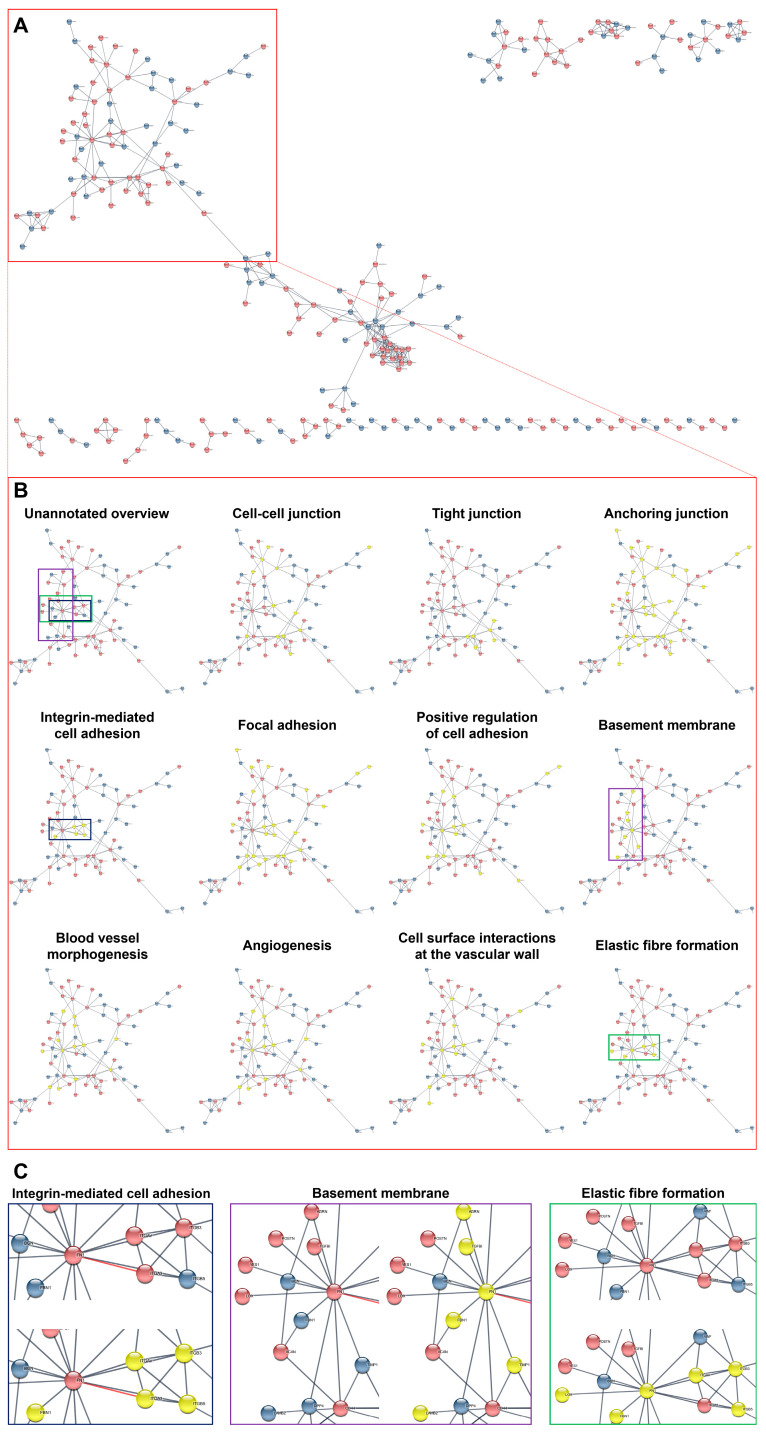
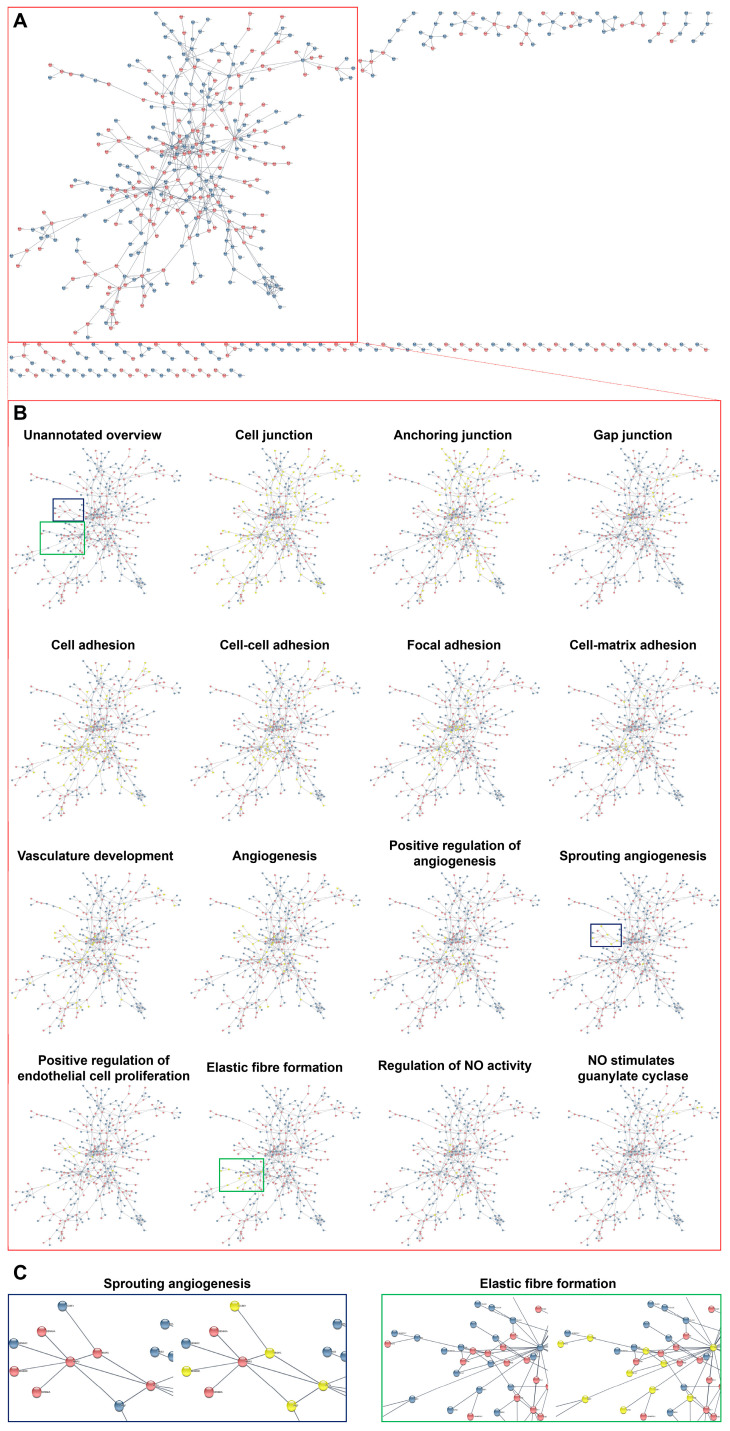
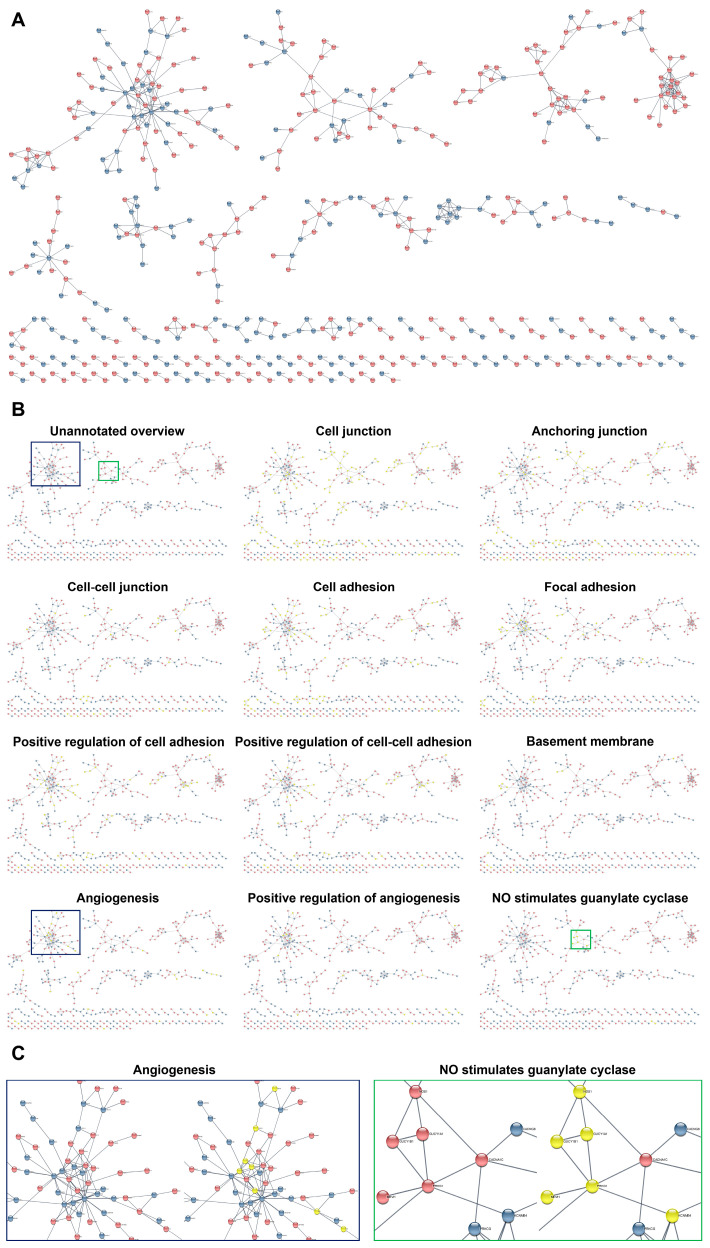
Major adverse cardiovascular events occurring upon coronary artery bypass graft surgery are typically accompanied by endothelial dysfunction. Total arterial revascularisation, which employs both left and right internal thoracic arteries instead of the saphenous vein to create a bypass, is associated with better mid- and long-term outcomes. We suggested that molecular profiles of human coronary artery endothelial cells (HCAECs) and human internal mammary artery endothelial cells (HITAECs) are coherent in terms of transcriptomic and proteomic signatures, which were then investigated by RNA sequencing and ultra-high performance liquid chromatography-mass spectrometry, respectively. Both HCAECs and HITAECs overexpressed molecules responsible for the synthesis of extracellular matrix (ECM) components, basement membrane assembly, cell-ECM adhesion, organisation of intercellular junctions, and secretion of extracellular vesicles. HCAECs were characterised by higher enrichment with molecular signatures of basement membrane construction, collagen biosynthesis and folding, and formation of intercellular junctions, whilst HITAECs were notable for augmented pro-inflammatory signaling, intensive synthesis of proteins and nitrogen compounds, and enhanced ribosome biogenesis. Despite HCAECs and HITAECs showing a certain degree of molecular heterogeneity, no specific markers at the protein level have been identified. Coherence of differentially expressed molecular categories in HCAECs and HITAECs suggests synergistic interactions between these ECs in a bypass surgery scenario.

Keywords: RNA sequencing; coronary artery; coronary artery bypass graft surgery; endothelial cells; endothelial heterogeneity; global gene expression; internal thoracic artery; multi-omics; proteomic profiling; transcriptome.


Conflict of interest statement

The authors declare no conflict of interest. The funders had no role in the design of the study; in the collection, analyses, or interpretation of data; in the writing of the manuscript; or in the decision to publish the results.

Figures

Figure 1
Figure 1
Volcano plot showing the distribution of proteins in the proteome of human coronary artery endothelial cells (HCAECs) and human internal thoracic artery endothelial cells (HITAECs). Gray points depict the proteins with log2 fold change < 1 and FDR-corrected p value > 0.05. Green points depict the proteins with log2 fold change > 1 and FDR-corrected p value > 0.05. Blue points depict the proteins with log2 fold change < 1 and FDR-corrected p value < 0.05. Red points depict the proteins with log2 fold change > 1 and FDR-corrected p value < 0.05 (DEPs).
Figure 2
Figure 2
Volcano plot showing the distribution of transcripts in the transcriptome of human coronary artery endothelial cells (HCAECs) and human internal thoracic artery endothelial cells (HITAECs) under laminar flow. Gray points depict the genes with log2 fold change < 1 and FDR-corrected p value > 0.05. Green points depict the genes with log2 fold change > 1 and FDR-corrected p value > 0.05. Blue points depict the genes with log2 fold change < 1 and FDR-corrected p value < 0.05. Red points depict the genes with log2 fold change > 1 and FDR-corrected p value < 0.05 (DEGs).
Figure 3
Figure 3
Volcano plot showing the distribution of transcripts in the transcriptome of human coronary artery endothelial cells (HCAECs) and human internal thoracic artery endothelial cells (HITAECs) at static cell culture conditions. Gray points depict the genes with log2 fold change < 1 and FDR-corrected p value > 0.05. Green points depict the genes with log2 fold change > 1 and FDR-corrected p value > 0.05. Blue points depict the genes with log2 fold change < 1 and FDR-corrected p value < 0.05. Red points depict the genes with log2 fold change > 1 and FDR-corrected p value < 0.05 (DEGs).
Figure 4
Figure 4
Fluorescent Western blotting for cell adhesion molecules (VCAM1 and ICAM1), transcription factors of endothelial-to-mesenchymal transition (Snail and Slug, TWIST1, and ZEB1), mechanosensitive transcription factors (KLF2, KLF4, and NRF2), endothelial nitric oxide synthase eNOS, and loading control (GAPDH and CD31) in human coronary artery endothelial cells (HCAECs) and human internal thoracic artery endothelial cells (HITAECs) cultured at static conditions. (A) VCAM1 (pro-inflammatory cell adhesion molecule, green)/GAPDH (loading control, red), fluorescent Western blot (top), and total protein staining confirming an equal protein loading (bottom); (B) ICAM1 (pro-inflammatory cell adhesion molecule, green)/CD31 (loading control, red), fluorescent Western blot (top), and total protein staining confirming an equal protein loading (bottom); (C) Snail and Slug (endothelial-to-mesenchymal transition transcription factor, green)/CD31 (loading control, red), fluorescent Western blot (top), and total protein staining confirming an equal protein loading (bottom); (D) TWIST1 (endothelial-to-mesenchymal transition transcription factor, green)/ZEB1 (another endothelial-to-mesenchymal transition transcription factor, red), fluorescent Western blot (top), and total protein staining confirming an equal protein loading (bottom); (E) TWIST1 (endothelial-to-mesenchymal transition transcription factor, green)/KLF2 (atheroprotective mechanosensitive transcription factor, red), fluorescent Western blot (top), and total protein staining confirming an equal protein loading (bottom); (F) KLF4 (atheroprotective mechanosensitive transcription factor, green)/eNOS (endothelial nitric oxide synthase, red), fluorescent Western blot (top), and total protein staining confirming an equal protein loading (bottom); (G) NRF2 (atheroprotective mechanosensitive transcription factor, green)/GAPDH (loading control, red), fluorescent Western blot (top), and total protein staining confirming an equal protein loading (bottom). Each band within the groups represent a protein lysate from one experiment (n = 3 experiments in total). Total protein normalisation was conducted by Fast Green FCF staining of the membranes after the fluorescent imaging to ensure the equal protein loading at all blots (in addition to loading controls such as GAPDH or CD31). Fluorescent ladder (L) and molecular weight signatures (kDa) are provided to the left of the HCAECs and HITAECs protein bands. Ratios of 1:100 and 1:200 are dilutions of the antibody against TWIST1, highlighted to show low expression of this protein in the quiescent ECs.
Figure 5
Figure 5
Bioinformatic analysis of protein–protein interactions between primary human coronary endothelial cells (HCAECs) and human internal thoracic artery endothelial cells (HITAECs). (A) Overview of protein–protein interactions between HCAECs (blue colour) and HITAECs (red colour); (B) annotation of the interacting proteins related to the specific molecular terms (yellow colour) in comparison with unannotated overview (the main cluster of interacting proteins is demarcated by red contour); and (C) annotations of clustered interacting proteins in selected molecular terms: integrin-mediated cell adhesion (demarcated by blue contour), basement membrane (demarcated by violet contour), and elastic fiber formation (demarcated by green contour).
Figure 6
Figure 6
Bioinformatic analysis of gene–gene interactions between primary human coronary endothelial cells (HCAECs) and human internal thoracic artery endothelial cells (HITAECs) cultured under laminar flow. (A) Overview of gene–gene interactions between HCAECs (blue colour) and HITAECs (red colour) cultured under laminar flow; (B) annotation of the interacting genes related to the specific molecular terms (yellow colour) in comparison with unannotated overview (the main cluster of interacting genes is demarcated by red contour); and (C) annotations of clustered interacting genes in selected molecular terms: sprouting angiogenesis (demarcated by blue contour) and elastic fiber formation (demarcated by green contour).
Figure 7
Figure 7
Bioinformatic analysis of gene–gene interactions between primary human coronary endothelial cells (HCAECs) and human internal thoracic artery endothelial cells (HITAECs) cultured at static conditions. (A) Overview of gene–gene interactions between HCAECs (blue colour) and HITAECs (red colour) cultured under laminar flow; (B) annotation of the interacting genes related to the specific molecular terms (yellow colour) in comparison with unannotated overview; and (C) annotations of clustered interacting genes in selected molecular terms: angiogenesis (demarcated by blue contour) and stimulation of guanylate cyclase by nitric oxide (demarcated by green contour).

Similar articles

Cited by

References

    1. Rafii S., Butler J.M., Ding B.S. Angiocrine Functions of Organ-Specific Endothelial Cells. Nature. 2016;529:316–325. doi: 10.1038/nature17040. - DOI - PMC - PubMed
    1. Pasquier J., Ghiabi P., Chouchane L., Razzouk K., Rafii S., Rafii A. Angiocrine Endothelium: From Physiology to Cancer. J. Transl. Med. 2020;18:52. doi: 10.1186/s12967-020-02244-9. - DOI - PMC - PubMed
    1. Gomez-Salinero J.M., Itkin T., Rafii S. Developmental Angiocrine Diversification of Endothelial Cells for Organotypic Regeneration. Dev. Cell. 2021;56:3042–3051. doi: 10.1016/j.devcel.2021.10.020. - DOI - PubMed
    1. Kutikhin A.G., Shishkova D.K., Velikanova E.A., Sinitsky M.Y., Sinitskaya A.V., Markova V.E. Endothelial Dysfunction in the Context of Blood-Brain Barrier Modeling. J. Evol. Biochem. Physiol. 2022;58:781–806. doi: 10.1134/S0022093022030139. - DOI - PMC - PubMed
    1. Bishop D., Schwarz Q., Wiszniak S. Endothelial-Derived Angiocrine Factors as Instructors of Embryonic Development. Front. Cell Dev. Biol. 2023;11:1172114. doi: 10.3389/fcell.2023.1172114. - DOI - PMC - PubMed

LinkOut - more resources