. 2023 Sep 25;20(19):6823.
doi: 10.3390/ijerph20196823.

Real-Time Measurements of Indoor-Outdoor Exchange of Gaseous and Particulate Atmospheric Pollutants in an Urban Area

Affiliations

Real-Time Measurements of Indoor-Outdoor Exchange of Gaseous and Particulate Atmospheric Pollutants in an Urban Area

Elisabeth Alonso-Blanco et al. Int J Environ Res Public Health. .

Abstract

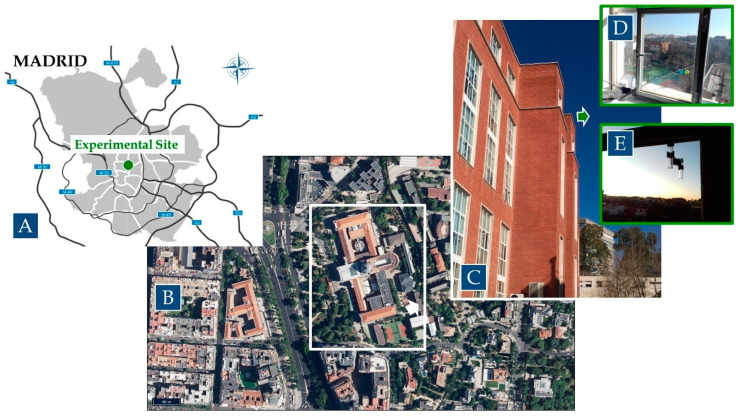
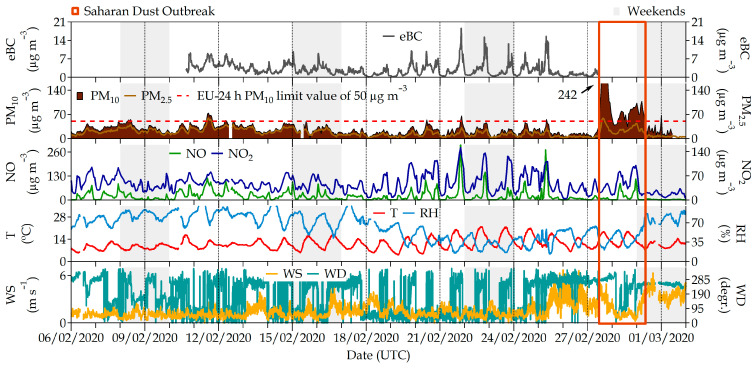
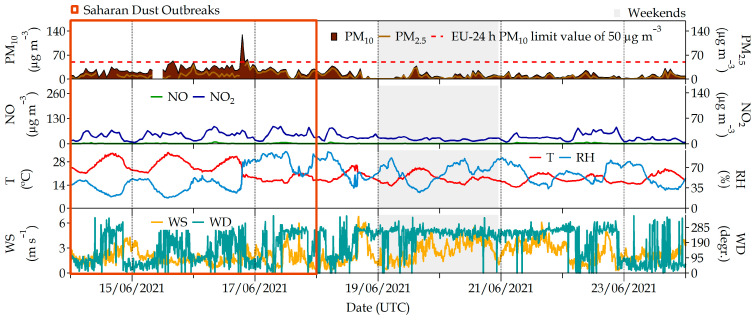
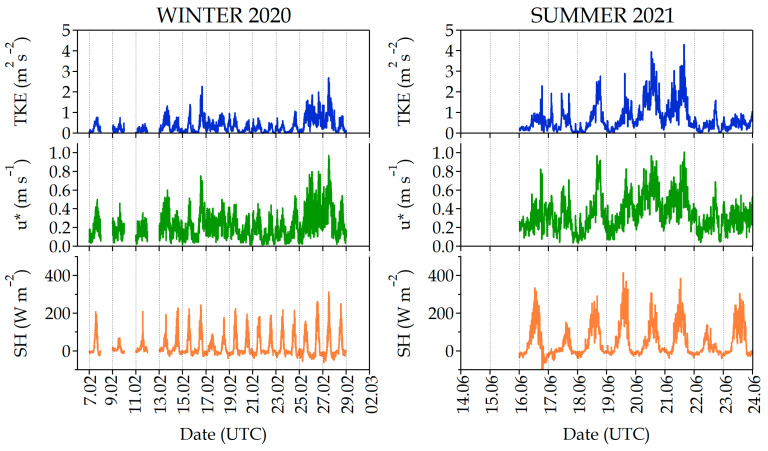
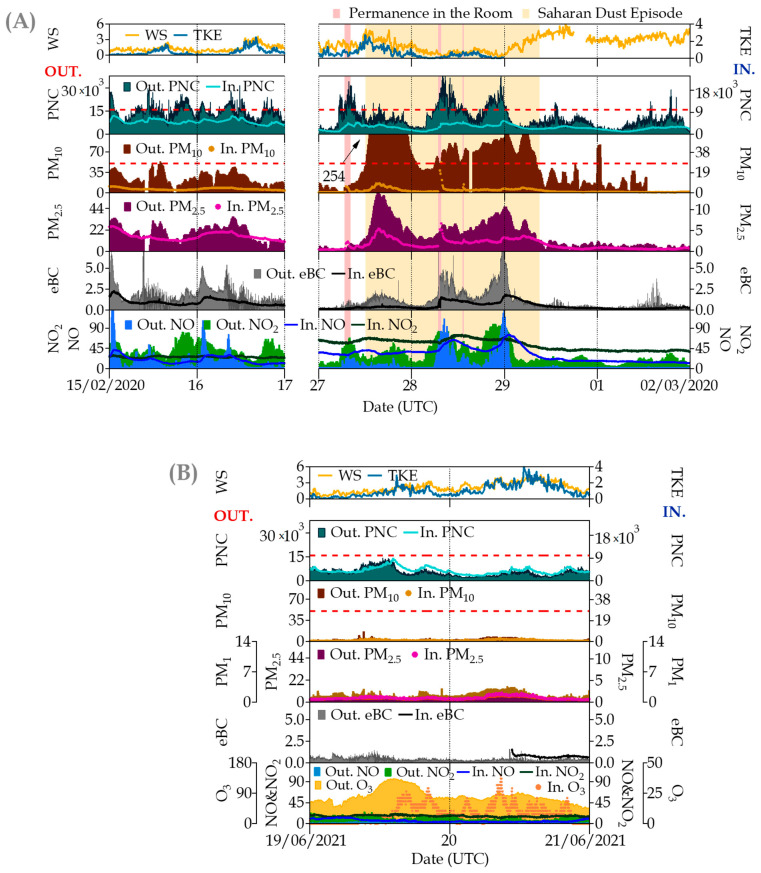
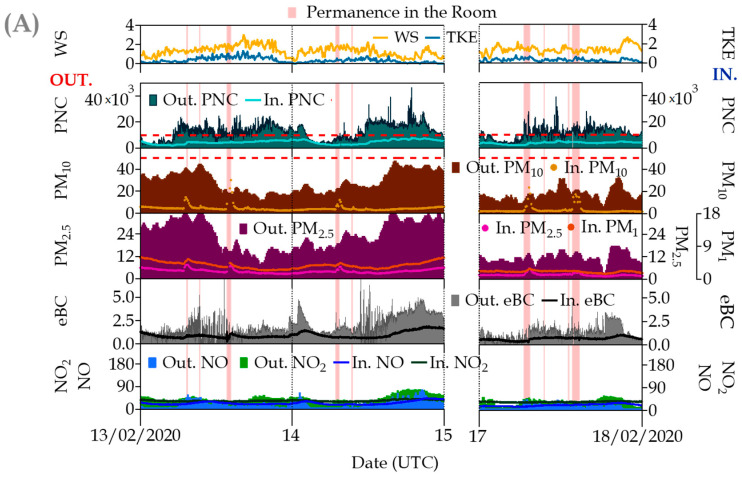
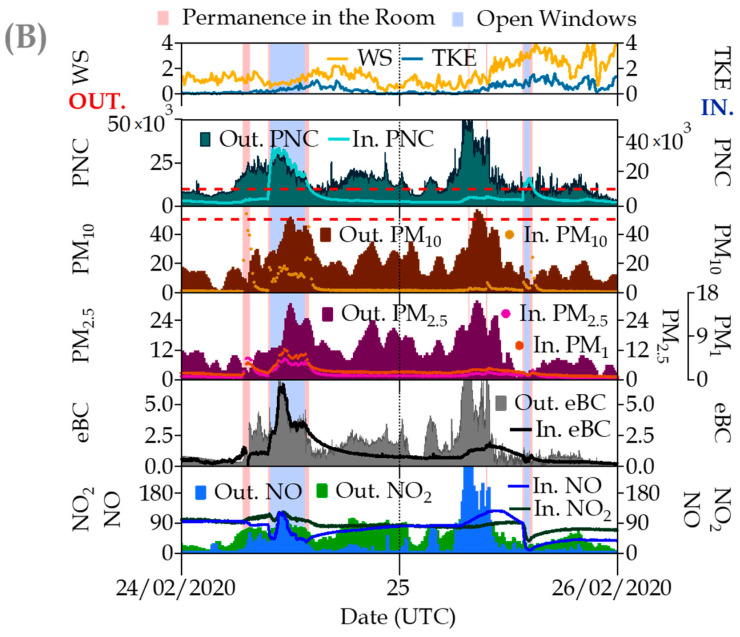
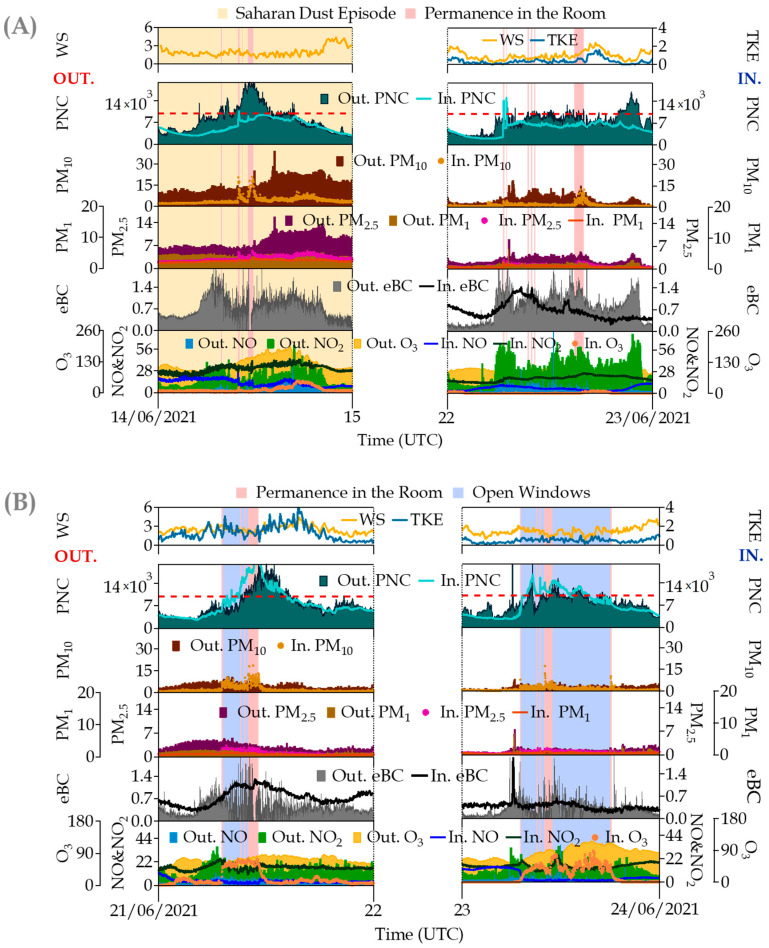
Air pollution is one of the greatest environmental risks to health, causing millions of deaths and deleterious health effects worldwide, especially in urban areas where citizens are exposed to high ambient levels of pollutants, also influencing indoor air quality (IAQ). Many sources of indoor air are fairly obvious and well known, but the contribution of outside sources to indoor air still leads to significant uncertainties, in particular the influence that environmental variables have on outdoor/indoor pollutant exchange mechanisms. This is a critical aspect to consider in IAQ studies. In this respect, an experimental study was performed at a public site such as a university classroom during a non-academic period in Madrid city. This includes two field campaigns, in summer (2021) and winter (2020), where instruments for measuring gases and particle air pollutants simultaneously measured outdoor and indoor real-time concentrations. This study aimed to investigate the dynamic variations in the indoor/outdoor (I/O) ratios in terms of ambient outdoor conditions (meteorology, turbulence and air quality) and indoor features (human presence or natural ventilation). The results show that the I/O ratio is pollutant-dependent. In this sense, the infiltration capacity is higher for gaseous compounds, and in the case of particles, it depends on the particle size, with a higher infiltration capacity for smaller particles (<PM2.5). Additionally, under specific situations of high atmospheric stability, the concentrations of gases derived from traffic tend to accumulate in the room, keeping the background concentrations. These concentrations decreased when room ventilation was produced simultaneously with well-ventilated (high wind speed) external conditions. This suggests that the meteorology and turbulence parameters played a key role in influencing indoor ambient pollution conditions by enhancing the dispersion or accumulation of pollutants. The obtained results highlight the high number of variables involved in the outdoor/indoor exchange of air pollutants and, consequently, how complex its study is. Thus, the knowledge of these factors is critical for understanding the behavior of indoor pollutants and controlling human exposure in indoor environments.

Keywords: gaseous and particulate pollutants; indoor activities; indoor air quality (IAQ); real-time I/O measurements; urban air pollutants.


Conflict of interest statement

The authors declare no conflict of interest.

Figures

Figure 1
Figure 1
Location of the experimental site in Madrid city (A). Surroundings of the site, with the university’s main building inside the white rectangle (B), and the outside of the classroom in the university building (C). (D,E) are pictures of the sampling inlets for outdoor ambient air measurements and the passive tubes, respectively.
Figure 2
Figure 2
Air pollutants PM10, PM2.5, NO, NO2 and eBC recorded at the #Castellana station during the field campaign in February 2020. The two lower panels correspond to meteorological parameters (temperature (T), relative humidity (RH), wind speed (WS) and wind direction (WD)) recorded at the station located on the ETSII building roof.
Figure 3
Figure 3
Air pollutants PM10, PM2.5, NO, NO2 and eBC recorded at the #Castellana station during the field campaign in June 2021. The two lower panels correspond to meteorological parameters (temperature (T), relative humidity (RH), wind speed (WS) and wind direction (WD)) recorded at the station located at the ETSII building roof.
Figure 4
Figure 4
Turbulence parameters (Turbulent Kinetic energy (TKE), friction velocity (u*) and Sensible Heat flow (SH)) recorded at the #Castellana station during the field campaigns in February 2020 (winter 2020) and June 2021 (summer 2021).
Figure 5
Figure 5
Simultaneous time series of indoor/outdoor (I/O) pollutants measured at the university site in some non-occupancy periods (weekends) during (A) winter and (B) summer campaigns. Parameters (units) are denoted in the graphs as follows: WS = wind speed (m s−1); TKE = Turbulent Kinetic Energy (m2 s−2); PNC = Ultrafine Particle Number Concentration (cm−3); PM10, PM2.5 and PM1 = particulate matter mass fractions (μg·m−3); eBC = equivalent Black Carbon (μg·m−3); and NO, NO2 and O3 = Trace gas pollutants (all in μg·m−3). The red dotted line in PNC represents the optimal detection range of the indoor CPC (0–1 × 104 cm−3); in PM10, this dotted line represents the European 24 h standard of 50 μg m−3 for outdoor ambient air levels. In the graph, the prefix “Out.” refers to outdoor measurements, whereas “In.” indicates indoor measurements. Note: in order to show the influence of the Saharan intrusion on indoor measurements during non-occupancy periods, permanence in the room was incorporated into the graph.
Figure 6
Figure 6
Simultaneous time series of indoor/outdoor (I/O) pollutants measured at the university site in some occupancy periods during the winter campaign: (A) Permanence in the room and (B) Permanence in the room + open windows. Parameters (units) are denoted in the graphs as follows: WS = wind speed (m s−1); TKE = Turbulent Kinetic Energy (m2 s−2); PNC = Ultrafine Particle Number Concentration (cm−3); PM10, PM2.5 and PM1 = particulate matter mass fractions (μg·m−3); eBC = equivalent Black Carbon (μg·m−3); and NO, NO2 and O3 = Trace gas pollutants (all in μg·m−3). The red dotted line in PNC represents the optimal detection range of the indoor CPC (0–1 × 104 cm−3); for PM10, this dotted line represents the European 24 h standard of 50 μg m−3 for outdoor ambient air levels. In the graph, the prefix “Out.“ refers to outdoor measurements, whereas “In.“ indicates indoor measurements.
Figure 6
Figure 6
Simultaneous time series of indoor/outdoor (I/O) pollutants measured at the university site in some occupancy periods during the winter campaign: (A) Permanence in the room and (B) Permanence in the room + open windows. Parameters (units) are denoted in the graphs as follows: WS = wind speed (m s−1); TKE = Turbulent Kinetic Energy (m2 s−2); PNC = Ultrafine Particle Number Concentration (cm−3); PM10, PM2.5 and PM1 = particulate matter mass fractions (μg·m−3); eBC = equivalent Black Carbon (μg·m−3); and NO, NO2 and O3 = Trace gas pollutants (all in μg·m−3). The red dotted line in PNC represents the optimal detection range of the indoor CPC (0–1 × 104 cm−3); for PM10, this dotted line represents the European 24 h standard of 50 μg m−3 for outdoor ambient air levels. In the graph, the prefix “Out.“ refers to outdoor measurements, whereas “In.“ indicates indoor measurements.
Figure 7
Figure 7
Simultaneous time series of indoor/outdoor (I/O) pollutants measured at the university site in some occupancy periods during the summer campaign: (A) Permanence in the room + Saharan dust episode (14 June 2021) and Permanence in the room (22 June 2021) and (B) Permanence in the room + open windows. Parameters (units) are denoted in the graphs as follows: WD = wind direction (m s−1); TKE = Turbulent Kinetic Energy (m2 s−2); PNC = Ultrafine Particle Number Concentration (cm−3); PM10, PM2.5 and PM1 = particulate matter mass fractions (μg·m−3); eBC = equivalent Black Carbon (μg·m−3); and NO, NO2 and O3 = Trace gas pollutants (all in μg·m−3). The red dotted line in PNC represents the optimal detection range of the indoor CPC (0–1 × 104 cm−3). In the graph, the prefix “Out.“ refers to outdoor measurements whereas “In.“ indicates indoor measurements.

Similar articles

Cited by

References

    1. WHO . Air Quality Guidelines: Global Update 2005: Particulate Matter, Ozone, Nitrogen Dioxide, and Sulfur Dioxide. World Health Organization; Geneva, Switzerland: 2006. - PubMed
    1. World Health Organization Air Pollution. [(accessed on 4 July 2023)]. Available online: www.who.int/health-topics/air-pollution.
    1. Zaman S.U., Yesmin M., Pavel M., Sarkar R., Jeba F., Salam A. Indoor air quality indicators and toxicity potential at the hospitals’ environment in Dhaka, Bangladesh. Environ. Sci. Pollut. Res. 2021;28:37727–37740. doi: 10.1007/s11356-021-13162-8. - DOI - PubMed
    1. WHO . WHO Global Air Quality Guidelines: Particulate Matter (PM2.5 and PM10), Ozone, Nitrogen Dioxide, Sulfur Dioxide and Carbon Monoxide. World Health Organization; Geneva, Switzerland: 2021. - PubMed
    1. EEA . The European Environment—State and Outlook 2010: Assessment of Global Megatrends. European Environment Agency; Copenhagen, Denmark: 2011.

Publication types