Review
. 2023 Sep 22;15(19):4674.
doi: 10.3390/cancers15194674.

Interpreting Randomized Controlled Trials

Affiliations
Review

Interpreting Randomized Controlled Trials

Pavlos Msaouel et al. Cancers (Basel). .

Abstract

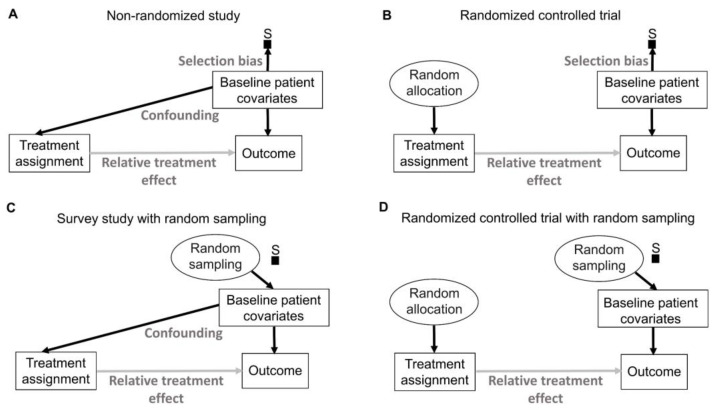
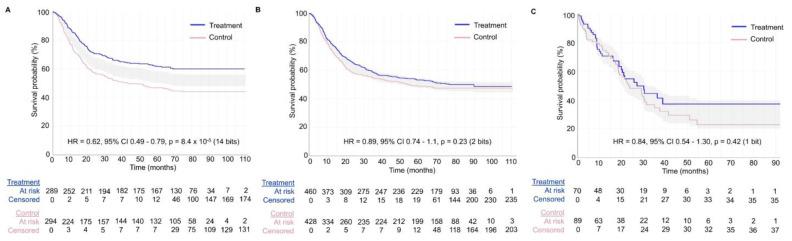
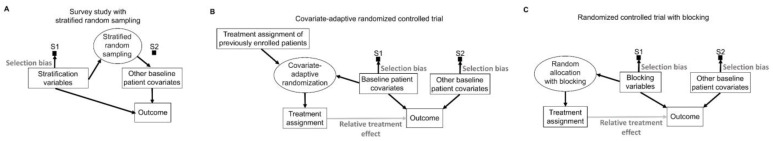
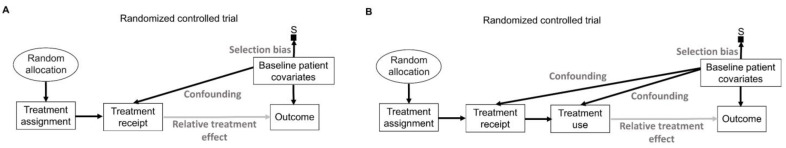
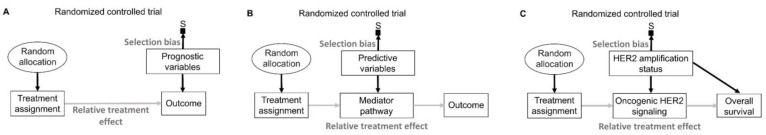
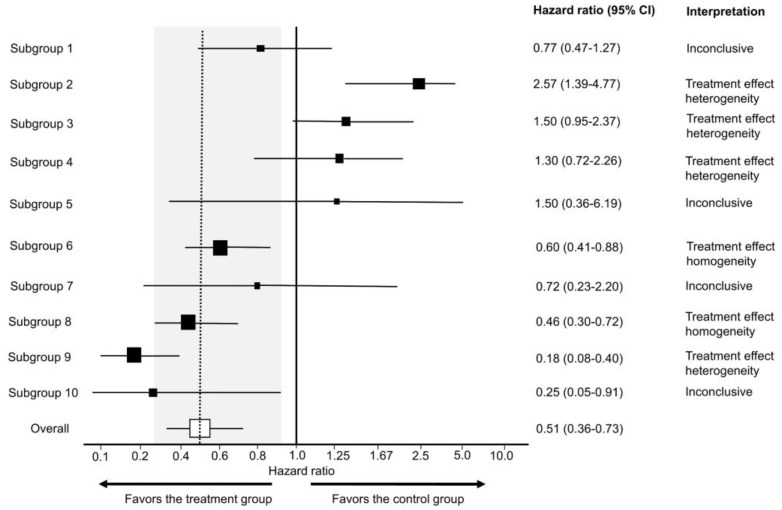
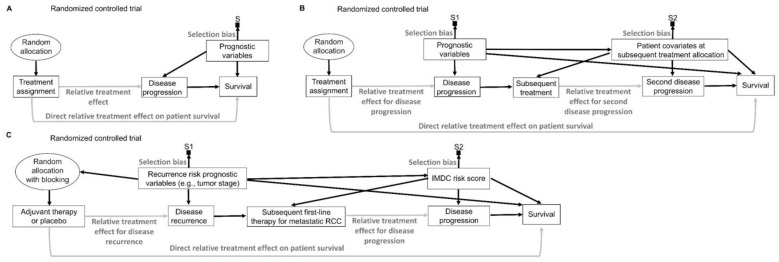
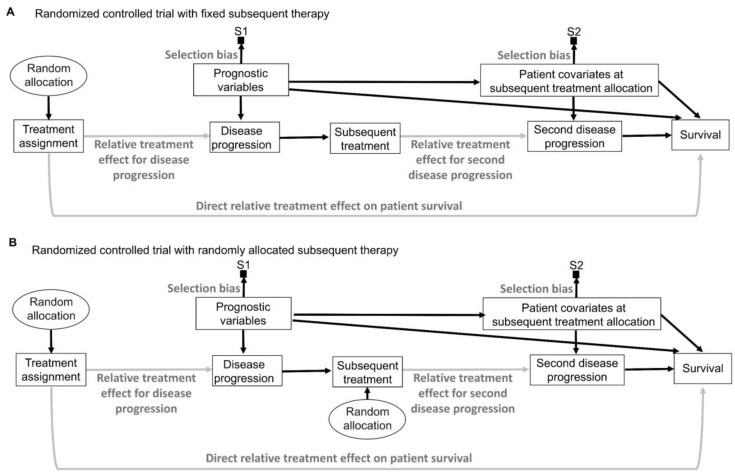
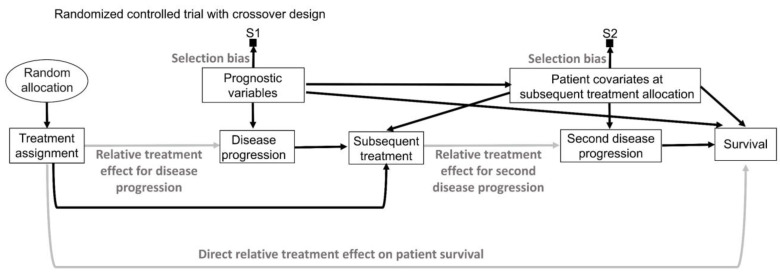
This article describes rationales and limitations for making inferences based on data from randomized controlled trials (RCTs). We argue that obtaining a representative random sample from a patient population is impossible for a clinical trial because patients are accrued sequentially over time and thus comprise a convenience sample, subject only to protocol entry criteria. Consequently, the trial's sample is unlikely to represent a definable patient population. We use causal diagrams to illustrate the difference between random allocation of interventions within a clinical trial sample and true simple or stratified random sampling, as executed in surveys. We argue that group-specific statistics, such as a median survival time estimate for a treatment arm in an RCT, have limited meaning as estimates of larger patient population parameters. In contrast, random allocation between interventions facilitates comparative causal inferences about between-treatment effects, such as hazard ratios or differences between probabilities of response. Comparative inferences also require the assumption of transportability from a clinical trial's convenience sample to a targeted patient population. We focus on the consequences and limitations of randomization procedures in order to clarify the distinctions between pairs of complementary concepts of fundamental importance to data science and RCT interpretation. These include internal and external validity, generalizability and transportability, uncertainty and variability, representativeness and inclusiveness, blocking and stratification, relevance and robustness, forward and reverse causal inference, intention to treat and per protocol analyses, and potential outcomes and counterfactuals.

Keywords: blocking; confidence intervals; generalizability; hazard ratios; random allocation; random sampling; random treatment assignment; randomized controlled trials; stratification; transportability.


Conflict of interest statement

P.M. reports honoraria for scientific advisory board membership for Mirati Therapeutics, Bristol Myers Squibb, and Exelixis; consulting fees from Axiom Healthcare; nonbranded educational programs supported by Exelixis and Pfizer; leadership or fiduciary roles as a Medical Steering Committee member for the Kidney Cancer Association and a Kidney Cancer Scientific Advisory Board member for KCCure; and research funding from Takeda, Bristol Myers Squibb, Mirati Therapeutics, and Gateway for Cancer Research. J.L. and P.F.T. Thall have nothing to disclose.

Figures

Figure 1
Figure 1
Information processing model of the two major schools of statistical inference. The unobserved collection of mechanisms in nature generates phenomena known as data-generating processes. These physical mechanisms generate data, which are then processed by statistical models that use probability distributions to generate information that can be quantified in binary digits (bits) of surprisal. Information can be used to make inferences about both the data-generating process and the unobserved underlying nature.
Figure 2
Figure 2
Bayesian updating of response probability to an investigational therapy in patients with chemotherapy-refractory renal medullary carcinoma (RMC). Prior probability distributions are colored blue and posterior probability distributions are colored red. (A) Uniform prior, also known as the Laplace prior, encoding the assumption that all response values in the unit interval of (0, 1) are equally likely. (B) Posterior probability distribution updated from the uniform prior after 7 out of 10 patients with RMC treated in a pilot feasibility study showed response. (C) Prior probability distribution encoding the knowledge obtained from the pilot study before conducting the main study. (D) Posterior probability distribution updated after 20 out of 50 patients with RMC treated in the main study showed response.
Figure 3
Figure 3
Bayesian updating of response probability to an investigational therapy in patients with chemotherapy-refractory renal medullary carcinoma (RMC). Prior probability distributions are colored blue and posterior probability distributions are colored red. (A) Uniform prior, also known as the Laplace prior, encoding the assumption that all response values in the unit interval of (0, 1) are equally likely. (B) Posterior probability distribution updated from the uniform prior after 20 out of 50 patients with RMC who were treated in the main study showed response. (C) Prior probability distribution encoding the knowledge obtained from the main study. (D) Posterior probability distribution updated after incorporating the results of the pilot study wherein 7 out of 10 patients with RMC showed response.
Figure 4
Figure 4
Frequentist and Bayesian Inference. (A) In a randomized controlled trial (RCT) testing a new therapy versus control, the null hypothesis is expressed as θ = 0 for the relative treatment effect difference between the new therapy and the control. Bayesian models can be used to obtain posterior probabilities of a treatment effect being correct relative to alternative treatment effect values (confirmationist inference) or wrong (refutationist inference). (B) Frequentist models do not use prior distribution but can be used to investigate purely refutational RCT evidence against the embedded statistical model and the assumption that the test hypothesis (typically the null hypothesis of no treatment difference) is true. For example, if the null hypothesis and all other model assumptions are true, the physical act of random treatment assignment would be expected to generate a random distribution of the data D yielded by repeated replications of the RCT. The amount of divergence of the observed data from this expected random distribution is a measure of refutational evidence against the null hypothesis that θ = 0 and all other underlying model assumptions. Similar considerations can be applied to generate refutational evidence against other tested hypotheses corresponding to different values of θ.
Figure 5
Figure 5
Bayesian updating of the DFS HR estimate of the KEYNOTE-564 phase 3 RCT that compared adjuvant pembrolizumab versus placebo in ccRCC. The informative prior probability distribution (blue) is designed to account for the winner’s curse based on an empirical analysis of the results of 23,551 medical RCTs of relative treatment efficacy available in the Cochrane Database of Systematic Reviews. The likelihood (black) is based on the reported frequentist results of KEYNOTE-564, demonstrating an HR of 0.68 with 95% frequentist confidence intervals of 0.53 to 0.87. The posterior distribution (red) combines the prior information (blue) and information from the data (black) and lies in-between. The resulting posterior distribution (red) accounts for the winner’s curse and yields a Bayesian posterior mean HR of 0.76 with 95% posterior CrI 0.59–0.96. The posterior probability that the HR is larger than 1.0 is 0.8%.
Figure 6
Figure 6
Selection diagrams distinguishing the causal effects of the two major types of random procedures used in research. (A) In a nonrandomized trial, the baseline covariates of patients can confound the estimation of the relative treatment effect because they can influence both treatment assignment and the outcome of interest. The selection node S indicates that sampling biases influence the enrichment of these baseline patient covariates in the study. (B) In an RCT, the treatment assignment of each patient or other study unit is only influenced by the random allocation procedure. Therefore, the baseline patient covariates can no longer be systematic confounders of the relative treatment effect but still influence the outcome, thus serving as prognostic factors. The physical act of randomization justifies the estimation of uncertainty measures as random errors for the relative treatment effect parameter comparing the enrolled groups (comparative inference). (C) In survey studies, the random sampling of patients from the population of interest removes systematic sampling biases and provide a physically justifiable distribution for the probability that the enrolled sample estimates for each sampled group are generalizable to the broader population. (D) In pure randomization inference, random allocation and random sampling remove systemic confounding and sampling bias thus allowing the physically justifiable estimation of uncertainty estimates for both the relative treatment effect and sample generalizability.
Figure 7
Figure 7
Example Kaplan–Meier survival plots from three hypothetical RCTs. The shaded gray area represents the midpoint of the treatment and control group survival estimates plus or minus the half-width of the 95% CI for the difference of each group’s Kaplan–Meier probability estimates. This gray polygon is centered at the midpoint between the two groups so that if it crosses one survival curve, it will also cross the other. It thus indicates that p > 0.05 (not multiplicity adjusted) for the null hypothesis of no treatment group difference in that time point, at time points where the gray polygon crosses the survival curves. HRs and their CIs and p-values were estimated using a univariable Cox proportional hazards model. (A) Example RCT with consistent signal of survival difference between the treatment and control (p < 0.05, corresponding to at least 4 bits of information against the null hypothesis). The corresponding Cox regression model yielded 14 bits of refutational information against the null hypothesis of no difference under the assumption that all other background model assumptions are correct. (B) Example RCT with no strong survival difference signal between the treatment and control groups, as indicated by the gray area consistently crossing the survival curves. The consistently narrow width of the gray polygon indicates that the trial results are compatible at the 0.05 level with no clinically meaningful difference between the treatment and control groups throughout the study. This is supported by the corresponding Cox model, which wielded only 2 bits of refutational information against the null hypothesis, as well as a 95% CI compatible with HR effect sizes ranging from 0.74, favoring the treatment group, to 1.1, favoring the control group. (C) This example RCT also has no strong survival difference signal between the treatment and control groups. The consistently wide gray area indicates that the signal is very low at all time points. Therefore, no inferences can be made on whether or not there is a treatment difference based on these survival curves. Accordingly, the corresponding Cox model yielded very low refutational information against the null hypothesis and a very wide 95% CI compatible with HR effect sizes as low as 0.54, strongly favoring the treatment group, and as high as 1.30, strongly favoring the control group.
Figure 8
Figure 8
Selection diagrams distinguishing the causal effects of stratification, covariate-adaptive randomization, and blocking. (A) Surveys can obtain samples from explicitly specified stratification variables, which divide the population into smaller subgroups called “strata”. This induces a selection bias specifically for the stratification variables. Patients are then selected randomly from each stratum to form the final sample. (B) Clinical trials can ensure balance of specific baseline patient covariates by choosing the treatment assignment of each patient after adaptively accounting for their baseline patient covariates and for the treatment assignment of previously enrolled patients. Minimization is the most commonly used covariate-adaptive randomization method used in clinical trials. This covariate-adaptive “randomization” is actually a largely nonrandom treatment allocation method because it is influenced by the characteristics of earlier patients along with the baseline covariates of the current patient. (C) RCTs can limit the random allocation of treatments in such a way that each treatment group is balanced with respect to explicitly specified blocking variables, reducing the heterogeneity of the outcome. An additional non-mutually exclusive strategy would be to covariate adjust in the statistical model for the effect of the blocking variables on the outcome.
Figure 9
Figure 9
Selection diagrams distinguishing per intention to treat (ITT), per protocol (PP), and as treated (AT) in RCTs. (A) Diagram illustrating the scenario whereby patients randomly assigned to a treatment did not always receive it. The relative treatment effect parameter from the PP analysis is more relevant for direct patient care but is susceptible to confounding biases from covariates that may have influenced treatment receipt. (B) Diagram illustrating the scenario whereby patients randomly assigned to a treatment did not always receive it, and those that received it did not always use it. The relative treatment effect parameter from the AT analysis is more relevant for direct patient care but is susceptible to confounding biases from covariates that may have influenced treatment receipt and treatment use.
Figure 10
Figure 10
Selection diagrams representing the data-generating processes of prognostic and predictive effects in RCTs. (A) Prognostic biomarkers are baseline patient variables that directly influence the outcome and not the relative treatment effect. Thus, relative treatment effect parameters such as HRs and odds ratios (ORs) are assumed to be stable for all patients in the RCT cohort. (B) Predictive biomarkers are baseline patient variables that influence the relative treatment effect via their effect on the mediator pathway that transmits the effect of treatment assignment on the RCT outcome. HRs, ORs, and other relative treatment effect parameters can change depending on the values of the predictive biomarker. (C) In patients with breast cancer, HER2 amplification status acts as both a prognostic and predictive biomarker.
Figure 11
Figure 11
Example forest plot from a hypothetical RCT of an investigational treatment versus control. The forest plot is used to look for predictive effects expressed as differences in HR estimates in different subgroups compared with the overall RCT cohort. The dotted vertical line highlights the relative treatment effect point estimate for the overall cohort, also known as the main effect. The size of the black squares corresponds to the sample size of each subgroup. The white square represents the overall RCT cohort. The horizontal lines represent the 95% Cis. The shaded gray area represents the indifference zone for the HR estimate in the overall cohort, assuming that relative treatment effects between 80% and 125% of the 95% CI for the overall cohort do not represent clinically meaningful differences between each subgroup and the overall cohort. In this example, the 95% CI for the HR in the overall cohort is 0.36–0.73, corresponding to an indifference zone of 0.29–0.91. Therefore, treatment effect homogeneity is suggested for all subgroups with the 95% CI that are only compatible with values within the indifference zone (gray area). Treatment effect heterogeneity is suggested in subgroups with 95% CI that do not overlap with the dotted vertical line. All other subgroups are inconclusive.
Figure 12
Figure 12
Selection diagrams representing the data-generating processes of clinical endpoints in RCTs. (A) In RCTs where no subsequent options are available, intermediate events such as disease progression will directly correlate with survival. Thus, the prognostic variables that influence disease progression will also influence survival directly or indirectly via the disease progression pathway. Blocking or adjusting for these variables will increase the reliability of disease progression and survival estimates. (B) In RCTs where subsequent therapies are available, random allocation removes all other causal influences on the treatment assignment of the first therapy, physically justifying the use of uncertainty estimates of the direct relative treatment effect on patient survival and the relative treatment effect for intermediate endpoints such as disease progression. These are the parameters used for intermediate survival endpoints such as PFS or DFS. However, the effect of the original treatment assignment on survival will also be mediated indirectly by subsequent therapies and disease progression events, which can be confounded by patient covariates at the time of subsequent treatment allocation. (C) Example RCT to evaluate the effect of adjuvant therapy or placebo in patients with localized ccRCC. Baseline prognostic factors, such as tumor stage, that influence disease recurrence can be balanced by blocking and adjusting in the statistical model to facilitate estimation of the DFS endpoint. However, upon disease recurrence, the choice of subsequent therapies will be influenced by covariates such as the International Metastatic Renal Cell Carcinoma Database Consortium (IMDC) risk score for metastatic RCC. This confounding influence and mediating effect of subsequent therapies and disease progression need to be modeled for reliable estimation of the OS endpoint.
Figure 13
Figure 13
Selection diagrams representing the data-generating processes of clinical endpoints in RCTs to evaluate treatment regimes. (A) RCTs evaluating static treatment regimes prespecify a fixed subsequent treatment strategy that all enrolled patients will use upon disease progression to the randomly assigned first treatment. Thus, the only variable that influences whether a patient receives the subsequent treatment is the presence of disease progression to the first treatment. (B) RCTs evaluating dynamic treatment regimes may randomly allocate both the first and subsequent treatment assignment. This facilitates reliable estimation of the effect of sequential decision rules for the initial and subsequent therapy strategy to optimize long-term outcomes such as OS.
Figure 14
Figure 14
Selection diagram representing the data-generating processes of clinical endpoints in RCTs that allow crossover. Random allocation removes all other causal influences on the assignment of the first therapy, physically justifying the use of uncertainty estimates of the direct relative treatment effect on patient survival and the relative treatment effect for intermediate endpoints such as disease progression. These parameters are used for intermediate survival endpoints such as PFS or DFS. Due to potential crossover, the randomly assigned initial treatment will influence the choice of subsequent treatment. The effect of the original treatment assignment on survival will be mediated indirectly by such subsequent therapy choices and disease progression events, which can also be confounded by patient covariates at the time of subsequent treatment allocation. Depending on how the first treatment assignment influences the subsequent treatment during crossover, the OS parameter can be biased toward a false-positive or false-negative direction.

Similar articles

Cited by

References

    1. Msaouel P., Lee J., Thall P.F. Making Patient-Specific Treatment Decisions Using Prognostic Variables and Utilities of Clinical Outcomes. Cancers. 2021;13:2741. doi: 10.3390/cancers13112741. - DOI - PMC - PubMed
    1. Msaouel P., Lee J., Karam J.A., Thall P.F. A Causal Framework for Making Individualized Treatment Decisions in Oncology. Cancers. 2022;14:3923. doi: 10.3390/cancers14163923. - DOI - PMC - PubMed
    1. Lee J., Thall P.F., Lim B., Msaouel P. Utility-based Bayesian personalized treatment selection for advanced breast cancer. J. R. Stat. Soc. Ser. C Appl. Stat. 2022;71:1605–1622. doi: 10.1111/rssc.12582. - DOI - PMC - PubMed
    1. Lee J., Thall P.F., Msaouel P. Bayesian treatment screening and selection using subgroup-specific utilities of response and toxicity. Biometrics. 2022;79:2458–2473. doi: 10.1111/biom.13738. - DOI - PMC - PubMed
    1. Marshall I.J., Nye B., Kuiper J., Noel-Storr A., Marshall R., Maclean R., Soboczenski F., Nenkova A., Thomas J., Wallace B.C. Trialstreamer: A living, automatically updated database of clinical trial reports. J. Am. Med. Inform. Assoc. 2020;27:1903–1912. doi: 10.1093/jamia/ocaa163. - DOI - PMC - PubMed

LinkOut - more resources