. 2023 Sep 25;15(19):4707.
doi: 10.3390/cancers15194707.

High-Dimensional Mass Cytometry Analysis of Embryonic Antigens and Their Signaling Pathways in Myeloid Cells from Bone Marrow Aspirates in AML Patients at Diagnosis

Affiliations

High-Dimensional Mass Cytometry Analysis of Embryonic Antigens and Their Signaling Pathways in Myeloid Cells from Bone Marrow Aspirates in AML Patients at Diagnosis

Carmen-Mariana Aanei et al. Cancers (Basel). .

Abstract

Background: Embryonic antigens (EA) regulate pluripotency, self-renewal, and differentiation in embryonic stem (ES) cells during their development. In adult somatic cells, EA expression is normally inhibited; however, EAs can be re-expressed by cancer cells and are involved in the deregulation of different signaling pathways (SPs). In the context of AML, data concerning the expression of EAs are scarce and contradictory.

Methods: We used mass cytometry to explore the expression of EAs and three SPs in myeloid cells from AML patients and normal bone marrow (NBM). Imaging flow cytometry was used for morphological assessment of cells in association with their OCT3/4 expression status (positive vs. negative).

Results: An overall reduction in or absence of EA expression was observed in immature myeloid cells from AML patients compared to their normal counterparts. Stage-specific embryonic antigen-3 (SSEA-3) was consistently expressed at low levels in immature myeloid cells, whereas SSEA-1 was overexpressed in hematopoietic stem cells (HSCs) and myeloblasts from AML with monocytic differentiation (AML M4/M5). Therefore, these markers are valuable for distinguishing between normal and abnormal myeloid cells. These preliminary results show that the exploration of myeloid cell intracellular SPs in the setting of AML is very informative. Deregulation of three important leukemogenic SPs was also observed in myeloid cells from AML.

Conclusions: Exploring EAs and SPs in myeloid cells from AML patients by mass cytometry may help identify characteristic phenotypes and facilitate AML follow-up.

Keywords: Nanog; OCT3/4; SOX2; SSEA1; SSEA3; STAT3/p-STAT3; acute myeloid leukemia; mass cytometry; p-p38; β-catenin.


Conflict of interest statement

The authors declare no conflict of interest.

Figures

Figure 1
Figure 1
Schematic overview of the study. (A) Phase 1: Protocol development. A 36-antibody panel was tested on NTERA-2, KG1a, HL60, and U937 cell lines. Primary antibodies allowing discrimination of cell populations are highlighted in yellow, secondary discriminating antibodies are shown in green, embryonic antigens (EAs) are displayed in salmon, and signaling proteins (SPs) are shown in gray. A total of 2.4–3.7 × 10⁶ cells were stained with the 36 antibodies, 0.7–3.6 × 10⁶ cells per sample were run on the Helios mass cytometer, and data acquired from 0.06–2.5 × 10⁶ cells per sample were used for cellular immunophenotyping and EA and SP expression analysis. Imaging flow cytometry was used for visualization and morphologic characterization of OCT3/4-positive cells. (B) Phase 2: Inclusion of patient samples and control subjects. Fourteen normal bone marrow (NBM) aspirates and 15 acute myeloid leukemia (AML) samples were stained with the 36-antibody panel. After data acquisition on the Helios mass cytometer, the resulting FCS files were processed with the flowCut automated data cleaning algorithm. Files containing a reduced number of usable events (<0.2 × 10⁶ events) were removed from the study. Finally, 7 NBM and 8 AML samples were analyzed using a manual sequential method. Analysis of the expression of cell-specific markers was then performed on all identified cell populations to complete their characterization and assign them to a cell type.
Figure 2
Figure 2
Phenotypic and morphological characterization of the cell lines. (A) Evaluation of embryonic antigen (EA) and signaling protein (SP) expression on NTERA-2 pluripotent human embryonal carcinoma cells and three leukemic cell lines (KG1a, HL60, and U937) by mass cytometry. (B) Morphological visualization of OCT3/4-positive compared to OCT3/4-negative NTERA-2 and HL60 leukemic cells with imaging cytometry.
Figure 3
Figure 3
Box plots showing the intensity of expression (MMI) of embryonic antigens (EA): (A) OCT3/4, (B) Nanog, (C) SOX2, (D) SSEA-1, and (E) SSEA-3 in normal myeloid cells: hematopoietic stem cells (HSCs), CD34+ myeloblasts, CD117+ myeloblasts, monoblasts, monocytic cells immature (MO), mature MO cells, and neutrophils from seven normal bone marrow samples. The median of the seven MMI values is indicated by the solid lines inside the boxes, the dashed line indicates the mean values, q3 is the upper limit, q1 is the lower limit, and the ends of the whiskers indicate the maximum and minimum values. Individual MMI values are indicated by dots.
Figure 4
Figure 4
Box plots showing the intensity of expression (MMI) of signaling proteins (SP): (A) STAT3, (B) p-STAT3, (C) β-catenin, and (D) p-p38 in normal myeloid cells: hematopoietic stem cells (HSCs), CD34+ myeloblasts, CD117+ myeloblasts, monoblasts, monocytic cells immature (MO), mature MO cells, and neutrophils from seven normal bone marrow samples. The median of the seven MMI values is indicated by the solid lines inside the boxes, the dashed line indicates the mean values, q3 is the upper limit, q1 is the lower limit, and the ends of the whiskers indicate the maximum and minimum values. Individual MMI values are indicated by dots.
Figure 5
Figure 5
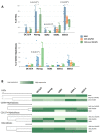
Evaluation of differences in EA expression between acute myeloid leukemia (AML) and normal bone marrow (NBM) by mass cytometry. (A) Box plots showing the percentages of EA-positive hematopoietic stem cells (HSCs) and CD34+ myeloblasts in AML M4/M5 and non-M4/M5 AML compared to normal controls. The median value is indicated by the solid line inside the box, the dashed line indicates the mean value, q3 is the upper boundary, q1 is the lower boundary, and the ends of the whiskers indicate the maximum and minimum values. (B) Heat maps illustrating EA expression in immature myeloid cell subpopulations (HSCs, CD34+ myeloblasts, CD117+ myeloblasts, and monoblasts) in AML M4/M5 and non M4/M5-AML compared to NBM. *, p-value ≤ 0.05.
Figure 6
Figure 6
Evaluation of the differences in signaling protein (SP) expression (β-catenin, p-p38, STAT3, and p-STAT3) between acute myeloid leukemia (AML) and normal bone marrow (NBM) by mass cytometry. (A) Box plots showing the percentages of SP-positive hematopoietic stem cells (HSCs) and CD34+ myeloblasts in AML M4/M5 and non-M4/M5 AML compared to NBM. Median values are indicated by the solid line inside the box, the dashed line indicates the mean value, q3 represents the upper boundary, q1 represents the lower boundary, and the ends of the whiskers indicate the maximum and minimum values. (B) Heat maps illustrating SP expression in immature myeloid cell subpopulations (HSCs, CD34+ myeloblasts, CD117+ myeloblasts, and monoblasts) in AML M4/M5 and non-M4/M5 AML compared to NBM. *, p ≤ 0.05; **, p ≤ 0.01.
Figure 7
Figure 7
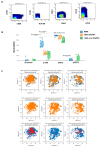
Evaluation of signaling protein (SP) expression in neutrophils by mass cytometry. (A) Bivariate dot plots illustrating the relevant immunophenotypic features of neutrophils. (B) Box plots showing the percentages of SP-positive (β-catenin, p-p38, STAT3, and p-STAT3) neutrophils in non-M4/M5 AML and AML M4/M5 compared to normal samples. The median value is indicated by the solid line inside the box; the dashed line inside the box indicates the mean value; q3 and q1 represent the upper and lower boundaries, respectively; and the ends of the whiskers indicate the maximum and minimum values. The blue, orange, and green boxes represent normal controls, AML M4/M5, and non-M4/M5 AML, respectively. (C) opt-SNE allowing visualization of p-p38, STAT3, and p-STAT3 expression in neutrophils. First row: p-p38 expression overlaid on opt-SNE plots. Orange and blue dots correspond to p-p38-positive and p-p-38-negative neutrophils, respectively. Second row: STAT3 expression overlaid on opt-SNE plots. The orange and blue dots correspond to STAT3-positive and STAT3-negative neutrophils, respectively. Third row: p-STAT3 expression overlaid on opt-SNE plots. The red and blue dots correspond to p-STAT3-positive and p-STAT3-negative neutrophils, respectively. First column: normal controls (NBM); second column: AML M4/M5; third column: other AML (non-M4/M5 AML). *, p ≤ 0.05; **, p ≤ 0.01.

Similar articles

References

    1. Kashyap V., Rezende N.C., Scotland K.B., Shaffer S.M., Persson J.L., Gudas L.J., Mongan N.P. Regulation of stem cell pluripotency and differentiation involves a mutual regulatory circuit of the NANOG, OCT4, and SOX2 pluripotency transcription factors with polycomb repressive complexes and stem cell microRNAs. Stem Cells Dev. 2009;18:1093–1108. doi: 10.1089/scd.2009.0113. - DOI - PMC - PubMed
    1. Pan G., Chang Z., Schöler H., Pei D. Stem cell pluripotency and transcription factor Oct4. Cell Res. 2002;12:321–329. doi: 10.1038/sj.cr.7290134. - DOI - PubMed
    1. Pan G., Thomson J. Nanog and transcriptional networks in embryonic stem cell pluripotency. Cell Res. 2007;17:42–49. doi: 10.1038/sj.cr.7310125. - DOI - PubMed
    1. Zhao X., Hui L., Yan S., Li L., Huafang W. Prognostic value of octamer binding transcription factor 4 for patients with solid tumors: A meta-analysis. Medicine. 2020;99:e22804. doi: 10.1097/MD.0000000000022804. - DOI - PMC - PubMed
    1. Qinjun Z., Hongying R., Sizhou F., Ying C., Yi H., Donglin Y., Fengxia M., Jianping L., Shihong L., Fang C., et al. Aberrant expression and significance of OCT-4A transcription factor in leukemia cells. Blood Cells Mol. Dis. 2015;54:90–96. - PubMed