. 2023 Sep 22;15(19):4102.
doi: 10.3390/nu15194102.

Polysaccharide from Smilax glabra Roxb Mitigates Intestinal Mucosal Damage by Therapeutically Restoring the Interactions between Gut Microbiota and Innate Immune Functions

Affiliations

Polysaccharide from Smilax glabra Roxb Mitigates Intestinal Mucosal Damage by Therapeutically Restoring the Interactions between Gut Microbiota and Innate Immune Functions

Muhammad Abaidullah et al. Nutrients. .

Abstract

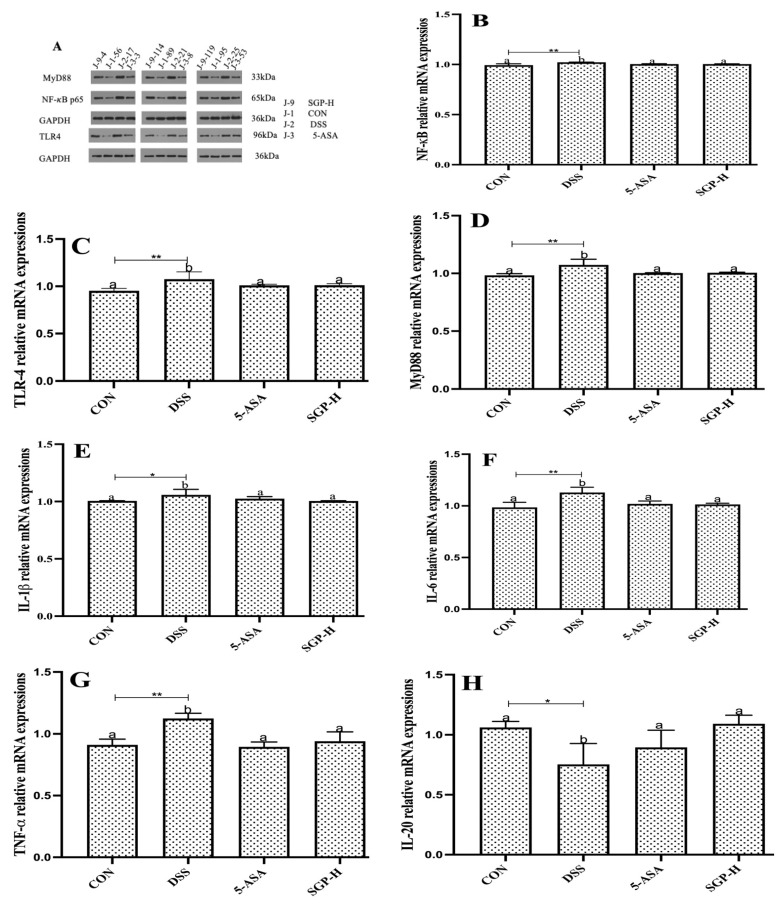
Smilax glabra Roxb (S. glabra) is a conventional Chinese medicine that is mainly used for the reliability of inflammation. However, bioactive polysaccharides from S. glabra (SGPs) have not been thoroughly investigated. Here, we demonstrate for the first time that SGPs preserve the integrity of the gut epithelial layer and protect against intestinal mucosal injury induced by dextran sulfate sodium. Mechanistically, SGPs mitigated colonic mucosal injury by restoring the association between the gut flora and innate immune functions. In particular, SGPs increased the number of goblet cells, reduced the proportion of apoptotic cells, improved the differentiation of gut tight junction proteins, and enhanced mucin production in the gut epithelial layer. Moreover, SGPs endorsed the propagation of probiotic bacteria, including Lachnospiraceae bacterium, which strongly correlated with decreased pro-inflammatory cytokines via the blocking of the TLR-4 NF-κB and MyD88 pathways. Overall, our study establishes a novel use of SGPs for the treatment of inflammatory bowel disease (IBD)-associated mucosal injury and provides a basis for understanding the therapeutic effects of natural polysaccharides from the perspective of symbiotic associations between host innate immune mechanisms and the gut microbiome.

Keywords: Smilax glabra Roxb polysaccharides; cytokines; goblet cells; microbiota; tight junction proteins; ulcerative colitis.


Conflict of interest statement

The authors declare no conflict of interest.

Figures

Figure 1
Figure 1
Effects of SGPs on mice with colitis induced by DSS. (A) Schematic representation of the experimental plan. (B) Body weight (BW) gain in SGPs supplemented mice. (C) % BW changes after DSS treatment. (D) DAI scores DSS treatments. (E) Colon size. (F) Average colon length in all groups. Data are shown as means ± SEM (n = 12 mice/group). The differences between the groups were. considered significant at * p < 0.05. In comparison to the control group, significance levels were denoted as * p  <  0.05, ** p  <  0.01, *** p  <  0.001. Different letters indicate significant difference between the respective groups while same letter indicates no significant difference.
Figure 2
Figure 2
SGPs reserved gut histological injury triggered by DSS. (A,B) Characteristic photos of the ileum and colon tissues in H & E-stained pathological sections. Scale bar 400 μm. (C,D) Histopathological scores of ileum and colon tissues. (E,F) Representative images of Alcian blue/PAS-stained ileum sections. Scale bar, 400 μm (E) and 100 μm (F). (G,H) Representative images of Alcian blue/PAS-stained distal colon sections. Scale bar, 400 μm (G) and 100 μm (H). (I) Quantification of PAS-positive goblet cells per velus in the ileum tissue. (J) Quantification of PAS-positive goblet cells per crypt in the distal colon. (K,L) Apoptosis in the colon. Scale bar, 400 μm (K) and 100 μm (L). (M) the numbers of TUNEL-positive cells in the colon (at least 5 parts were evaluated for each sample). Data are shown as means ± SEM (n = 12 mice/group). The differences between the groups were considered significant at * p < 0.05. In comparison to the control group, significance levels were denoted as * p  <  0.05, ** p  <  0.01, *** p  <  0.001. Different letters indicate significant difference between the respective groups while same letter indicates no significant difference.
Figure 2
Figure 2
SGPs reserved gut histological injury triggered by DSS. (A,B) Characteristic photos of the ileum and colon tissues in H & E-stained pathological sections. Scale bar 400 μm. (C,D) Histopathological scores of ileum and colon tissues. (E,F) Representative images of Alcian blue/PAS-stained ileum sections. Scale bar, 400 μm (E) and 100 μm (F). (G,H) Representative images of Alcian blue/PAS-stained distal colon sections. Scale bar, 400 μm (G) and 100 μm (H). (I) Quantification of PAS-positive goblet cells per velus in the ileum tissue. (J) Quantification of PAS-positive goblet cells per crypt in the distal colon. (K,L) Apoptosis in the colon. Scale bar, 400 μm (K) and 100 μm (L). (M) the numbers of TUNEL-positive cells in the colon (at least 5 parts were evaluated for each sample). Data are shown as means ± SEM (n = 12 mice/group). The differences between the groups were considered significant at * p < 0.05. In comparison to the control group, significance levels were denoted as * p  <  0.05, ** p  <  0.01, *** p  <  0.001. Different letters indicate significant difference between the respective groups while same letter indicates no significant difference.
Figure 3
Figure 3
The level of ZO-1 (A), claudin (B) and occludin (C) in the mouse colon were assessed by ELISA. (D) TEM images present the effects of SGPs on structural defects in TJs upon DSS treatment. Data are shown as means ± SEM (n = 12 mice/group). The differences between the groups were considered significant at * p < 0.05. In comparison to the control group, significance levels were denoted as * p  <  0.05, ** p  <  0.01, *** p  <  0.001. Different letters indicate significant difference between the respective groups while same letter indicates no significant difference.
Figure 4
Figure 4
SGP-H improved the intestinal mucus layer barriers of mice with colitis. (A) Mouse colon MUC2 protein immunohistochemistry image Scale bar, 500 μm (upper panel) and 50 μm (lower panel). (B) Mouse colon MUC5AC protein immunohistochemistry image Scale bar, 500 μm (upper panel) and 50 μm (lower panel). Proportion of brown stained areas represent the abundance of mucin proteins. (C) MUC2 protein expression score in mouse colon. (D) MUC5AC protein expression score in mouse colon. The differences between the groups were considered significant. In comparison to the control group, significance levels were denoted as ** p  <  0.01. Different letters indicate significant difference between the respective groups while same letter indicates no significant difference.
Figure 5
Figure 5
SGP-H blocked the inflammatory pathways and ameliorate the gut inflammation. (A) Western blotting of the expressions of the TLR4/MyD88/NF-κB signaling pathway. (BD) Relative mRNA expressions of the TLR4/MyD88/NF-κB signaling pathway (BD). Relative mRNA expression levels of inflammatory cytokines IL-1β (E), IL-6 (F) and TNF-α (G). Relative mRNA expression levels of anti-inflammatory cytokines IL-10 (H), IL-20 (I). Serum levels of inflammatory cytokines IL-1β (J), IL-6 (K) and TNF-α (L). Serum levels of anti-inflammatory cytokines IL-10 (M), IL-20 (N). The differences between the groups were considered significant at * p < 0.05. In comparison to the control group, significance levels were denoted as * p  <  0.05, ** p  <  0.01, *** p  <  0.001. Different letters indicate significant difference between the respective groups while same letter indicates no significant difference.
Figure 5
Figure 5
SGP-H blocked the inflammatory pathways and ameliorate the gut inflammation. (A) Western blotting of the expressions of the TLR4/MyD88/NF-κB signaling pathway. (BD) Relative mRNA expressions of the TLR4/MyD88/NF-κB signaling pathway (BD). Relative mRNA expression levels of inflammatory cytokines IL-1β (E), IL-6 (F) and TNF-α (G). Relative mRNA expression levels of anti-inflammatory cytokines IL-10 (H), IL-20 (I). Serum levels of inflammatory cytokines IL-1β (J), IL-6 (K) and TNF-α (L). Serum levels of anti-inflammatory cytokines IL-10 (M), IL-20 (N). The differences between the groups were considered significant at * p < 0.05. In comparison to the control group, significance levels were denoted as * p  <  0.05, ** p  <  0.01, *** p  <  0.001. Different letters indicate significant difference between the respective groups while same letter indicates no significant difference.
Figure 6
Figure 6
SGP-H enhanced the diversity of the gut microbiota in a mouse model of colitis. (a) The OTUs that were unique to each group are shown in the Venn diagram. (b) α-Diversity analysis: Simpson index at OTU level. (c) Beta-diversity Visualized Using NMDS Plot with Bray–Curtis Dissimilarity Distances.
Figure 7
Figure 7
SGP-H influenced the species-level makeup of the gut microbiota in colitis mice. (a) Chord diagram showing species-level of the fecal microbiota. The upper half circle represents the four treatment groups, while the lower half circle represents the overall composition of fecal microbiota across all groups. (b) Community heatmap analysis of top 33 species. (c) Differential analysis among these four groups at the species level. (d) Differential analysis compared with DSS and SGP-H group at species level.
Figure 8
Figure 8
SGP-H supplementation modulated the function of gut microbs in the mice treated with DSS. (a) PCoA plot on the basis of KEGG pathways of reported microbial genes. (b) LEfSe analysis of differential enrichment of bacterial KEGG pathways (LDA > 2.5). (c) LEfSe analysis of differential enrichment of bacterial carbohydrate-active enzymes (CAZymes) (LDA > 3). (d) Functional contribution of top 6 differentially enriched CAZymes.
Figure 9
Figure 9
RDA analysis and Spearman’s correlation. (A) Correlation between inflammatory and ant-inflammatory cytokines and microbial flora structure displayed by distance-based redundancy analysis (db-RDA) (B) Correlation among tight junction proteins, and gut microbiota structure displayed by distance-based redundancy analysis (db-RDA). (C) Spearman’s correlation heatmap of inflammatory, ant-inflammatory cytokines, tight junction and gut microbiota. The differences between the groups were considered significant at * p < 0.05. In comparison to the control group, significance levels were denoted as * p  <  0.05, ** p  <  0.01, *** p  <  0.001.

References

    1. van der Lelie D., Oka A., Taghavi S., Umeno J., Fan T.J., Merrell K.E., Watson S.D., Ouellette L., Liu B., Awoniyi M., et al. Rationally designed bacterial consortia to treat chronic immune-mediated colitis and restore intestinal homeostasis. Nat. Commun. 2021;12:3105. doi: 10.1038/s41467-021-23460-x. - DOI - PMC - PubMed
    1. Kurashima Y., Kigoshi T., Murasaki S., Arai F., Shimada K., Seki N., Kim Y.G., Hase K., Ohno H., Kawano K., et al. Pancreatic glycoprotein 2 is a first line of defense for mucosal protection in intestinal inflammation. Nat. Commun. 2021;12:1067. doi: 10.1038/s41467-021-21277-2. - DOI - PMC - PubMed
    1. Wu J., Wei Z., Cheng P., Qian C., Xu F., Yang Y., Wang A., Chen W., Sun Z., Lu Y. Rhein modulates host purine metabolism in intestine through gut microbiota and ameliorates experimental colitis. Theranostics. 2020;10:10665. doi: 10.7150/thno.43528. - DOI - PMC - PubMed
    1. Mohanan V., Nakata T., Desch A.N., Lévesque C., Boroughs A., Guzman G., Cao Z., Creasey E., Yao J., Boucher G., et al. C1orf106 is a colitis risk gene that regulates stability of epithelial adherens junctions. Science. 2018;359:1161–1166. doi: 10.1126/science.aan0814. - DOI - PMC - PubMed
    1. Ramos G.P., Papadakis K.A. Mayo Clinic Proceedings. Elsevier; Amsterdam, The Netherlands: 2019. Mechanisms of disease: Inflammatory bowel diseases; pp. 155–165. - PMC - PubMed

LinkOut - more resources