Randomized Controlled Trial
. 2023 Oct 2;15(19):4248.
doi: 10.3390/nu15194248.

Effects of Synbiotic Supplementation on Metabolic Syndrome Traits and Gut Microbial Profile among Overweight and Obese Hong Kong Chinese Individuals: A Randomized Trial

Affiliations
Randomized Controlled Trial

Effects of Synbiotic Supplementation on Metabolic Syndrome Traits and Gut Microbial Profile among Overweight and Obese Hong Kong Chinese Individuals: A Randomized Trial

Susana Lauw et al. Nutrients. .

Abstract

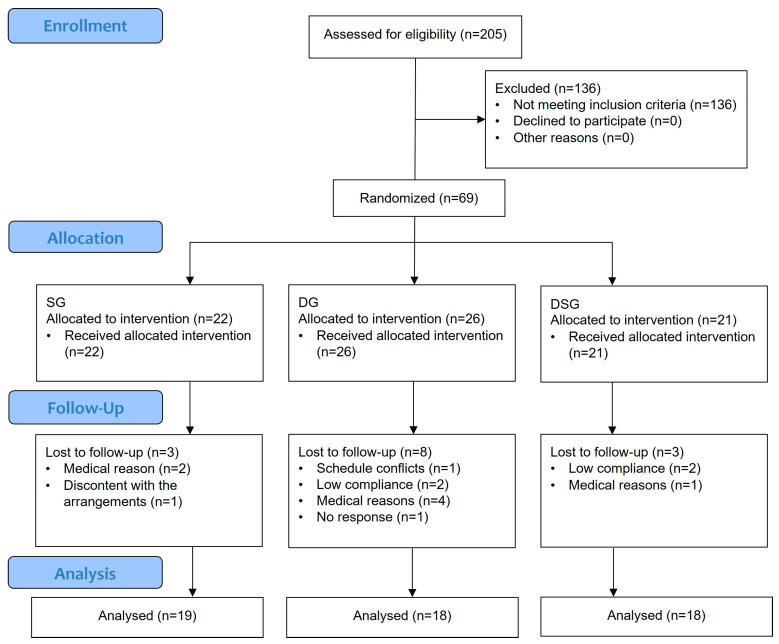
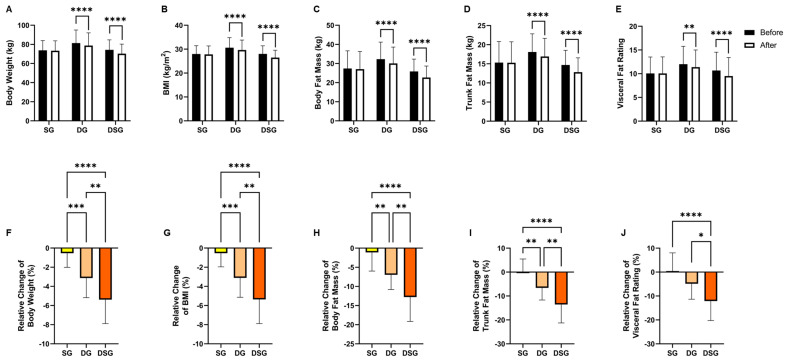
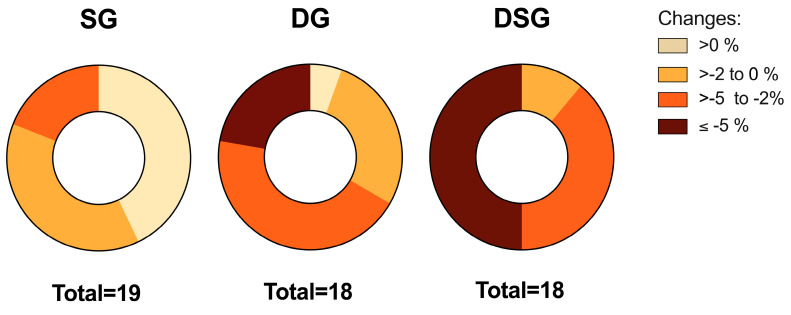
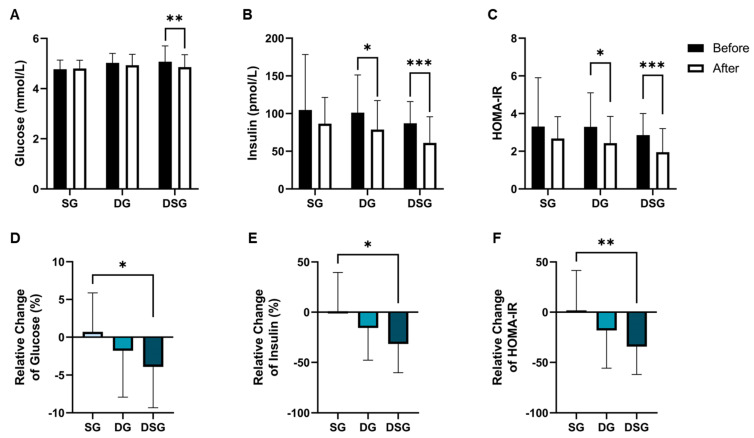
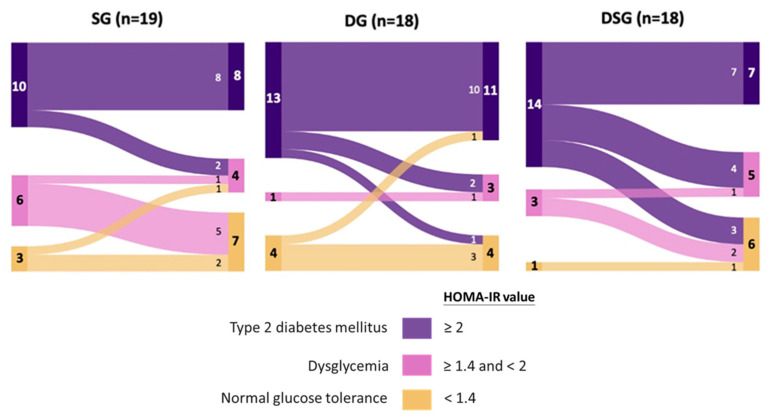
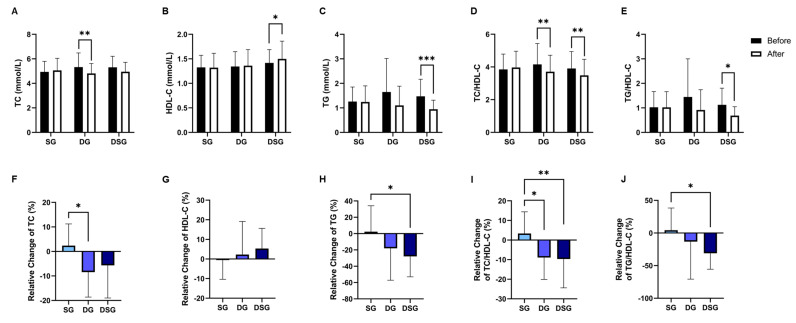
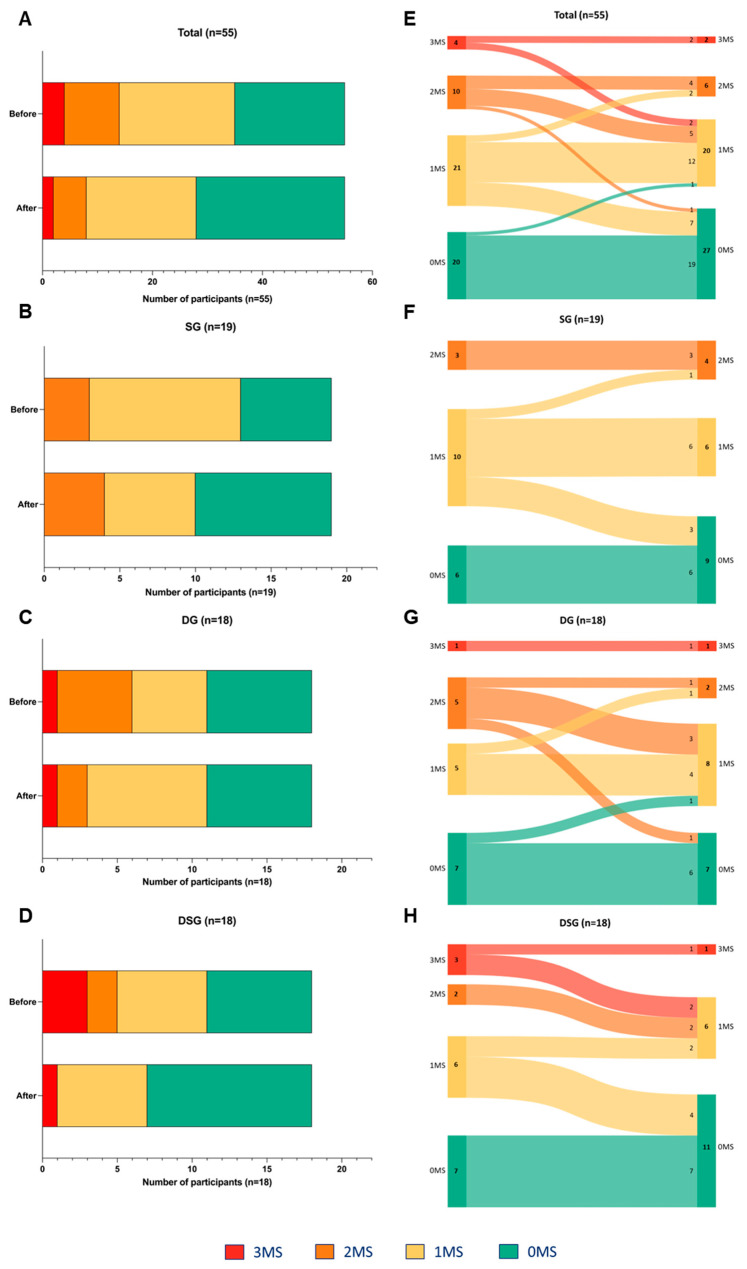
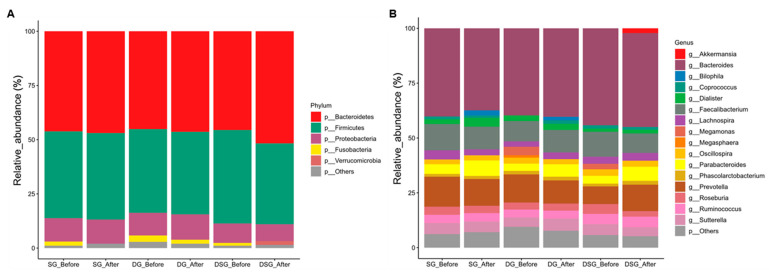
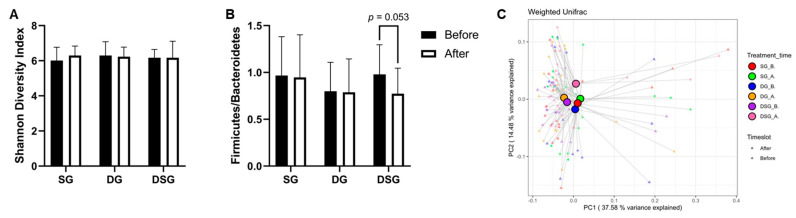
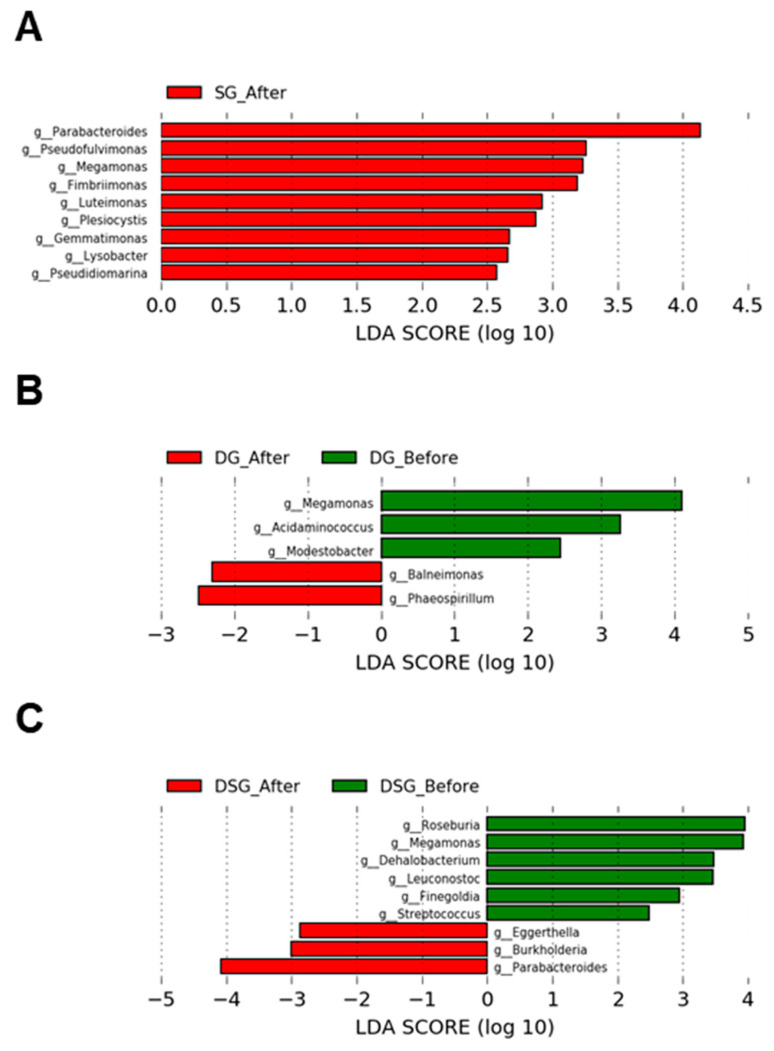
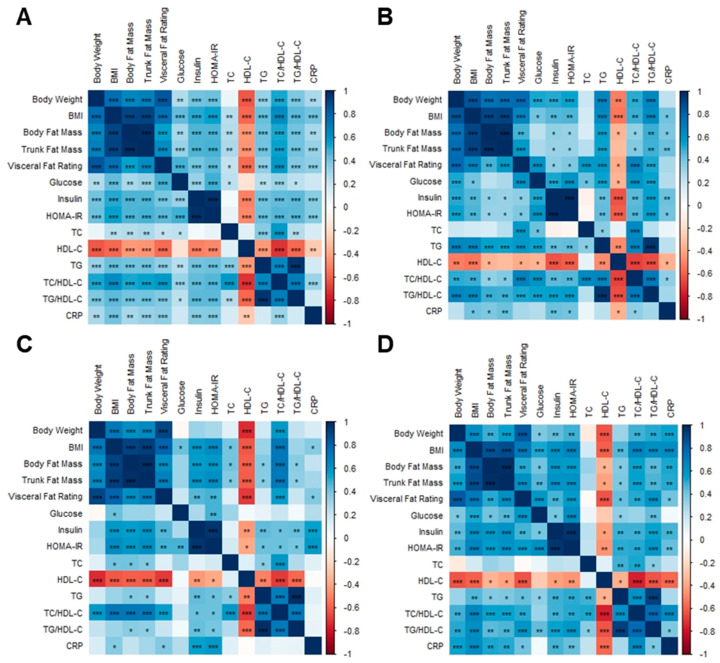
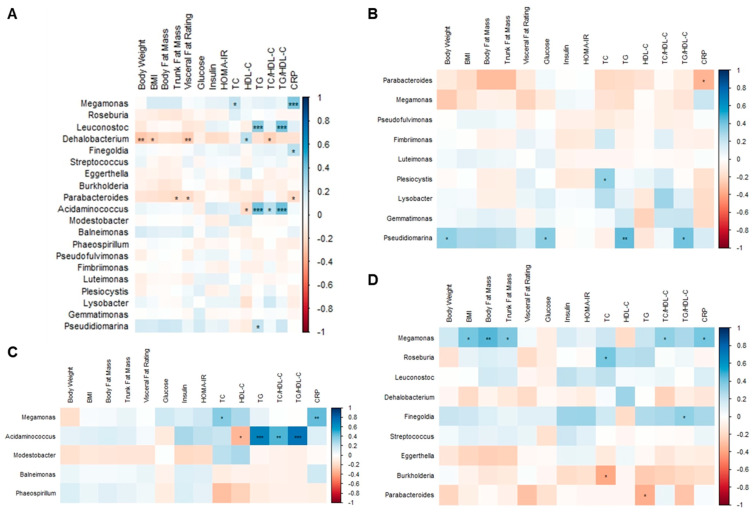
In view of the limited evidence showing anti-obesity effects of synbiotics via modulation of the gut microbiota in humans, a randomized clinical trial was performed. Assessment of the metabolic syndrome traits and profiling of the fecal gut microbiota using 16S rRNA gene sequencing in overweight and obese Hong Kong Chinese individuals before and after dietary intervention with an 8-week increased consumption of fruits and vegetables and/or synbiotic supplementation was conducted. The selected synbiotic contained two probiotics (Lactobacillus acidophilus NCFM and Bifidobacterium lactis HN019) and a prebiotic (polydextrose). Fifty-five overweight or obese individuals were randomized and divided into a synbiotic group (SG; n = 19), a dietary intervention group (DG; n = 18), and a group receiving combined interventions (DSG; n = 18). DSG showed the greatest weight loss effects and number of significant differences in clinical parameters compared to its baseline values-notably, decreases in fasting glucose, insulin, HOMA-IR, and triglycerides and an increase in HDL-cholesterol. DSG lowered Megamonas abundance, which was positively associated with BMI, body fat mass, and trunk fat mass. The results suggested that increasing dietary fiber consumption from fruits and vegetables combined with synbiotic supplementation is more effective than either approach alone in tackling obesity.

Keywords: diet; fruits and vegetables; gut health; gut microbiota; insulin resistance; metabolic syndrome; obesity; probiotics; synbiotics; weight loss.


Conflict of interest statement

The authors declare no conflict of interest.

Figures

Figure 1
Figure 1
CONSORT flow diagram.
Figure 2
Figure 2
Changes in anthropometric measures. (A) Body weight, (B) BMI, (C) body fat mass, (D) trunk fat mass, and (E) visceral fat rating before and after intervention. Relative change in (F) body weight, (G) BMI, (H) body fat mass, (I) trunk fat mass, and (J) visceral fat rating after intervention compared to baseline. Data are expressed as mean ± SD. Paired two-tailed t-test and one-way ANOVA followed by Tukey’s post hoc test were used for intragroup comparison and intergroup comparison, respectively. * p < 0.05, **: p < 0.01, ***: p < 0.001, ****: p < 0.0001.
Figure 3
Figure 3
Distribution of the relative change in body weight among groups.
Figure 4
Figure 4
Changes in glycemic parameters. (A) Fasting glucose, (B) fasting insulin, and (C) HOMA-IR before and after intervention. Relative change in (D) fasting glucose, (E) fasting insulin, and (F) HOMA-IR after intervention compared to baseline. Data are expressed as mean ± SD. Paired two-tailed t-test and one-way ANOVA followed by Tukey’s post hoc test were used for intragroup comparison and intergroup comparison, respectively. *: p < 0.05, **: p < 0.01, ***: p < 0.001. HOMA-IR: Homeostasis model assessment of insulin resistance.
Figure 5
Figure 5
Sankey diagrams showing the flow of homeostasis model assessment of insulin resistance (HOMA-IR) among participants after intervention.
Figure 6
Figure 6
Changes in lipid parameters. (A) TC, (B) HDL-C, (C) TG, (D) TC/HDL-C, and (E) TG/HDL-C before and after intervention. Relative change in (F) TC, (G) HDL-C, (H) TG, (I) TC/HDL-C, and (J) TG/HDL-C after intervention compared to baseline. Data are expressed as mean ± SD. Paired two-tailed t-test and one-way ANOVA followed by Tukey’s post hoc test were used for intragroup comparison and intergroup comparison, respectively. *: p < 0.05, **: p < 0.01, ***: p < 0.001. TC: total cholesterol; HDL-C: HDL-cholesterol; TG: triglycerides.
Figure 7
Figure 7
(A) Intragroup and (B) intergroup comparison of C-reactive protein (CRP). Data are expressed as mean ± SD. Paired two-tailed t-test and one-way ANOVA followed by Tukey’s post hoc test were used for intragroup and intergroup comparison, respectively.
Figure 8
Figure 8
Changes in the number of MetS traits among (A) all, (B) SG, (C) DG, and (D) DSG participants after intervention. Sankey diagrams showing the flow of MetS traits among (E) all, (F) SG, (G) DG, and (H) DSG participants after intervention. MS represents the MetS traits including abnormal fasting glucose, HDL-C, and TG levels.
Figure 9
Figure 9
Taxonomic composition of gut microbiota before and after intervention. Mean relative abundance (%) of (A) phyla and (B) genera before and after intervention. Relative abundance of phyla and genera with less than 1% are regarded as others.
Figure 10
Figure 10
Firmicutes-to-Bacteroidetes ratio (F/B), alpha-diversity, and beta-diversity before and after intervention. (A) F/B, (B) Shannon diversity index, and (C) principal coordinate analysis (PCoA) of gut microbiota structures.
Figure 11
Figure 11
LEfSe plots of genera before and after intervention in the (A) SG, (B) DG, and (C) DSG.
Figure 12
Figure 12
Associations between body composition parameters and metabolic biomarkers. (A) Overweight and obese Hong Kong Chinese individuals, (B) SG, (C) DG, and (D) DSG. Blue squares indicate positive correlations, and red squares indicate negative correlations. *: p < 0.05, **: p < 0.01, ***: p < 0.001.
Figure 13
Figure 13
Associations between body composition parameters, metabolic biomarkers, and gut microbiota at the genus level. (A) Overweight and obese Hong Kong Chinese individuals, (B) SG, (C) DG, and (D) DSG. Blue squares indicate positive correlations, and red squares indicate negative correlations. *: p < 0.05, **: p < 0.01, ***: p < 0.001.

References

    1. Ma S., Xi B., Yang L., Sun J., Zhao M., Bovet P. Trends in the prevalence of overweight, obesity, and abdominal obesity among Chinese adults between 1993 and 2015. Int. J. Obes. 2021;45:427–437. doi: 10.1038/s41366-020-00698-x. - DOI - PubMed
    1. Centre for Health Protection Obesity. [(accessed on 8 October 2022)]; Available online: https://www.chp.gov.hk/en/healthtopics/content/25/8802.html.
    1. Bluher M. Obesity: Global epidemiology and pathogenesis. Nat. Rev. Endocrinol. 2019;15:288–298. doi: 10.1038/s41574-019-0176-8. - DOI - PubMed
    1. Asia Pacific Cohort Studies Collaboration The burden of overweight and obesity in the Asia-Pacific region. Obes. Rev. 2007;8:191–196. doi: 10.1111/j.1467-789X.2006.00292.x. - DOI - PubMed
    1. Xie Y.J., Stewart S.M., Lam T.H., Viswanath K., Chan S.S. Television viewing time in Hong Kong adult population: Associations with body mass index and obesity. PLoS ONE. 2014;9:e85440. doi: 10.1371/journal.pone.0085440. - DOI - PMC - PubMed

Publication types