. 2023 Sep 26;23(19):8081.
doi: 10.3390/s23198081.

Modeling of Ammunition Dynamic Pressure Measurement Chain in Ballistic Tests

Affiliations

Modeling of Ammunition Dynamic Pressure Measurement Chain in Ballistic Tests

Caio Bittencourt Cardoso Felix et al. Sensors (Basel). .

Abstract

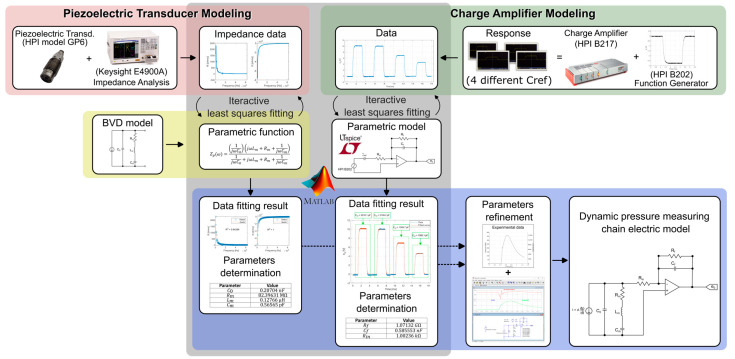
The use of piezoelectric transducers for internal dynamic pressure measurements in ammunition testing provides a significant advantage in the development and performance analysis of weapons and ammunition. Knowledge of the electrical characteristics of the dynamic pressure measurement chain, which includes the piezoelectric transducer and the charge amplifier, is a relevant condition for the design of interior ballistics pressure measurement systems. Thus, this study aims to characterize and model a piezoelectric transducer and its associated charge amplifier. First, the piezoelectric transducer was characterized using impedance analysis and modeled using a least squares curve-fitting tool, according to the Butterworth-Van Dyke model. Next, the charge amplifier was characterized through response analysis based on known inputs and modeled using LTSpice simulation techniques and the least squares curve-fit tool. Consequently, a measurement chain model is presented and simulated for two cases with different impulse signals. The first impulse signal was obtained from an interior ballistics computer simulation, and in the second case, it was considered the negative step signal characteristic of the calibration of piezoelectric transducers by means of dead weight. From the simulations, it was possible to verify the effectiveness of the model, which provided results with a low error in relation to the original pressure curve, and its applicability is demonstrated by the result of the simulation of the pressure variation in the calibration, where the attenuation of the signal can be visualized as the characteristic of the input curve changes.

Keywords: equivalent circuit; impedance analysis; interior ballistics; piezoelectric transducer; pressure measurement.


Conflict of interest statement

The authors declare no conflict of interest.

Figures

Figure 1
Figure 1
Test barrel with two transducer mounting ports for EPVAT test.
Figure 2
Figure 2
HPI GP6 pressure transducer and an example of use to measure internal barrel pressure of Imbel IA2 5.56 × 45 mm.
Figure 3
Figure 3
Measuring chain for pressure using a piezoelectric transducer: (a) pressure is converted to electric charge by the piezoelectric transducer; (b) electric charge is converted to voltage by the charge amplifier; (c) voltage is read by an oscilloscope; (d) knowing the sensibility of the piezoelectric transducer and the gain of the charge amplifier, pressure is computed. Adapted from [15].
Figure 4
Figure 4
Case mouth pressure-time variation in EPVAT test barrel for 7.62 × 51 mm NATO Ball ammunition: pressure can be obtained by dividing the measured charge by the transducer sensitivity (33 pC/MPa), considering a linear behavior.
Figure 5
Figure 5
Butterworth–Van Dyke electric model.
Figure 6
Figure 6
Fast Fourier Transform of the pressure-time signal shown in Figure 4.
Figure 7
Figure 7
Impedance measurement circuit: Auto-Balancing Bridge Method [27].
Figure 8
Figure 8
Charge amplifier electrical model.
Figure 9
Figure 9
Input curve generated from HPI B202 for characterization of the charge amplifier.
Figure 10
Figure 10
Instruments series connection: (a) function generator HPI B202; (b) reference capacitor; (c) charge amplifier HPI B217; and (d) oscilloscope.
Figure 11
Figure 11
Charge amplifier characterization routine.
Figure 12
Figure 12
Parameters refinement routine.
Figure 13
Figure 13
Modeling of dynamic pressure measuring chain.
Figure 14
Figure 14
Result of data fitting for BVD model: (a) resistance and (b) reactance.
Figure 15
Figure 15
Results of the series of data fitting for each reference capacitor, which compose the equivalent circuit modeling of the HPI B217 charge amplifier.
Figure 16
Figure 16
Result of the refinement of the parameters determined by means of the experimental data, and the calculated error.
Figure 17
Figure 17
Error calculated between experimental data and simulated data obtained with refined parameters.
Figure 18
Figure 18
Dynamic pressure measuring chain electrical model composed by piezoelectric transducer and charge amplifier.
Figure 19
Figure 19
Theoretical breech pressure-time curve for 7.62 × 51 mm NATO Ball ammunition in EPVAT test barrel.
Figure 20
Figure 20
Charge-time curve of PRODAS simulation and LTspice circuit model simulation, and calculated error between them.
Figure 21
Figure 21
Calculated error between charge-time curve of PRODAS simulation and LTspice circuit model simulation.
Figure 22
Figure 22
Input signal with different durations for calibration simulation.
Figure 23
Figure 23
Output signal with different durations originated with calibration simulation, focused on minimum charge values (RI).

References

    1. Curie J., Curie P. Développement Par Compression de l’électricité Polaire Dans Les Cristaux Hémièdres à Faces Inclinées. Bull. Société Minéralogique Fr. 1880;3:90–93. doi: 10.3406/bulmi.1880.1564. - DOI
    1. Thomson J.J. Piezo-Electricity and Its Applications. Engineering. 1919;107:543–544.
    1. Arnau A. In: Piezoelectric Transducers and Applications. Arnau Vives A., editor. Springer; Berlin/Heidelberg, Germany: 2004.
    1. Elkarous L., Nasri A., Nasri R. Numerical Modeling and Analysis of the Pressure Pulses Generator for the Dynamic Calibration of High-Pressure Transducers. Appl. Acoust. 2019;147:56–63. doi: 10.1016/j.apacoust.2018.04.015. - DOI
    1. Lavayssière M., Lefrançois A., Crabos B., Genetier M., Daudy M., Comte S., Dufourmentel A., Salsac B., Sol F., Verdier P., et al. Toward Improvements in Pressure Measurements for Near Free-Field Blast Experiments. Sensors. 2023;23:5635. doi: 10.3390/s23125635. - DOI - PMC - PubMed

LinkOut - more resources