

Synthesis of TiO2-(B) Nanobelts for Acetone Sensing
- PMID: 37837151
- PMCID: PMC10575087
- DOI: 10.3390/s23198322
Synthesis of TiO2-(B) Nanobelts for Acetone Sensing
Abstract
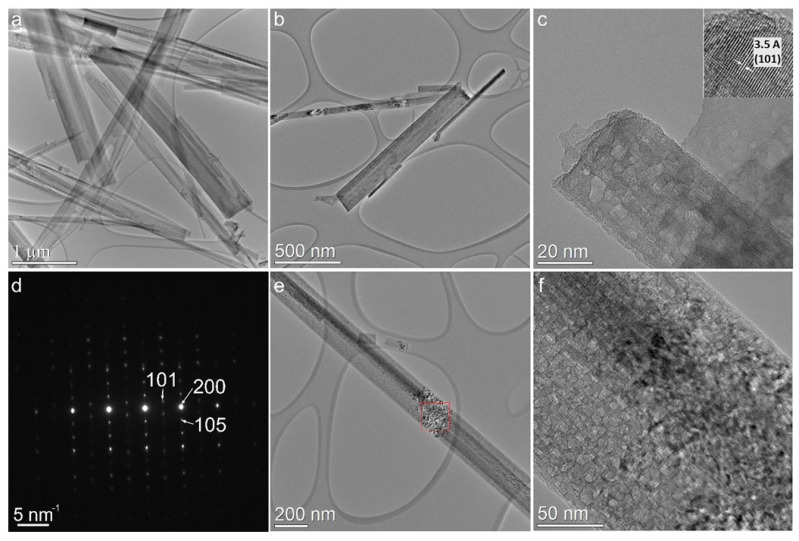
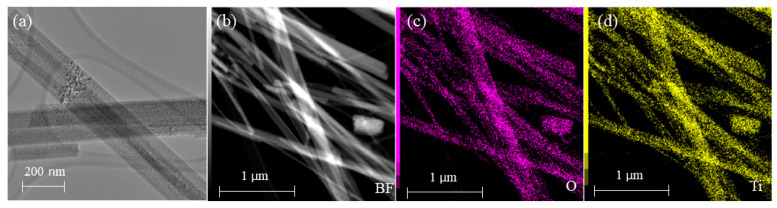
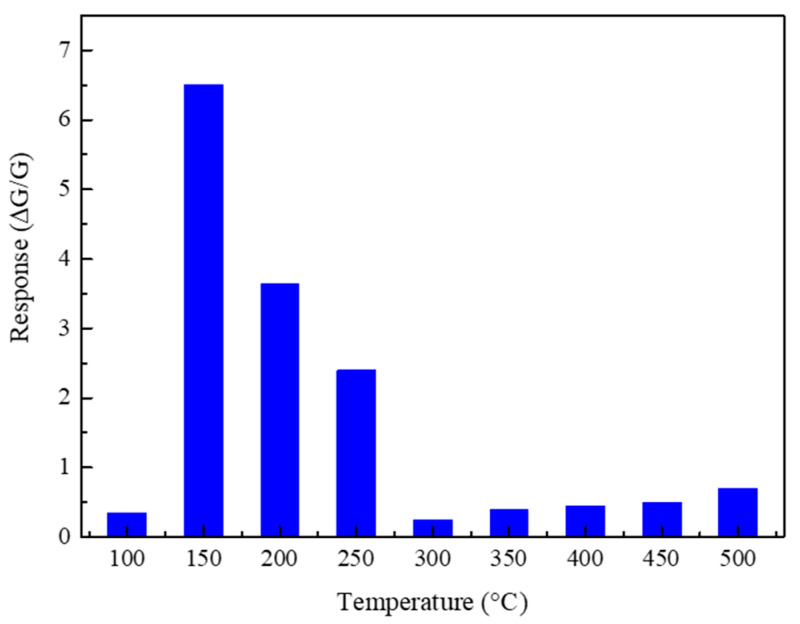
Titanium dioxide nanobelts were prepared via the alkali-hydrothermal method for application in chemical gas sensing. The formation process of TiO2-(B) nanobelts and their sensing properties were investigated in detail. FE-SEM was used to study the surface of the obtained structures. The TEM and XRD analyses show that the prepared TiO2 nanobelts are in the monoclinic phase. Furthermore, TEM shows the formation of porous-like morphology due to crystal defects in the TiO2-(B) nanobelts. The gas-sensing performance of the structure toward various concentrations of hydrogen, ethanol, acetone, nitrogen dioxide, and methane gases was studied at a temperature range between 100 and 500 °C. The fabricated sensor shows a high response toward acetone at a relatively low working temperature (150 °C), which is important for the development of low-power-consumption functional devices. Moreover, the obtained results indicate that monoclinic TiO2-B is a promising material for applications in chemo-resistive gas detectors.
Keywords: TiO2 nanobelts; acetone detection; chemical sensing; hydrothermal synthesis.
Conflict of interest statement
The authors declare no conflict of interest.
Figures


 —Na2Ti9O19. The oridinal Ramana spectra is shown in black and the fitted Ramana spectra is shown in Red. Whle other are the peak fitting corresponding to fitted spectra (Red).


References
-
- Staerz A., Weimar U., Barsan N. Current state of knowledge on the metal oxide based gas sensing mechanism. Sens. Actuators B Chem. 2022;358:131531.
-
- Li Q., Zeng W., Li Y. Metal oxide gas sensors for detecting NO2 in industrial exhaust gas: Recent developments. Sens. Actuators B Chem. 2022;359:131579.
-
- Tyagi S., Chaudhary M., Ambedkar A.K., Sharma K., Gautam Y.K., Singh B.P. Metal oxide nanomaterial-based sensors for monitoring environmental NO2 and its impact on the plant ecosystem: A Review. Sens. Diagn. 2022;1:106–129.
-
- Kumarage G.W.C., Comini E. Conductometric Gas Sensors. Encycl. Mater. Electron. 2023;1:564–580.
-
- Krishna K.G., Parne S., Pothukanuri N., Kathirvelu V., Gandi S., Joshi D. Nanostructured metal oxide semiconductor-based gas sensors: A comprehensive review. Sens. Actuators A Phys. 2022;341:113578.
Grants and funding
LinkOut - more resources
Full Text Sources
