. 2023 Nov;16(11):2161-2180.
doi: 10.1111/1751-7915.14354. Epub 2023 Oct 13.

Integrated genomics and phenotype microarray analysis of Saccharomyces cerevisiae industrial strains for rice wine fermentation and recombinant protein production

Affiliations

Integrated genomics and phenotype microarray analysis of Saccharomyces cerevisiae industrial strains for rice wine fermentation and recombinant protein production

Ye Ji Son et al. Microb Biotechnol. 2023 Nov.

Abstract

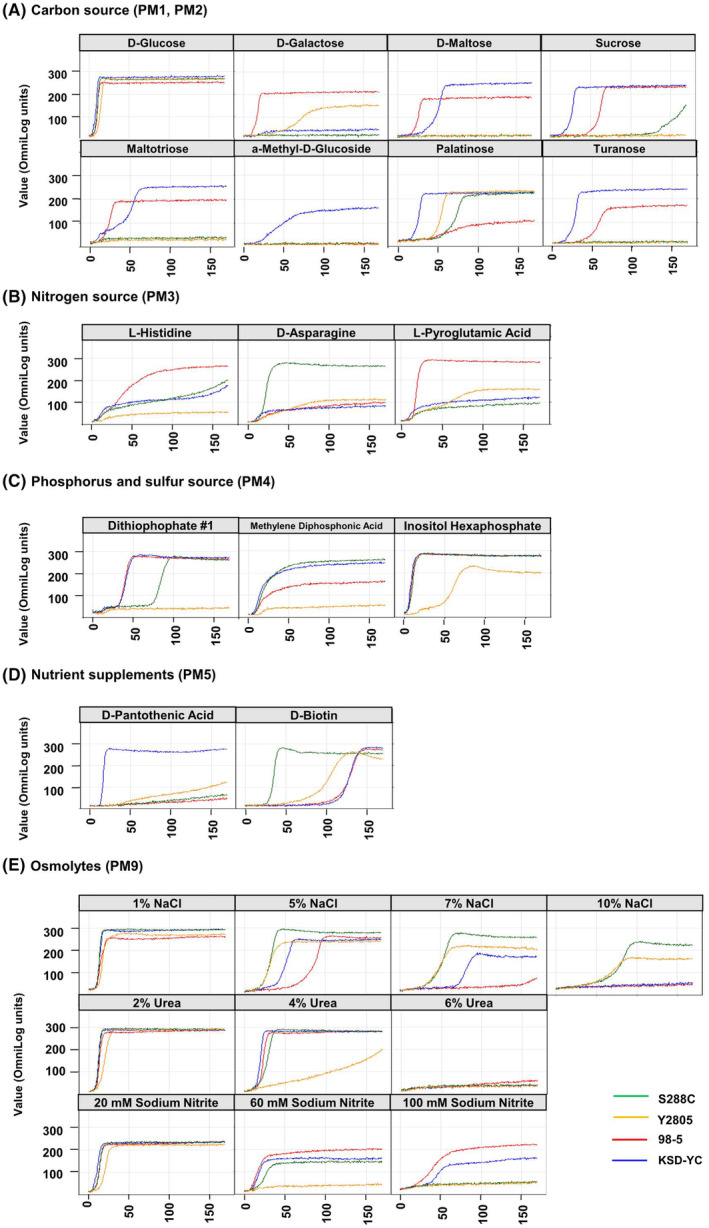
The industrial potential of Saccharomyces cerevisiae has extended beyond its traditional use in fermentation to various applications, including recombinant protein production. Herein, comparative genomics was performed with three industrial S. cerevisiae strains and revealed a heterozygous diploid genome for the 98-5 and KSD-YC strains (exploited for rice wine fermentation) and a haploid genome for strain Y2805 (used for recombinant protein production). Phylogenomic analysis indicated that Y2805 was closely associated with the reference strain S288C, whereas KSD-YC and 98-5 were grouped with Asian and European wine strains, respectively. Particularly, a single nucleotide polymorphism (SNP) in FDC1, involved in the biosynthesis of 4-vinylguaiacol (4-VG, a phenolic compound with a clove-like aroma), was found in KSD-YC, consistent with its lack of 4-VG production. Phenotype microarray (PM) analysis showed that KSD-YC and 98-5 displayed broader substrate utilization than S288C and Y2805. The SNPs detected by genome comparison were mapped to the genes responsible for the observed phenotypic differences. In addition, detailed information on the structural organization of Y2805 selection markers was validated by Sanger sequencing. Integrated genomics and PM analysis elucidated the evolutionary history and genetic diversity of industrial S. cerevisiae strains, providing a platform to improve fermentation processes and genetic manipulation.


Conflict of interest statement

We declare that we do not have any commercial or associative interest that represents a conflict of interest in connection with the work submitted.

Figures

FIGURE 1
FIGURE 1
Comparative single nucleotide polymorphism (SNP) and insertion or deletion (INDEL) detection in the whole genomes of S. cerevisiae KSD‐YC, 98‐5 and Y2805 strains. Each structural SNP and INDEL chromosome comparison was visualized in (A) S. cerevisiae Y2805 and S288C. (B) S. cerevisiae KSD‐YC and the sake yeast K7. (C) Each haplotype of S. cerevisiae 98‐5. Read mapping coverages, along with the numbers of SNPs and INDELs, were noted as a table. (D) Synteny analysis of the de novo assemblies of S. cerevisiae KSD‐YC, 98‐5 and Y2805 genomes with the reference S288C genome.
FIGURE 2
FIGURE 2
Phylogenetic tree construction with maximum likelihood. The 13 concatenated genes, including YPR152C, YJL099W, YJL057C, YJL051W, YKL068W, YML080W, YML056C, YNL161W, YNL125C, YOR133W, YAR042W, YBL052C and YBR163W, were used in the phylogenetic tree construction to classify S. cerevisiae at the strain level. The bootstrap values greater than 50% are shown at the branches. The groups of yeast strains are presented as a single model (JTT + F + I) based on the tree topology. The seven region types (Europe, Australia, Africa, Middle East, Asia, Malaysia and North America) and six source types (baking, wine, sake/ragi, huangjiu, bio‐EtOH and clinical) are represented as different coloured branches and strains, respectively. The structural features with the genomic distance between PAD1 and FDC1 are indicated on the right side. Non‐functional genes are represented by dotted arrows.
FIGURE 3
FIGURE 3
Chromosome structure analysis of S. cerevisiae KSD‐YC, 98‐5 and Y2805 strains. (A) Multiple comparative analysis of the whole genomes of the S. cerevisiae strains. The synteny blocks of chromosome XII of the S. cerevisiae strains were extended to compare the gene components around the rDNA cluster region. The space marked with a dotted line describes the absolute length or the interval of the gene, with the relative position of each gene block. (B) The location of the cluster of five genes conserved in the S. cerevisiae wine strains. Among the four S. cerevisiae strains, 98‐5 only showed the partial cluster of those genes in chromosomes IV and XVI. The genes with a premature stop codon and intact genes are displayed in red and blue, respectively.
FIGURE 4
FIGURE 4
Comparative analysis of the 4‐vinylguaiacol (4‐VG) bioconversion activity of S. cerevisiae strains. (A) Schematic representation of the PAD1 and FDC1 genes required for 4‐VG bioconversion in S. cerevisiae S288C, CEN.PK2‐1C, KSD‐YC, 98‐5 and Y2805 strains. The red lines, represents chromosomes, indicating the subteolomere location of the PAD1 and FDC1 genes on the right arm of chromosome IV. The information on the accession numbers of the PAD1 and FDC1 genes with the detected SNP/deletion is provided in Table S6. (B) Heatmap of 4‐VG production in S. cerevisiae strains through headspace‐solid‐phase microextraction with gas chromatography/mass spectrometry (HS‐SPME GS/MS). To test 4‐VG production capability, yeast cells were grown in YPD medium (1% yeast extract, 2% bacto peptone and 2% glucose) in the presence of 50 ppm ferulic acid, and samples were collected after 1, 2 and 3 days of incubation.
FIGURE 5
FIGURE 5
Phenotype microarray analysis of S. cerevisiae strains. Representative growth patterns of S. cerevisiae 98‐5 (red), KSD‐YC (blue), S288C (green) and Y2805 (yellow) strains on Biolog microplates. (A) Carbon source plate (PM1 and PM2), (B) Nitrogen source (PM3), (C) Phosphorus and sulphur source (PM4), (D) Nutrient supplements (PM5) and (E) Osmolytes (PM9), where the x‐ and y‐axis represent time in hours and Omnilog units, respectively. The Omnilog unit is a standard representation of respiration rate.
FIGURE 6
FIGURE 6
Schematic representation of structural and sequence features of S. cerevisiae Y2805 genetic markers validated by Sanger sequencing. (A) pep4::HIS3, (B) prb1‐Δ1.6R, (C) GAL2, (D) can1, (E) his3‐Δ200, (F) ura3‐52. The DNA fragments of the genotype marker genes were amplified by PCR from the total chromosomal DNAs, which were prepared by lysing the yeast cells with glass beads, using the gene‐specific primers (Table S2). The PCR products were directly subjected to sequencing or subcloned into a T vector (T‐Blunt™ PCR Cloning kit; SolGent, Daejeon, South Korea) before DNA sequencing by the dye‐terminator sequencing method.

References

    1. Akao, T. , Yashiro, I. , Hosoyama, A. , Kitagaki, H. , Horikawa, H. , Watanabe, D. et al. (2011) Whole‐genome sequencing of sake yeast Saccharomyces cerevisiae Kyokai no. 7. DNA Research, 18(6), 423–434. Available from: 10.1093/dnares/dsr029 - DOI - PMC - PubMed
    1. Ansmant, I. , Massenet, S. , Grosjean, H. , Motorin, Y. & Branlant, C. (2000) Identification of the Saccharomyces cerevisiae RNA:pseudouridine synthase responsible for formation of psi(2819) in 21S mitochondrial ribosomal RNA. Nucleic Acids Research, 28(9), 1941–1946. Available from: 10.1093/nar/28.9.1941 - DOI - PMC - PubMed
    1. Berlin, K. , Koren, S. , Chin, C.‐S. , Drake, J.P. , Landolin, J.M. & Phillippy, A.M. (2015) Assembling large genomes with single‐molecule sequencing and locality‐sensitive hashing. Nature Biotechnology, 33(6), 623–630. Available from: 10.1038/nbt.3238 - DOI - PubMed
    1. Bochner, B.R. (2003) New technologies to assess genotype–phenotype relationships. Nature Reviews Genetics, 4(4), 309–314. Available from: 10.1038/nrg1046 - DOI - PubMed
    1. Borneman, A.R. , Desany, B.A. , Riches, D. , Affourtit, J.P. , Forgan, A.H. , Pretorius, I.S. et al. (2011) Whole‐genome comparison reveals novel genetic elements that characterize the genome of industrial strains of Saccharomyces cerevisiae . PLoS Genetics, 7(2), e1001287. Available from: 10.1371/journal.pgen.1001287 - DOI - PMC - PubMed

Publication types