Review
. 2024 Jan;40(1):9-28.
doi: 10.1007/s44211-023-00442-1. Epub 2023 Oct 14.

Phase-separation multiphase flow: preliminary application to analytical chemistry

Affiliations
Review

Phase-separation multiphase flow: preliminary application to analytical chemistry

Kazuhiko Tsukagoshi. Anal Sci. 2024 Jan.

Abstract

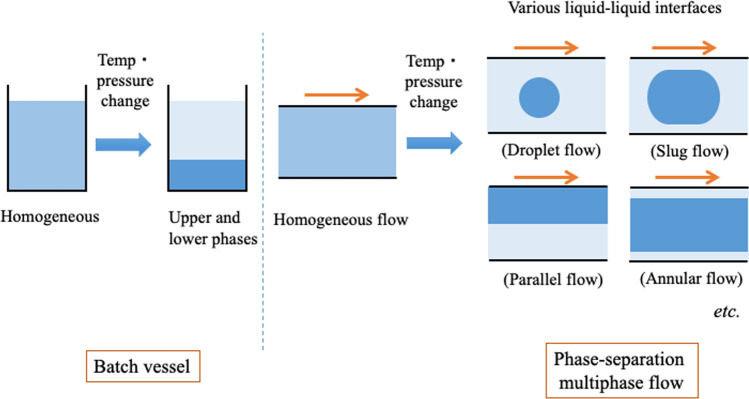
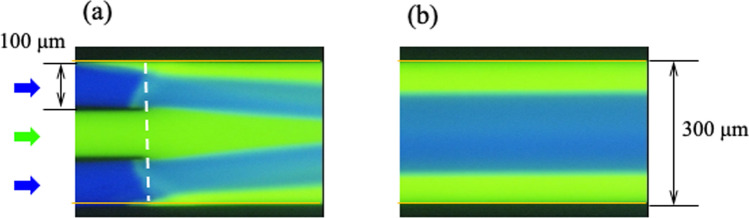
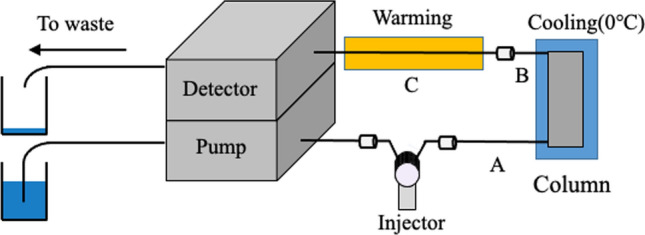
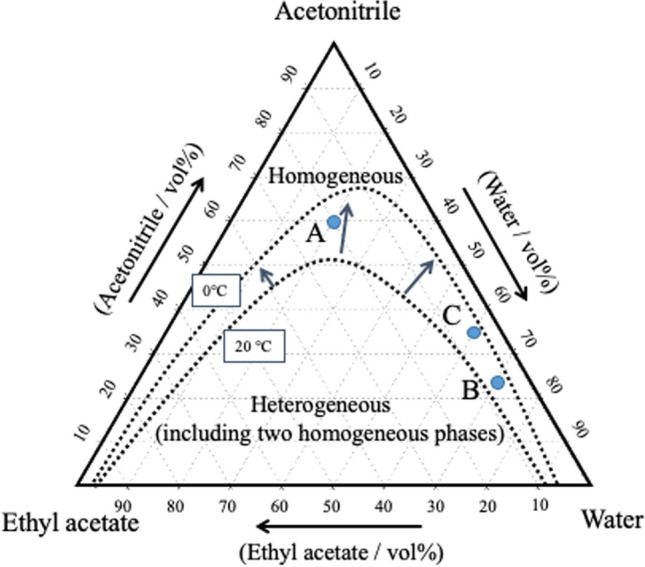
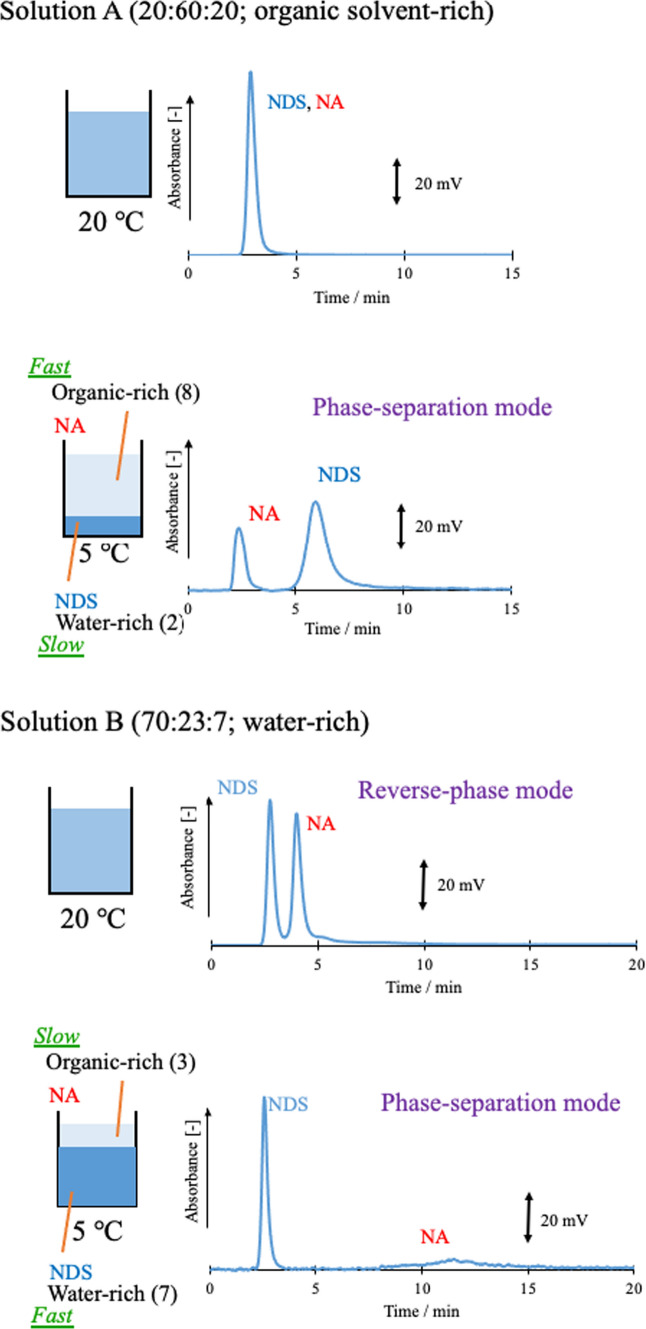
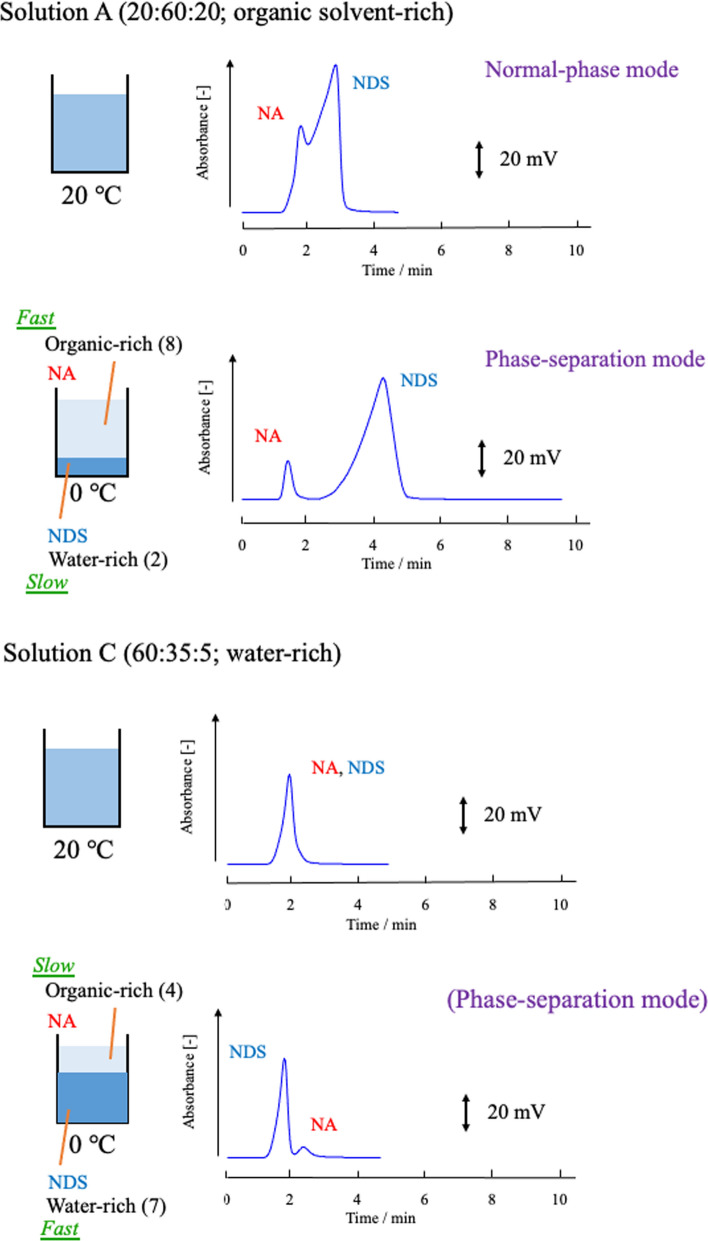
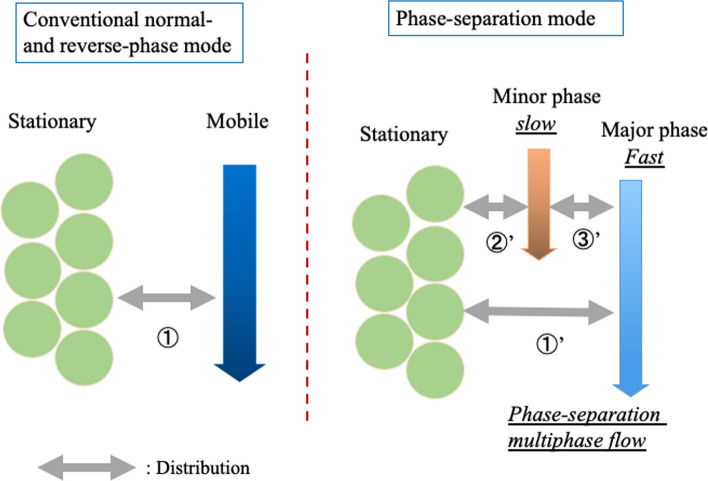
A two-phase separation mixed solution can undergo phase separation from one phase to two phases (i.e., upper and lower phases) in a batch vessel in response to changes in temperature and/or pressure. This phase separation is reversible. When the mixed solution undergoes a phase change while being fed into a microspace region, a dynamic liquid-liquid interface is formed, leading to a multiphase structure. This flow is called a phase-separation multiphase flow. Annular flow in a microspace, which is one such phase-separation multiphase flow, is interesting and has been applied to chromatography, extraction, reaction fields, and mixing. Here, research papers related to phase-separation multiphase flows-ranging from the discovery of the phenomenon to basic and technical research from the viewpoint of analytical science-are reviewed. In addition, the development of a new separation mode in a high-performance liquid chromatography system based on phase-separation multiphase flow is introduced.

Keywords: High-performance liquid chromatography (HPLC); Phase-separation mode; Phase-separation multiphase flow; Tube radial distribution chromatography (TRDC); Tube radial distribution extraction (TRDE); Tube radial distribution flow (TRDF); Tube radial distribution mixing (TRDM); Tube radial distribution reaction (TRDR).


Figures

Fig. 1
Fig. 1
Phase-separation multiphase flow [1]
Fig. 2
Fig. 2
Schematic of a fluorescence microscope CCD camera and the transformation of a fluorescence photograph to a fluorescence profile through the computer. Reproduced from Ref. [21] with permission
Fig. 3
Fig. 3
Phase diagram for water–acetonitrile–ethyl acetate mixed solution, including the solubility curves at 20 °C and 0 °C and fluorescence photographs of TRDF in the microchannel (100 µm wide). Flow rate is 1.0 μL min−1 [21, 24]
Fig. 4
Fig. 4
Fluorescence photographs of TRDF in the meandering microchannel. The flow rate is 2.0 μL min−1. Reproduced from Ref. [49] with permission
Fig. 5
Fig. 5
TRDF image of an ionic liquid–water mixed solution consisting of [C4mim]Cl and NaOH, as obtained with a bright-field microscope CCD camera system. Nos. 1–5 are as follows: (No. 1) [C4mim]Cl:NaOH, 48:6 w/w %; (No. 2) 32:8; (No. 3) 25:10; (No. 4) 20:13; and (No. 5) 13:20. Conditions: capillary tube, 120 cm length (effective length: 100 cm) and 75 µm i.d. fused silica; rhodamine B concentration, 5 mM; tube temperature, 15 °C; and flow rate, 1.0 µL min−1. Reproduced from Ref. [53] with permission
Fig. 6
Fig. 6
Computer simulated cross-sectional images of TRDC. a Water–acetonitrile–ethyl acetate mixed solution (3:8:4, volume ratio; organic solvent-rich) and b (4:3:1, volume ratio; water-rich). Reproduced from Ref. [58] with permission
Fig. 7
Fig. 7
Schematic of an open-tubular capillary chromatography (TRDC system). Reproduced from Ref. [21] with permission
Fig. 8
Fig. 8
Illustration of the separation performance in a capillary tube. a Organic solvent-rich carrier solution and b water-rich carrier solution. Reproduced from Ref. [21] with permission
Fig. 9
Fig. 9
Chromatogram of a mixture analyte solution, as obtained by the TRDC system. Conditions: Capillary tube, 120 cm (effective length from the inlet: 100 cm) of 75 µm i.d. fused silica; carrier, water–acetonitrile–ethyl acetate (3:8:4 v/v/v) mixture solution; sample injection, 20 cm height (gravity) × 30 s; flow rate, 0.8 µL min−1; temperature, 20 °C; and 1-naphthol, 1-naphthalenesulfonic acid, and 2,6-naphthalenedisulfonic acid, 1 mM, 1,3,6-naphthalenetrisulfonic acid, 2.0 mM, and eosin Y, 0.1 mM. Reproduced from Ref. [60] with permission
Fig. 10
Fig. 10
Fluorescence photographs of solvents containing dissolved fluorescence dyes at the microchannel in a microchip. Conditions: carrier for C1, water–acetonitrile (3:2 volume ratio) containing 1.0 mM eosin Y; carrier for C2 and C3, acetonitrile–ethyl acetate (3:2 volume ratio) containing 0.1 mM perylene; flow rate, 20 µL min−1 for C1 and 4.0 µL min−1 for C2 and C3; volume ratio of water–acetonitrile–ethyl acetate in the wide channel, approximately 20:53:27; temperature, 25 °C (room temperature). Reproduced from Ref. [96] with permission
Fig. 11
Fig. 11
Consecutive chromatograms obtained by the TRDC system for various concentrations (two measurements) and mixed analytes (four analytes): a 1-naphthol, b 2,6-naphthalenedisulfonic acid, c 1-naphthalenesulfonic acid, and d 1,3,6-naphthalenetrisulfonic acid. Eluent, water–acetonitrile–ethyl acetate mixed solution (3:8:4, volume ratio); flow rate, 2.0 μL min−1; analyte injection volume, 0.2 μL; cooling temperature, 5 °C; and detection wavelength, 254 nm. Reproduced from Ref. [101] with permission
Fig. 12
Fig. 12
Bright-field photographs at the tip of the smaller capillary tube (75 µm i.d.) within the larger tube (200 µm i.d.) at 34 °C. The homogeneous aqueous solution containing 12 wt% Triton X-100, 2.4 M KCl, and 5 mM rhodamine B was fed at a flow rate of 20 µL min−1 into the larger capillary tube. Reproduced from Ref. [107] with permission
Fig. 13
Fig. 13
Bright-field images of microfluidic flow in a Y-type micro-channel (100 µm wide and 40 µm deep) for solution (PEG 10.0 wt% and dextran 10.0 wt%) containing 0.1 mM rhodamine B at 40 °C and at flow rate of 5.0 µL min−1. a Equal pressure loss and b unequal pressure loss in the separated Y-type channels. Reproduced from Ref. [45] with permission
Fig. 14
Fig. 14
Relationship between the migration times and the fluorescence intensities in the micro-flow reaction (TRDR) system as well as between the reaction time and the fluorescence intensity in the batch reaction system [108]. The solutions included 8.3 µM BSA and 0.67 mM FR for derivatization in the systems. TRDR system (water–acetonitrile–ethyl acetate; 1:2:1 volume ratio) at 7.5, 12, and 15 µL min−1 and batch reaction system (water–acetonitrile; 1:2 volume ratio). Reproduced from Ref. [108] with permission
Fig. 15
Fig. 15
Fluorescence photographs of the solvents with the dissolved fluorescent dyes at a the combining point of the channels and b 3 cm from the combining point in a wide channel. The white dashed line indicates the combining point between the narrow channel and wide channel. Conditions: carrier, water–acetonitrile (3:2, volume ratio) containing 3.0 mM eosin Y in a center narrow channel and acetonitrile–ethyl acetate (3:2, volume ratio) containing 0.15 mM perylene in side narrow channels; flow rate, 2.0 µL min−1 for narrow channels. The volume ratio of water–acetonitrile–ethyl acetate in the wide channel is 3:8:4. Reproduced from Ref. [109] with permission
Fig. 16
Fig. 16
Schematic of the present HPLC system. A PEEK tube of 100 μm i.d. and 40 cm length; B PEEK tube of 130 μm i.d. and 40 cm length; and C fused silica capillary of 250 μm i.d. and 200 cm length. Analytical conditions for NDS and NA: eluent, water–acetonitrile–ethyl acetate mixed solution; flow rate, 100 μL min−1; injection volume, 20 μL; analyte concentration, 0.5 mM, and column temperature, 0 °C; and detection wavelength, 254 nm. Reproduced from Ref. [114] with permission
Fig. 17
Fig. 17
Phase diagram for water–acetonitrile–ethyl acetate mixed solution including the solubility curves at 20 °C and 0 °C. A (20:60:20, water–acetonitrile–ethyl acetate volume ratio), B (70:23:7), and C (60:35:5). Reproduced from Refs. [114, 115] with permission
Fig. 18
Fig. 18
Effect of phase-separation mode on chromatograms. ODS column (Shim-pack HT-ODS; Shimadzu, Kyoto, Japan: particle type, nonporous silica base; material: octadecyl-modified silica (ODS); particle diameter, 2 µm; column size, 30 mm length × 4.6 mm inner diameter). Solution A (organic solvent-rich) and Solution B (water-rich). Reproduced from Ref. [114] with permission
Fig. 19
Fig. 19
Effect of phase-separation mode on chromatograms. Silica column (Shim-pack XR-SIL; Shimadzu, Kyoto, Japan: Particle type, spherical, porous, high-purity silica particles; particle diameter, 2.2 µm; pore size, 12 nm; and column size, 50 mm length × 2.0 mm inner diameter). Solution A (organic solvent-rich) and Solution C (water-rich). Reproduced from Ref. [115] with permission
Fig. 20
Fig. 20
Images of the separation mechanism of the phase-separation mode and the conventional normal- and reversed-phase modes in HPLC. Reproduced from Ref. [115] with permission

References

    1. Tsukagoshi K. Kagaku. 2016;71:74.
    1. Tsukagoshi K. Bunrigijutsu. 2019;49:24.
    1. Reuss FF. Proc. Imp. Soc. Nat. Moscow. 1809;2:327.
    1. Hagen G. Ann. Phys. Chem. 1839;46:423. doi: 10.1002/andp.18391220304. - DOI
    1. Poiseuille JLR. C R. 1841;11:961.

LinkOut - more resources