. 2023 Nov;299(11):105349.
doi: 10.1016/j.jbc.2023.105349. Epub 2023 Oct 12.

Biophysical characterization of chloride intracellular channel 6 (CLIC6)

Affiliations

Biophysical characterization of chloride intracellular channel 6 (CLIC6)

Veronica Loyo-Celis et al. J Biol Chem. 2023 Nov.

Abstract

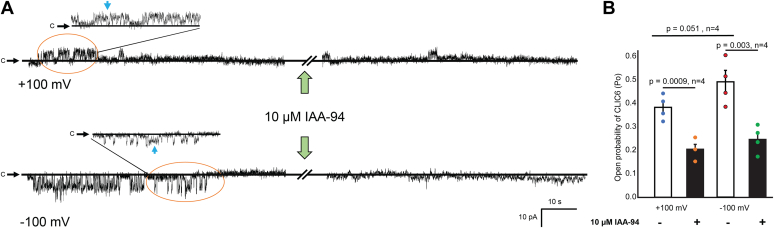
Chloride intracellular channels (CLICs) are a family of proteins that exist in soluble and transmembrane forms. The newest discovered member of the family CLIC6 is implicated in breast, ovarian, lung gastric, and pancreatic cancers and is also known to interact with dopamine-(D(2)-like) receptors. The soluble structure of the channel has been resolved, but the exact physiological role of CLIC6, biophysical characterization, and the membrane structure remain unknown. Here, we aimed to characterize the biophysical properties of this channel using a patch-clamp approach. To determine the biophysical properties of CLIC6, we expressed CLIC6 in HEK-293 cells. On ectopic expression, CLIC6 localizes to the plasma membrane of HEK-293 cells. We established the biophysical properties of CLIC6 by using electrophysiological approaches. Using various anions and potassium (K+) solutions, we determined that CLIC6 is more permeable to chloride-(Cl-) as compared to bromide-(Br-), fluoride-(F-), and K+ ions. In the whole-cell configuration, the CLIC6 currents were inhibited after the addition of 10 μM of IAA-94 (CLIC-specific blocker). CLIC6 was also found to be regulated by pH and redox potential. We demonstrate that the histidine residue at 648 (H648) in the C terminus and cysteine residue in the N terminus (C487) are directly involved in the pH-induced conformational change and redox regulation of CLIC6, respectively. Using qRT-PCR, we identified that CLIC6 is most abundant in the lung and brain, and we recorded the CLIC6 current in mouse lung epithelial cells. Overall, we have determined the biophysical properties of CLIC6 and established it as a Cl- channel.

Keywords: IAA-94; anion transport; chloride channel; pH-regulation; redox-regulation.


Conflict of interest statement

Conflict of interest The authors declare that they have no conflicts of interest with the contents of this article.

Figures

Figure 1
Figure 1
Characterization of CLIC6 in HEK-293 cells.A, HEK-293 cells transfected with CLIC6 were labeled with DAPI (blue, nucleus marker), wheat germ agglutinin (red, plasma membrane marker), and anti-FLAG (for FLAG-CLIC6, green, 1:500, Sigma Aldrich (F1804)). Anti-mouse Alexa 488 was used to label CLIC6 protein. Merge show overlay of DAPI-WGA and anti-FLAG fluorescent images. Yellow arrows indicate the expression of FLAG-CLIC6 at the plasma membrane in transfected cells. Bar scale:10 μm. Western blot with anti-FLAG [1:500, Sigma Aldrich (F1804)] showing FLAG-tagged CLIC6 in transfected HEK-293 cells. The orange arrow indicates FLAG-CLIC6 migrates at ∼120 kDa. B, fluorescent image showing transfected cells (CLIC6 co-transfected with GFP, green) attached to a patch pipette. The composition of the bath (extracellular) and pipette (intracellular) solution is given. C, biophysical and pharmacological characterization of the CLIC6 current. Voltage pulses were applied from −100 to +100 mV in 20 mV increments (holding potential of −40 mV, step duration 1000 ms). Representative trace of whole-cell recordings of CLIC6 expressed in HEK-293 cells before (top) and after adding 10 μM of IAA-94 (bottom). D, voltage-dependence of CLIC6. Current-voltage (I-V) plot of the recordings is shown in C. The CLIC6 current was measured at 40 ms after voltage steps are applied and normalized to cell capacitance. Current–voltage plot after the addition of 10 μM of IAA-94 (black circle). The reversal potential calculated from the I-V plot was −40 mV. Cl currents saturate at higher voltages (≥80 mV). E, bar graph representing peak amplitude at +100 mV for CLIC6 in the absence (white) and presence (black) of 10 μM IAA-94. IAA-94 blocked a large proportion of the CLIC6 currents (p = 0.062, n = 4). F, G–V plot for CLIC6. The conductance G [calculated from ICl/(E-ECl)] was plotted as a function of voltage. Solid line fit to the Boltzmann function. G, the tail currents of CLIC6 (in different colors) in enhanced detail from −100 mV to +100 mV before and after the addition of 10 μM IAA-94. Blue traces are the tail current from +40 to +100 mV. H, the tail current as a function of membrane potential was obtained by analyzing the tail current peak at 1.025s (time in which the maximum tail current is without having contamination with the capacitive component) before and after the addition of 10 μM IAA-94. Solid line fit to the Boltzmann function. I, composition of extracellular and intracellular solutions used in electrophysiological recordings with SyncroPatch 384i. Representative trace of CLIC6 expressed in HEK-293 cells recorded in whole-cell configuration with automated patch clamp system. J, current–voltage curve obtained for 13 cells recorded from automated patch clamp system. Error bars represent the mean ± standard deviation (SD), and significance was calculated by student’s t test (paired). CLIC, Chloride intracellular channel.
Figure 2
Figure 2
Single-channel current is blocked by IAA-94.A, single-channel recordings under control conditions (135/130 mM NMDG-Cl; cis/trans) at +100 mV (top) and −100 mV (bottom) and immediately after the addition of 10 μM IAA-94 in the bath solution. The green arrow indicates the addition of IAA-94, and solid black lines represent the closed levels (c). Inset shows an enlarged image of CLIC6 recording for a short duration. Blue arrows indicate the substate level at 50% of the main opening. Note the reduction in the single-channel activity of CLIC6 after the addition of 10 μM IAA-94 at +100 mV and −100 mV. The data were filtered at 20 kHz and sampled at 40 kHz. All the current traces in this figure are from the same patch. B, bar graph of the average of normalized CLIC6 open probability (Po) of CLIC6 at +100 mV and −100 mV (n = 4). IAA-94 significantly blocked the CLIC6-mediated Cl currents at +100 mV by 53 ± 4% (p = 0.0009, n = 4) and 51 ± 5% at −100 mV (p = 0.003, n = 4). The difference between Po at −100 and +100 mV in absence of IAA-94 was (p = 0.051, n = 4). Error bars represent the mean ± standard deviation (SD), and significance was calculated by Students’ t test (paired). CLIC, Chloride intracellular channel.
Figure 3
Figure 3
CLIC6 forms a Cl-selective channel. The effect of changing the external anion composition for CLIC6 was analyzed by whole-cell patch-clamp. A, voltage-step protocol. B, recording solutions were kept constant in the pipette, but external anions were replaced from Cl to Br or F. C, representative whole-cell recordings for HEK-293 cells transfected with CLIC6 under different anions in the bath solution. D, voltage-dependence of the instantaneous current amplitudes normalized to HEK-293 cells capacitance in standard external solution (135 mM Cl, open circle) and from the same cell after the extracellular solution has been changed to 135 mM Br (gray circle) and 135 mM F (black circle). Data were fit to the Boltzmann function and shown with a solid line. Permeability ratios were determined using data from D by solving the Goldman–Hodgkin–Katz equation (n = 5 independent experiments). CLIC, chloride intracellular channel.
Figure 4
Figure 4
Effect of pH on CLIC6 currents. External acidification (pH 6.2) decreases rectifying chloride current in HEK-293 cells transfected with CLIC6. A, voltage-step protocol. B, recording solutions were kept constant in the pipette, but the pH was acidified from 7.2 to 6.2. C, representative trace from whole-cell patch-clamp recordings performed on HEK-293 cells transfected with CLIC6 and bathed in NMDG-Cl solution at pH 7.2 (top). The whole-cell currents were blocked after the addition of 10 μM IAA-94. D, lowering pH to 6.2 decreased Cl currents in HEK-293 cells transfected with CLIC6. The addition of 10 μM IAA-94 had no impact on the whole-cell current. E, the representative traces from HEK-293 cells transfected with the mutant CLIC6H648A and bathed in NMDG-Cl solution at pH 7.2 before (top) and after the addition of 10 μM IAA-94 (bottom), there was no change in the whole-cell current. F, HEK-293 cells expression CLIC6H648A at pH 6.2 showed no change in whole cell currents on the addition of 10 μM IAA-94. G, current density (pA/pF) bar graphs of HEK-293 cells transfected with CLIC6 and CLIC6H648A before and after adding 10 μM IAA-94 at pH = 7.2 (p = 0.01, n = 10 and p = 0.36, n = 5 respectively) and 6.2 (p = 0.18, n = 5 and p = 0.34, n = 5, respectively). Error bars represent the mean ± standard deviation (SD), and significance was calculated by ANOVA (1-way). CLIC, chloride intracellular channel.
Figure 5
Figure 5
DTT regulates the activity of CLIC6. Effect of dithiothreitol (DTT) and hydrogen peroxide (H2O2) on the activity of CLIC6 in whole-cell patches in HEK-293 cells transfected with CLIC6 at pH 7.2. A, representative recordings of CLIC6 under control conditions and after addition of 1 mM DTT. B, representative recordings of CLIC6 C487A mutant under control conditions and after addition of 1 mM DTT. C, representative traces of CLIC6 under control conditions and after the addition of 10 μM H2O2. D, current–voltage relationship of CLIC6 under control and 1 mM DTT. Inset is a bar graph representing peak current at +100 mV. Significant difference from control after the addition of 1 mM DTT (p =0.0001, n = 4). E, current–voltage curve of CLIC6 C487A mutant (p = n.s, n = 3), under control and after the addition of 1 mM DTT. Inset showing a bar graph of peak current at +100 mV with and without DTT for CLIC6 C487A mutant. There was no impact of DTT on the activity of the CLIC6 C487A mutant. F, curve–voltage plots for CLIC6 with (orange circle) and without (white circle) 10 μM H2O2. Inset representing peak current at +100 mV for CLIC6 in the presence (orange) and absence (white) of 10 μM H2O2 (p = n.s, n = 3). Error bars represent the mean ± standard deviation (SD), and significance was calculated by Students’ t test (paired). CLIC, Chloride intracellular channel.
Figure 6
Figure 6
Functional expression of CLIC6 in MLE cells.A, organ-specific mRNA expression of clic6. mRNA was isolated from brown fat (BAT), brain, heart, kidney, liver, lung, soleus muscle, and spleen of 2 months old mice. Representative graphs of relative expression, and quantification of clic6 mRNA. Expression of clic6 was normalized to beta-actin (housekeeping gene) where the expression was found to be highest in the lungs followed by the brain, kidney, and soleus muscle. B, RNA was isolated from MLE cells either untreated or treated for 48 h with CLIC6shRNA. Expression of CLIC6 was analyzed by qPCR. We did not detect any significant signal in MLE cells treated with CLIC6 shRNA. C, voltage-step protocol used for MLE cells and MLE cell (bar scale:10 μm) attached to the patch pipette for recording Cl currents. Representative trace of CLIC6 current recording in MLE cells before (top panel) and after adding 10 μM of IAA-94 (bottom panel). D, voltage-step protocol and MLE cell (attached to a patch pipette) transduced with lentivirus (red cell expressing the fluorescent reporter). The representative recordings of MLE cells (transduced with lentivirus) before (top) and after adding 10 μM of IAA-94 (bottom). The Cl channel kinetics were different from wildtype MLE cells. MLE cells lacking CLIC6 lacked the slow Cl kinetics component. E, current–voltage plot of the recordings presented in panel C. The orange arrows indicate the time point (120 ms) at which the current was measured for the I-V plot. The current was normalized to the MLE cell capacitance. F, current–voltage plot of the recordings presented in panel D for MLE cells lacking CLIC6. G, current density at +100 mV before and after the addition of 10 μM IAA-94 in MLE cells (p = 0.02, n = 5). H, current density at +100 mV before and after the addition of 10 μM IAA-94 in MLE cells transfected with lentivirus (p = n.s, n = 3). Error bars represent the mean ± standard deviation (SD), and significance was calculated by students’ t test (paired). CLIC, chloride intracellular channel; MLE, mouse lung epithelial.
Figure 7
Figure 7
Model of CLIC6 in the cell membrane and its regulation. Our results indicate that CLIC6 forms a Cl-selective channel in the cell membrane. The activity of CLIC6 is blocked by IAA-94. The channel can be activated by membrane depolarization, neutral pH, and high redox potential (DTT). CLIC, chloride intracellular channel.

References

    1. Verkman A.S., Galietta L.J.V. Chloride transport modulators as drug candidates. Am. J. Physiol. Cell Physiol. 2021;321:C932–C946. - PMC - PubMed
    1. Jentsch T.J., Stein V., Weinreich F., Zdebik A.A. Molecular structure and physiological function of chloride channels. Physiol. Rev. 2002;82:503–568. - PubMed
    1. Duran C., Thompson C.H., Xiao Q., Hartzell H.C. Chloride channels: often enigmatic, rarely predictable. Annu. Rev. Physiol. 2010;72:95–121. - PMC - PubMed
    1. Gururaja Rao S., Patel N.J., Singh H. Intracellular chloride channels: novel biomarkers in Diseases. Front. Physiol. 2020;11:96. - PMC - PubMed
    1. Gururaja Rao S., Ponnalagu D., Patel N.J., Singh H. Three decades of chloride intracellular channel proteins: from organelle to organ physiology. Curr. Protoc. Pharmacol. 2018;80:11.21.11–11.21.17. - PMC - PubMed

Publication types

LinkOut - more resources