. 2023 Oct 14;14(1):6478.
doi: 10.1038/s41467-023-42208-3.

Automated imaging and identification of proteoforms directly from ovarian cancer tissue

Affiliations

Automated imaging and identification of proteoforms directly from ovarian cancer tissue

John P McGee et al. Nat Commun. .

Erratum in

Abstract

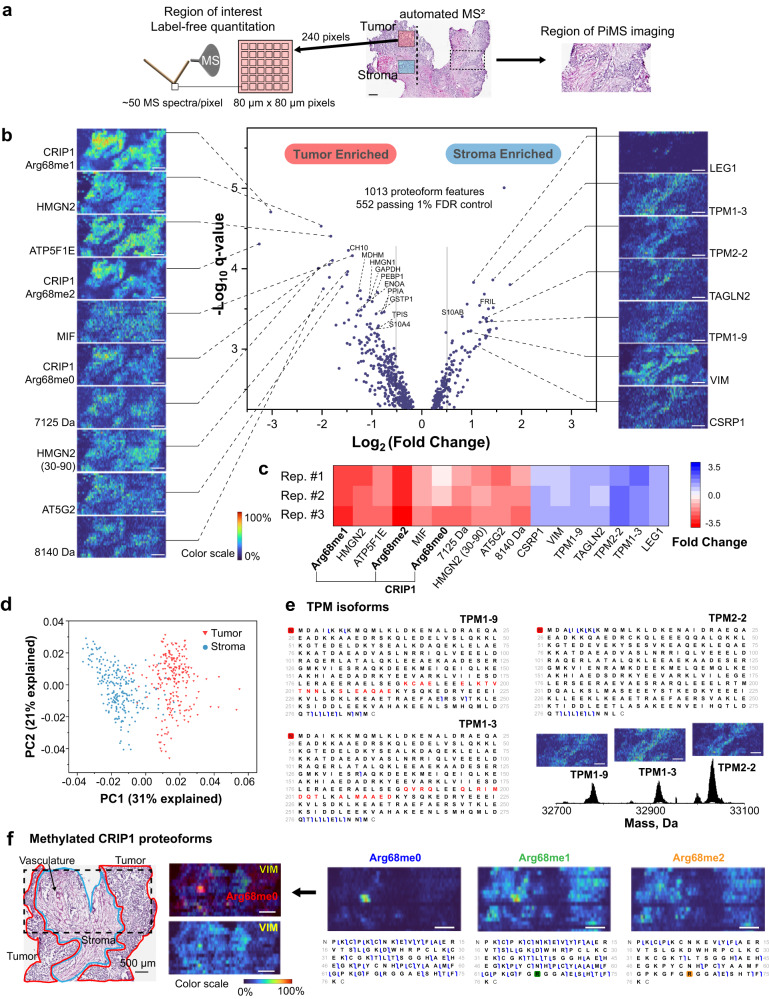
The molecular identification of tissue proteoforms by top-down mass spectrometry (TDMS) is significantly limited by throughput and dynamic range. We introduce AutoPiMS, a single-ion MS based multiplexed workflow for top-down tandem MS (MS2) directly from tissue microenvironments in a semi-automated manner. AutoPiMS directly off human ovarian cancer sections allowed for MS2 identification of 73 proteoforms up to 54 kDa at a rate of <1 min per proteoform. AutoPiMS is directly interfaced with multifaceted proteoform imaging MS data modalities for the identification of proteoform signatures in tumor and stromal regions in ovarian cancer biopsies. From a total of ~1000 proteoforms detected by region-of-interest label-free quantitation, we discover 303 differential proteoforms in stroma versus tumor from the same patient. 14 of the top proteoform signatures are corroborated by MSI at 20 micron resolution including the differential localization of methylated forms of CRIP1, indicating the importance of proteoform-enabled spatial biology in ovarian cancer.


Conflict of interest statement

N.L.K., K.R.D, and J.O.K. report a conflict of interest with individual ion technology and the development of software for processing resulting data. T.P.C. is a Thermo Fisher Scientific Inc. SAB member and receives research funding from AbbVie, Inc. The remaining authors declare no competing interests.

Figures

Fig. 1
Fig. 1. Logic and performance metrics of AutoPiMS proteoform identification directly from ovarian cancer tissue.
a A survey line scan produces individual ion mass spectra detecting multiply-charged proteoform ions under denaturing conditions. Selected charge states of proteoforms are automatically targeted at optimized locations in a subsequent line scan for top-down fragmentation and database search. b A survey spectrum in the 17–50 kDa range with proteoform identification by the AutoPiMS workflow. The left inset shows a zoomed view of the spectral region highlighted in red. In this region, we detected phosphorylated proteoforms of heat shock protein beta-1 (HSPB1, UniProt accession: P04792) and a coding polymorphism that created two proteoforms of glutathione S-transferase P (GSTP1, UniProt accession: P09211). The right inset shows gene ontology analysis of 73 MS2-identified proteoforms. c A bar plot showing the difference in abundance of 25 specific proteoforms in the survey line scan (teal dots) versus when they were fragmented in the subsequent identification scans (orange bars). d Raw ion counts of the 25 proteoforms in the survey scan when spatial bins are assigned to the 25 targets randomly (blue violin plots) versus algorithm-optimized (red dots) in subsequent MS2 fragmentation scans. e MS1 survey (middle) and MS2 spectra (outer) along with graphical fragment maps of N-terminal acetylated vimentin (UniProt accession: P08670, left) and N-terminal acetylated keratin type II cytoskeletal 8 (UniProt accession: P05787, right) identified by AutoPiMS. In the middle panel, theoretical isotopic distributions of the two proteoforms are overlayed. The step plots (middle, bottom) show the spatial distributions of the two proteoforms along the survey line and the locations where they were targeted (vimentin in red, keratin in blue). Source data are provided as a Source Data file for (ce).
Fig. 2
Fig. 2. Applying AutoPiMS to ovarian cancer tissue, including PiMS imaging, label-free quantitation, and automated MS2 identification.
a Regions of interest used for label-free quantitation (left) and imaging (right). Dashed line in the middle image depicts an AutoPiMS line scan. b Volcano plot (middle) generated from label-free quantitation of 552 proteoforms using the ion counts from 472 sampled regions in tumor and stroma. PiMS images of 10 proteoforms significantly enriched in tumor (left) and 7 proteoforms in stroma region (right) are correlated to their quantitation outcome in the volcano plot by dashed lines. Proteoforms labeled in the volcano plot are MS1 annotated. c Reproducibility of quantitation for the 17 differentially detected proteoforms highlighted in (b). d Principal component analysis of 472 region-of-interest samples (using the ion counts of 552 proteoforms as dimensions) showing clear differentiation of tumor vs. stroma samples (red and blue, respectively). e Examples of the identification of highly-similar proteoforms, tropomyosin alpha-1 chain isoform 9 (UniProt accession: P09493-9), tropomyosin alpha-1 chain isoform 3 (UniProt accession: P09493-3), and tropomyosin beta chain isoform 2 (UniProt accession: P07951-2). f Differential spatial localization of three proteoforms of CRIP1 (UniProt accession: P50238) with Arg68me0, me1 and me2; The imaged area highlighted using a dashed box on the histology image (left) contains tumor (red), stroma (blue), and vasculature regions adjacent to the region in (a). PiMS images of CRIP1 proteoforms are shown at right. The graphical fragment maps obtained from automated MS2 characterize unmethylated CRIP1 and localize the mono- and di-methylations of CRIP1. A PiMS image of N-terminally acetylated vimentin (UniProt accession: P08670) serves as a marker for stromal and vascularized tumor regions (middle bottom). Merged image of vimentin and CRIP1 Arg68me0 show co-localization in tumor vascular regions (middle top). All scale bars are 500 µm.

References

    1. Smith LM, et al. Proteoform: a single term describing protein complexity. Nat. Methods. 2013;10:186–187. doi: 10.1038/nmeth.2369. - DOI - PMC - PubMed
    1. Uhlén M, et al. Tissue-based map of the human proteome. Science. 2015;347:1260419. doi: 10.1126/science.1260419. - DOI - PubMed
    1. Mund A, Brunner A-D, Mann M. Unbiased spatial proteomics with single-cell resolution in tissues. Mol. Cell. 2022;82:2335–2349. doi: 10.1016/j.molcel.2022.05.022. - DOI - PubMed
    1. Seeley EH, Caprioli RM. Molecular imaging of proteins in tissues by mass spectrometry. Proc. Natl Acad. Sci. 2008;105:18126–18131. doi: 10.1073/pnas.0801374105. - DOI - PMC - PubMed
    1. Compton PD, Zamdborg L, Thomas PM, Kelleher NL. On the scalability and requirements of whole protein mass spectrometry. Anal. Chem. 2011;83:6868–6874. doi: 10.1021/ac2010795. - DOI - PMC - PubMed

Publication types