. 2023 Oct 14;14(1):6498.
doi: 10.1038/s41467-023-42239-w.

Androgen receptor is a determinant of melanoma targeted drug resistance

Affiliations

Androgen receptor is a determinant of melanoma targeted drug resistance

Anastasia Samarkina et al. Nat Commun. .

Abstract

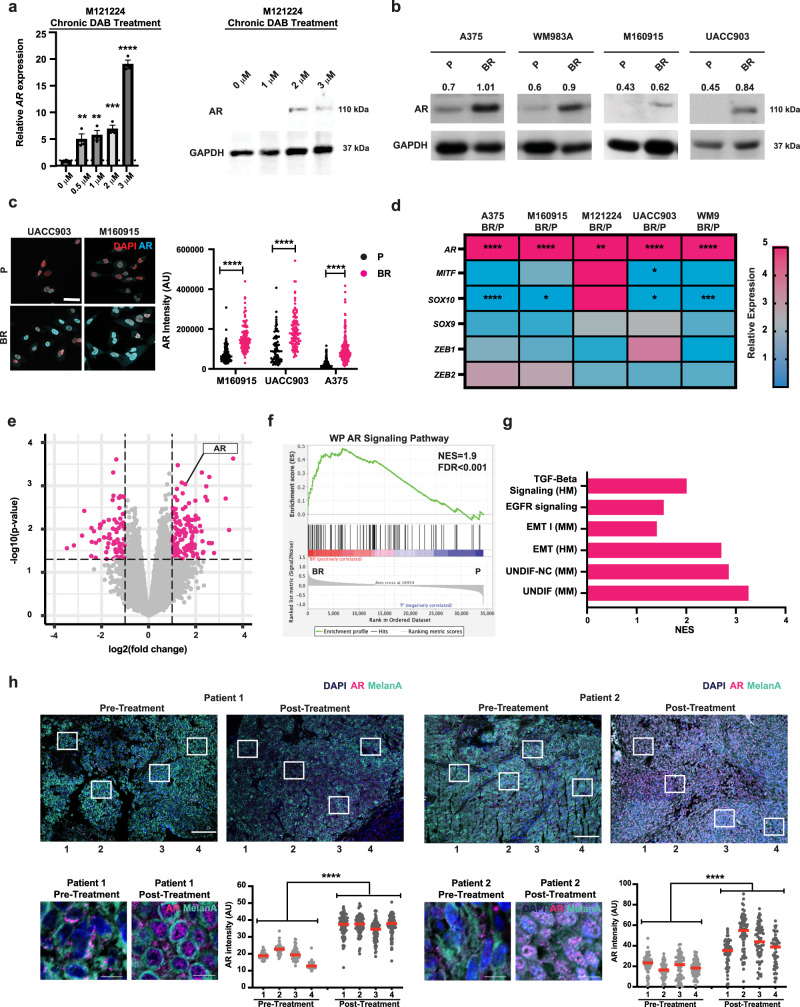
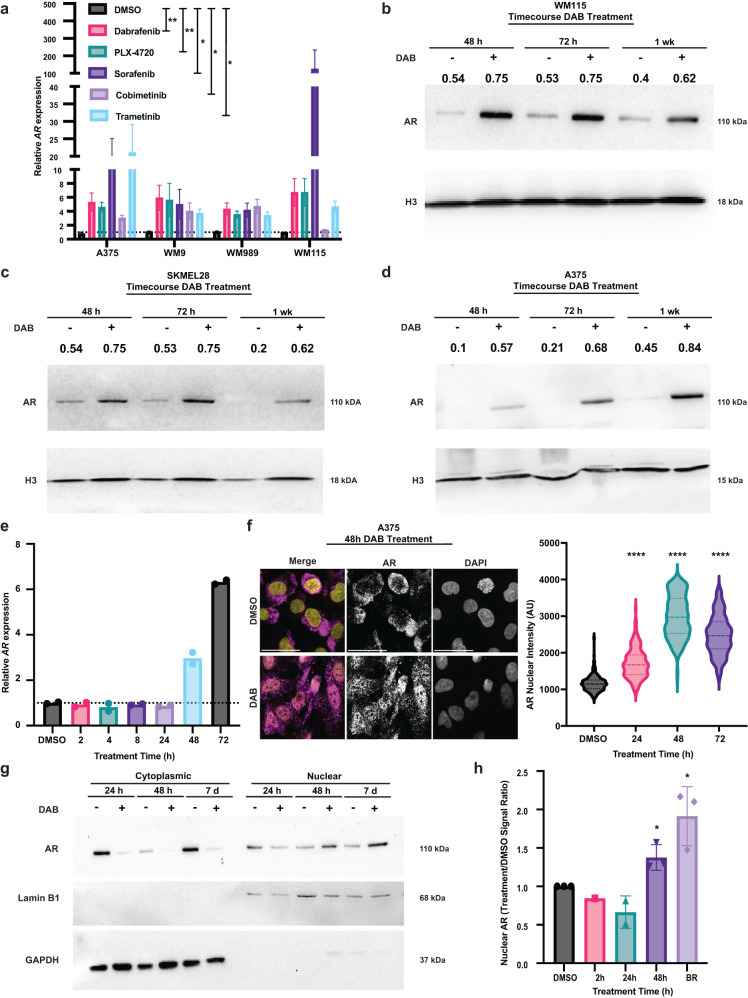
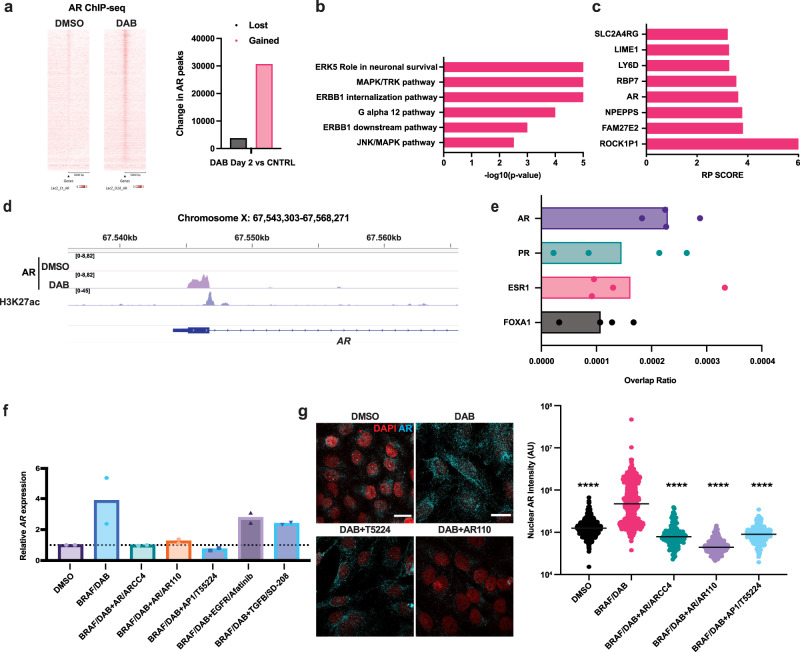
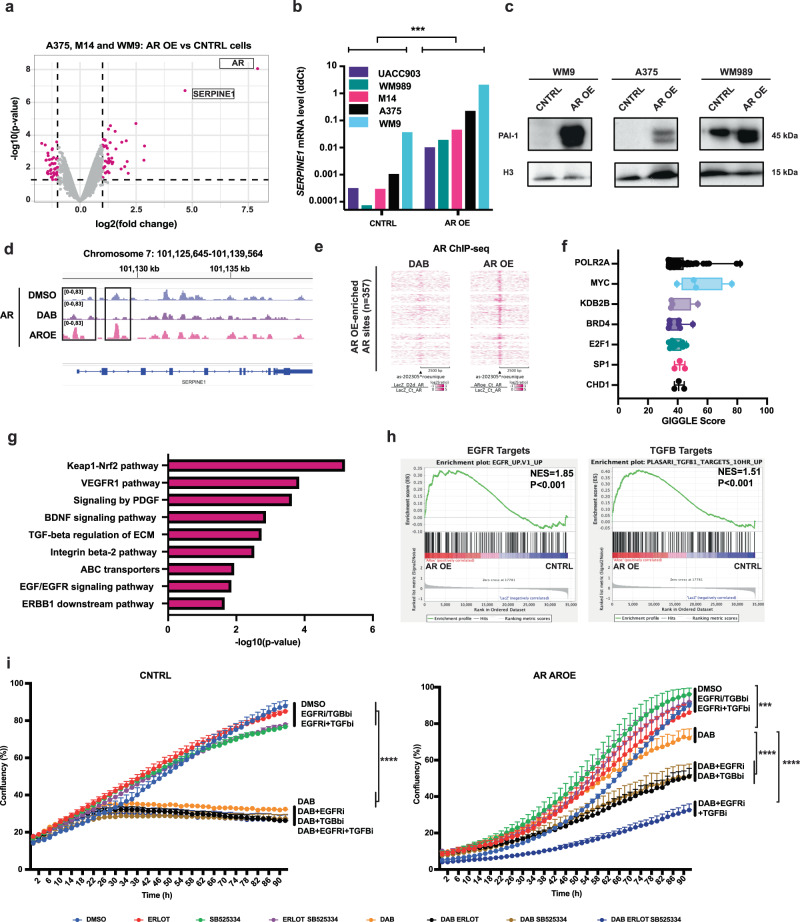
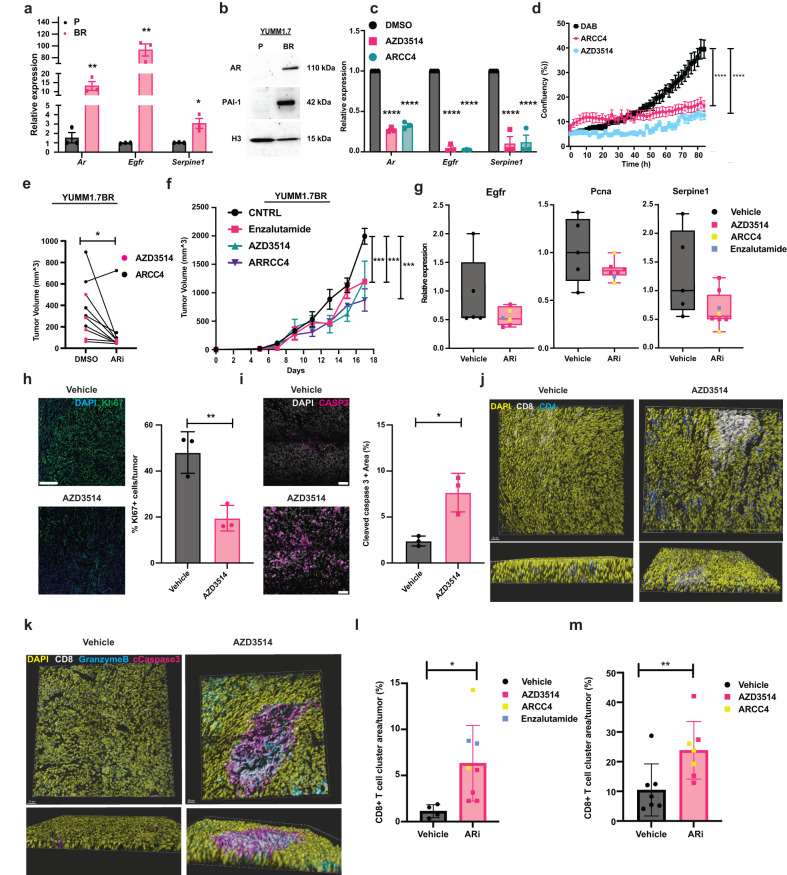
Melanoma provides a primary benchmark for targeted drug therapy. Most melanomas with BRAFV600 mutations regress in response to BRAF/MEK inhibitors (BRAFi/MEKi). However, nearly all relapse within the first two years, and there is a connection between BRAFi/MEKi-resistance and poor response to immune checkpoint therapy. We reported that androgen receptor (AR) activity is required for melanoma cell proliferation and tumorigenesis. We show here that AR expression is markedly increased in BRAFi-resistant melanoma cells, and in sensitive cells soon after BRAFi exposure. Increased AR expression is sufficient to render melanoma cells BRAFi-resistant, eliciting transcriptional changes of BRAFi-resistant subpopulations, including elevated EGFR and SERPINE1 expression, of likely clinical significance. Inhibition of AR expression or activity blunts changes in gene expression and suppresses proliferation and tumorigenesis of BRAFi-resistant melanoma cells, promoting clusters of CD8+ T cells infiltration and cancer cells killing. Our findings point to targeting AR as possible co-therapeutical approach in melanoma treatment.


Conflict of interest statement

The authors declare no competing interests.

Figures

Fig. 1
Fig. 1. Chronic BRAFi treatment of melanoma cells results in increased androgen receptor (AR) expression.
a RT-qPCR and immunoblot analysis (WB) of AR expression in primary human melanoma cells (M121224) with weekly increases of BRAF inhibitor Dabrafenib (DAB, 0.5, 1, 2, and 3 μM). RT-qPCR was normalized to RPLP0 and WB to GAPDH. Mean ± SEM. n(biological replicates)= 3, unpaired, two-tailed t-test. **p < 0.01, ****p < 0.0001. Additional melanoma lines are in Supplementary Fig. 1a–c. b AR and GAPDH WBs of primary (M160915) and established melanoma cells (A375, WM983A, and UACC903), selected for BRAFi resistance (BR) as in a, versus parental cells (P). Relative AR intensity levels (numbers) were normalized to GAPDH. c AR immunofluorescence analysis (IF) with DAPI (red) in P and BR melanoma cells established as in a. Representative images and AR nuclear signal quantification per cell (arbitrary units). n(cells/sample) >100, unpaired two-tailed t-test, **** p < 0.0001. Scale bar: 40 μm. d Heatmap of AR expression, as assessed by RT-qPCR analysis with RPLP0 normalization, in BR primary (M160915, M121224) and established melanoma cells (A375 and WM983A) versus parental cells (P). Up- (magenta) and down- (blue) regulated genes. Two-tailed multiple comparison t-test, n(biological replicates)=3. Unpaired t-test. ***p < 0.001, ****p < 0.0001. e Volcano plot of transcriptional changes consistently elicited in five BR versus P melanoma cells (A375, WM9, UACC903, M160915 and M121224). Fold change (log2) and p-value (−log10). Red dots show genes with a p < 0.05, two-tailed t-test, and fold-change > −1 and 1. The gene list is in Supplementary Data 1. f Gene set enrichment analysis (GSEA) of BR versus P melanoma cells transcriptional profiles using an AR gene signature from Wikipathways (WP). Black bars indicate the individual genes, enrichment is in green. Normalized enrichment score = NES. g GSEA and NES of BR versus P transcriptional profiles in five melanoma cells (same as e), using gene signatures from Hallmark (HM), WP, biocarta (BC) and melanoma studies (MM),. h AR (magenta) and MelanA (cyan) IF, with DAPI (blue), of matched pre- and post-BRAFi/MEKi treatment lesions (patients 1 (A) and 2 (B)). Representative low- and high-magnification images of areas quantified (boxes 1–4). AR signal per cell (arbitrary units), mean ± SD, n(cells/sample) >50, paired, two-tailed t-test, ****p < 0.0001. Scale bar: 100 µm and 10 µm, respectively.
Fig. 2
Fig. 2. Acute BRAFi treatment of melanoma cells results in increased AR expression.
a RT-qPCR analysis of AR expression in melanoma cells at 48 hours of treatment with various kinase inhibitors targeting BRAF, MEK and other kinases of Ras-MAPK family (DAB, PLX-4720, Sorafenib: 0.5 μM; Cobimetinib, Trametinib, 5 nM), versus DMSO. Arbitrary units relative to untreated controls normalized to RPLP0. Mean ± SEM. n(biological replicates)=3, unpaired, two-tailed t-test. *p = 0.0286, **p = 0.0049. bd AR and Histone3 (H3) WBs of WM115 b SKMEL28 c, and A375 d cells treated with DAB (0.5 μM) versus DMSO at the indicated time points. AR signal intensity (numbers) was normalized to H3. e RT-qPCR analysis of AR expression in A375 melanoma cells treated with DAB (0.5 μM) versus DMSO at the indicated time points. Arbitrary units relative to untreated controls, after RPLP0 normalization. Mean ± SD, n(biological replicates)= 2. f AR IF in A375 melanoma cells treated with DAB (0.5 μM) versus DMSO control at the indicated time points. Representative images (left) and quantification (right) of AR nuclear signal per individual cells (arbitrary units), n(cell/sample)>200 cells, unpaired, two-tailed t-test, ****p < 0.0001. Color scale: yellow, DAPI; magenta, AR. Scale bar: 10 μm. g WB of AR subcellular distribution in A375 melanoma treated for 24 and 48 h and 7 days with DAB (0.5 μM) versus DMSO control cells. Shown are cytoplasmic and nuclear cell fractions, with LaminB1 as nuclear and GAPDH as cytoplasmic markers. h quantification of AR WB analysis of nuclear fractions of DAB-treated A375 melanoma cells versus DMSO at the indicated time points. Mean ± SD, n(biological replicates DMSO = 3; 2 h = 1; 24 h = 2; 48 h = 3; BR = 3), 48 h and BR: unpaired two-tailed t-test, *p < 0.05.
Fig. 3
Fig. 3. BRAFi treatment of melanoma cells increases AR expression in melanoma cells through an AR-positive feedback loop.
a Tornado plots of AR binding sites, as determined by ChIP-seq analysis, 5,000 bp upstream and downstream of TSS, in A375 cells treated for 48 hrs with DAB versus vehicle (DMSO). The heatmap depicts the ChIP-seq signal at lower (white) and higher (red) peak intensity. Quantification of lost and gained AR binding peaks in DAB-treated versus control cells. b Functionally relevant gene ontology (GO) families of the genes significantly upregulated by BRAFi treatment in three melanoma lines and bound by AR (by ChIP seq) in DAB-treated A375 cells. The p-value (-log10) is indicated on the x-axis, unpaired two-tailed t-test. The differentially expressed genes are provided in Supplementary Data 2. c Top target genes bound by AR in DAB-treated A375 cells, as identified by ChIP-seq, using the Cistrome DB toolkit (http://dbtoolkit.cistrome.org/). RP = Regulatory potential. d Illustration of AR-binding peaks within AR locus, determined by ChIP-seq and displayed using the integrative genomic viewer software (IGV), in DAB-treated A375 cells (deep purple) versus control (cyan). H3K27ac peaks (light purple), map histone modifications overlapping with AR binding regions, were derived from. e Top transcription factors with predicted overlapping binding with AR to the AR locus using the Cistrome DB toolkit (http://dbtoolkit.cistrome.org/). Each dot represents the average overlap ratio derived from individual studies. y-axis: names of transcription factors; x-axis: overlap ratio values. f RT-qPCR analysis of AR expression in A375 melanoma cells treated with inhibitors of the indicated molecules/pathways for 48 h. AR expression (arbitrary units) relative to untreated controls, after RPLP0 normalization. Mean ± SD, n (biological replicates)=2. g AR IF in A375 melanoma cells treated with inhibitors of the indicated molecules/pathways (48 h). Representative images and quantification of AR nuclear signal (arbitrary units). Mean ± SD, n (cells/sample)>200, unpaired, two-tailed t-test, ****p < 0.0001. Color scale: red, DAPI; cyan, AR. Scale bar: 20 μm.
Fig. 4
Fig. 4. AR overexpression confers BRAFi resistance.
a Cell density assays (CellTiter-Glo) of the indicated melanoma cells stably infected with an AR overexpressing lentivirus (AR OE) versus LacZ expressing control (CNTRL) and treated with the indicated increasing concentrations of DAB for 72 h. The calculated IC50 for each condition is indicated above. Mean ± SD, n(biological replicates/condition)=3, Log-rank test, ****p < 0.0001. b Live-cell imaging proliferation assays (IncuCyte) of AR overexpressing (AR OE) versus control (CNTRL) A375 melanoma cells obtained as in a cultured with the indicated concentrations of DAB or DMSO. n(biological replicates) = 3, (four images per replicate every 4 h for 128 h). mean ± SD. Pearson r correlation test. ****p < 0.0001. c Live detection of BRAFi-induced cell death (IncuCyte, Cytotox Red) of AR overexpressing (AR OE) versus control (CNTRL) melanoma cells (A375) at 72 h of treatment with DAB. n(biological replicates) = 3, (four images per replicate every 4 h for 128 h). Mean ± SD, unpaired, two-tailed t-test, ns, non-significant, ***p < 0.001; ****p < 0.0001. d Clonogenicity assays of the indicated melanoma cells transduced with an AR overexpressing lentivirus (AR OE) versus empty vector control (CNTRL) and treated with DAB (0.5 μM) or DMSO. Cells were plated in triplicates at low density (5000 cells/6 cm dish) and quantified after one week following crystal violet staining. n(dishes/condition)=3, unpaired, two-tailed t-test, Mean ± SD. A375: (DMSO AR OE vs DMSO CNTRL) p = 0.00130 and (DAB AR OE vs DAB CNTRL) p = 0.000152; M14: (DMSO AR OE vs DMSO CNTRL) p = 0.1182 and (DAB AR OE vs DAB CNTRL) p = 0.00029; WM9 (DMSO AR OE vs DMSO CNTRL) p = 0.0091 and (DAB AR OE vs DAB CNTRL) p = 0.0043, ns: non-significant. e Clonogenicity assays of AR-overexpressing versus control A375 melanoma cells as in the previous panel treated with DAB (0.5 μM) individually and in combination with the MEK inhibitor Trametinib (5 nM). n(dishes/condition)=3, unpaired, two-tailed t-test, Mean ± SD. (DMSO AR OE vs DMSO CNTRL) p = 0.018; (DAB AR OE vs DAB CNTRL) p = 0.00041; (DAB + TRA AR OE vs DAB + TRA CNTRL) p = 0.0015.
Fig. 5
Fig. 5. Increased AR expression perturbs the transcriptional response of melanoma cells to BRAFi.
a Transcriptional response of melanoma cells plus/minus AR overexpression to acute BRAFi treatment. Volcano plot of transcriptional changes consistently elicited in A375, M14, and WM9 melanoma cells infected with control (LacZ expressing) (left) or AR overexpressing (right) lentiviruses by 48 h of treatment with Dabrafenib (0.5 μM) versus DMSO. The x-axis shows the fold change (log2), and the y-axis shows the p-value (−log10). Colored dots correspond to genes with a p-value < 0.05, two-tailed t-test, and log2fold-change threshold of −1 and 1. Magenta and cyan dots correspond to genes similarly and specifically modulated by DAB treatment in control versus AR overexpressing melanoma cells, respectively. Indicated are TGF-ß and EGFR families. The list of modulated genes in the three melanoma cell lines is provided in Supplementary Data 2. b Functionally relevant GO families significantly downmodulated by BRAFi treatment in both control and AR overexpressing cells (upper), and GO families upmodulated only in AR overexpressing cells (middle) or in control cells (bottom). The -log 10(p-value) is indicated by the heatmap color scale, two-tailed t-test. The list of modulated gene families is in Supplementary Data 2. cf GSEA of transcriptional profiles of control melanoma cells (A375, M14, and WM9) plus/minus DAB treatment and of DAB-treated control versus AR overexpressing cells using predefined gene signatures of interferon alpha and gamma response c, d and antigen processing and presentation e, f derived from the hallmark gene set (HM) and KEGG collections. Genes are ranked by signal-to-noise ratio in DAB versus DMSO-treated melanoma cells; the position of individual genes is indicated by black vertical bars; the enrichment pattern is in green. In e, f, GSEA and the leading-edge analysis of the antigen processing and presentation signature are shown in each of the three melanoma lines plus/minus DAB treatment e and of DAB-treated control versus AR overexpressing cells f.
Fig. 6
Fig. 6. Increased TGF-ß and EGFR signaling can account for DAB resistance resulting from increased AR expression.
a Transcriptional changes elicited in melanoma cells by AR overexpression. Volcano plots of genes similarly modulated in A375, M14, and WM9 melanoma cells stably infected with AR- versus LacZ- (control) expressing lentiviruses under control conditions (without DAB treatment). Colored dots (magenta) correspond to genes with fold change (log2) thresholds of −1 and 1 and p-value < 0.05, two-tailed t-test. The list of differentially expressed genes is in Supplementary Data 3. b RT-qPCR analysis of SERPINE1 expression, normalized to RPLP0, in melanoma cell lines stably infected with an AR overexpressing lentivirus versus LacZ control (the same cells as in Fig. 4). n(biological replicate)=5, paired, two-tailed t-test, *p = 0.0003. c PAI-1 and Histone H3 WB analysis of melanoma cell lines stably infected with an AR overexpressing lentivirus or LacZ control. d Illustration of AR binding peaks in A375 cells onto the SERPINE1 gene and promoter region (squares) as determined by ChIP-seq, with IGV software. AR-binding peaks in DMSO control (blue), DAB-treated (purple), and AR OE (magenta) A375 cells. e Tornado plots visualizing AR binding sites, as determined by ChIP-seq, focusing on the TSS (±2500 bp), of genes upregulated in AR overexpressing (right) or DAB-treated (left) A375 melanoma cells. The heatmap depicts the ChIP-seq signal normalized to the untreated, with levels of red indicating peak intensity. f Binding sites of transcription factors and chromatin regulators derived from public ChIP-seq profiles and the Cistrome toolkit (http://dbtoolkit.cistrome.org/) that overlap with AR-bound sites identified by ChIP-seq of AR-overexpressing cells. The GIGGLE score is indicated on the x-axis, n(SP1 and CHD1) = 3, n(MYC and KDB2B) = 4, n(BRD4) = 7, n(E2F1) = 13, n(POLR2A) = 98. Box plots show the median, with the edges delineating 25th and 75th percentiles. g GO analysis of genes bound by AR and upregulated in AR-overexpressing cells. The p-value (-log 10) is indicated on the x-axis, two-tailed t-test. h GSEA of transcriptional profiles of cell lines infected with an AR overexpressing versus LacZ control lentivirus using TGF-ß and EGFR gene signatures. Black vertical bars indicate individual genes, the enrichment pattern is in green, permutation-based p values. i Live-cell imaging proliferation analysis (IncuCyte) of AR overexpressing (AR OE) versus control (CNTRL) A375 melanoma cells, treated with Dabrafenib or DMSO and/or inhibitors of the EGFR, TGF-ß and BRAF. Mean ± SD. n(cultures/condition)=3; Pearson r correlation test, **p = 0.003.
Fig. 7
Fig. 7. Increased AR expression elicits transcriptional changes of clinical significance found in BRAFi-resistant subpopulations.
a Scores of AR, EGFR, TGF-ß gene signatures, and SERPINE1 expression in cell subpopulations identified by single-cell RNA-seq analysis of a PDX model of melanoma BRAFi-resistance. We established a gene signature resulting from AR overexpression in melanoma cells (19 upregulated and 39 downregulated genes, p-value < 0.01, absolute FC > 1, Supplementary Data 3) and calculated the scores using AUCell, in reported single cell profiles of drug-naive melanoma cells and BRAFi-induced starved-like (SMC), pigmented, invasive and neural crest-like subpopulations. We performed similar score calculations with the Reactome signaling pathway (EGFR) and hallmark EGFR and TGF-ß gene set signatures, and single gene SERPINE1 expression levels. Violin plots show individual cell score median, box (25–75%) and whiskers (5–95%). n(single cells)=486, the significance between invasive versus naive cell populations (mean) was calculated by Welch’s t-test. **p < 0.01; ***p < 0.001; ****p < 0.0001. b AR and EGFR expression in melanoma cell lines previously clustered according to differentiation trajectories. Principal Component Analysis (PCA) of the expression profiles of individual melanoma cell lines (dots) and corresponding subtypes. Overlapping color-coded indicate AR and EGFR levels derived from (http://systems.crump.ucla.edu/dediff/). c Correlation between AR and EGFR expression from melanoma clinical cohorts: GSE98394 (n = 51 primary melanomas); TCGA (n = 472 primary melanomas and metastases); LMC (n = 703 primary melanomas); GSE65904 (n = 214 melanoma metastases); GSE8401 (n = 83 primary melanomas and metastases from xenograft models). p-value (–log10), using corrplot v0.92 package with Spearman’s correlation. d Heatmap of indicated genes expression (Z-scores) in individual melanoma from TCGA Firehose Legacy, (February 2022). n(melanoma)=472. Z-scores from median-centering expression values (log2) and divided by standard deviation. For each lesion is shown patients’ sex, and if from metastasis. e Correlation between AR and EGFR, SERPINE1 and AXL expression from the cohort of d, using the corrplot 0.92 package and Spearman’s correlation. Rho coefficients, *=p-value < 0.05. f Kaplan-Meier curves of melanoma patients’ long-term survival from the TCGA dataset, divided by high (yellow line) versus low (blue line) levels of AR and EGFR expression, calculated using the optimal cutpoint for continuous variables (log2 (Expression value) = 3.08), obtained from the maximally selected rank statistics from the maxstat R package.
Fig. 8
Fig. 8. Targeting AR overcomes BRAFi resistance.
a RT-qPCR analysis of EGFR and SERPINE1 expression normalized to RPLP0, in two melanoma cells (M121224BR and WM983ABR) propagated in the presence of Dabrafenib and treated with the AR inhibitors AZD3514 and ARCC4 or DMSO for 48 h. Mean ± SD n(biological replicates)=3, one-way ANOVA, M121224BR *p = 0.0114; WM983ABR *p = 0.0123. b IF with anti-PAI-1 antibodies of melanoma cells (M121224BR) treated with the AR inhibitors AZD3514 or ARCC4 or DMSO control for 48 h as in the previous panel. Representative images and quantification of the PAI-1signal per individual cells (arbitrary units). n(cells per sample)≥100, unpaired, two-tailed t-test, **** p < 0.0001. Color scale: gray, DAPI; cyan, PAI-1. Scale bar: 40 μm. AR IF in parallel cultures is in Supplementary Fig. 6. c Live-cell imaging proliferation assays (IncuCyte) of the indicated BRAFi-resistant cells treated with AR inhibitors or DMSO, as in a, b. n(biological replicates) = 3, (four images per well every 4 h for 150 h). Mean ± SD; Pearson r correlation test, ****p < 0.0001. d Cell death as detected by live-cell staining (IncuCyte, Cytotox Red) of cells as in the previous panel at 72 h of treatment with the AR inhibitors versus DMSO control. Four images per cell culture, n (biological replicates)=3, median, box (25-75%) and whiskers (5-95%), unpaired t-test, *, p < 0.05; **p < 0.01; ****p < 0.0001. e Clonogenicity assays of three drug-naive melanoma cell lines treated with Dabrafenib (0.5 µM) individually or in combination with AZD3514 (10 µM) or ARCC4 (1 µM). Quantification of crystal violet stained colonies. n(dishes)=3, Mean ± SD, unpaired, two-tailed t-test, (M14) ***p = 0.0001; (SKMEL28) **p = 0.0018; WM983A) *p = 0.0130. f Tumor volume quantification 14 days after intradermal injection into immunodeficient mice (NOD.CB17-Prkdcscid/J) of BRAFi-resistant A375 cells pretreated with AZD3514 (10 μΜ) or DMSO vehicle 24 h prior to injection. n(tumors)=5, Paired, two-tailed t-test, *p < 0.05. Scale bar: 1 mm. g IF of tumors as in f using anti-Ki-67- and anti-MelanA antibodies. Representative images and quantification of Ki67+ cells and MelanA+ area in arbitrary units. n(tumors)=5, Paired, two-tailed t-test, *p < 0.05, **p = 0.0063. Color scale: cyan, DAPI; magenta, Ki-67. Scale bar: 40 µm.
Fig. 9
Fig. 9. AR inhibition suppresses tumorigenicity of BRAFi-resistant melanoma cells.
a RT-qPCR of the indicated genes, normalized to RPLP0, in YUMM1.7 mouse melanoma cells, parental (P), or selected for DAB resistance (BR). Mean ± SD, n(biological replicates)=3, unpaired, two-tailed t-test, (AR)**p = 0.0098; (EGFR)**p = 0.00086; (SERPINE) *p = 0.017. b WB of AR, PAI-1and H3 in (P) versus (BR) YUMM1.7 cells. c RT-qPCR of the indicated genes in YUMM1.7-BR cells treated with AZD3514 or ARCC4 AR inhibitors (ARi), or DMSO. Mean ± SEM, n(biological replicates)=3, one-way ANOVA, ****p < 0.0001. d Live-cell imaging proliferation assays (IncuCyte) of YUMM1.7-BR cells treated with DAB versus AR inhibitors. n(dishes)= 3, mean ± SD, Pearson r correlation test, ****p < 0.0001. e Tumor volume quantification 14 days after intradermal injection into immunocompetent mice (C57BL/6 J) of YUMM1.7-BR cells, pretreated (12 hours) with either AZD3514 or ARCC4 AR inhibitors (ARi) or DMSO. n(tumors) = 5, paired, two-tailed t-test, **p = 0.0014. f Tumor size (volume) in immunocompetent mice (C57BL/6 J) injected with YUMM1.7-BR cells followed by gavage with the indicated AR inhibitors or DMSO control (CNTRL), starting day 3 after injection. n(tumors)= 5, mean ± SD, two-tailed Pearson r correlation test, ***p = 0.0001. g RT-qPCR expression analysis of the indicated genes, normalized to Rplp0, in tumors as in f. Median, box (25–75%) and whiskers (5-95%), n(tumors) = 5. h Ki67 IF (green) of tumors as in f, with DAPI (blue). Representative images and quantification of Ki67+ cells per tumor. Mean ± SEM, n(tumors)= 3, unpaired, two-tailed t-test, **p = 0.0096. Scale bar: 250 µm. i Cleaved-caspase3 IF (magenta) of tumors as in f, with DAPI (blue). Representative images and quantification of cleaved-caspase3+ areas per tumor. Mean ± SEM, n(tumors)= 3, unpaired, two-tailed t-test, **p < 0.01. Scale bar: 50 µm. j CD4+ (blue) and CD8+ (white) IF of sections from tumors made as in f and 3D reconstruction analysis by Imaris software. Additional tumors are in Supplementary Fig. 8a. Scale bar: 30 µm. k Cleaved-caspase3 (magenta), granzyme B (cyan), CD8 (gray) IF of tumors made as in f, with DAPI (yellow), followed by a 3D analysis. Additional tumors are in Supplementary Fig. 8b. Scale bar: 30 µm. l, m Quantification of the tumor areas occupied by CD8+ cell clusters (n (cells/cluster) >5), as detected by IF of tumors formed in mice with gavage l or by ARi-treated cells m, as those from f, e, respectively. Mean ± SEM, unpaired, two-tailed, t-test in l, Veh n(tumors)=4; ARi n(tumors)=8; *p = 0.0188, and paired, two-tailed t-test in m Veh n(tumors)=8; ARi n(tumors)=8, ***p < 0.0009. Images used for quantifications are in Supplementary Fig. 9c–e.

References

    1. Gamba CS, Clarke CA, Keegan THM, Tao L, Swetter SM. Melanoma survival disadvantage in young, non-hispanic white males compared with females. Jama Dermatol. 2013;149:912–920. - PubMed
    1. Clocchiatti A, Cora E, Zhang Y, Dotto GP. Sexual dimorphism in cancer. Nat. Rev. Cancer. 2016;16:330–339. - PubMed
    1. Nosrati A, Wei ML. Sex disparities in melanoma outcomes: the role of biology. Arch. Biochem Biophys. 2014;563:42–50. - PubMed
    1. Haupt S, Caramia F, Klein SL, Rubin JB, Haupt Y. Sex disparities matter in cancer development and therapy. Nat. Rev. Cancer. 2021;21:393–407. - PMC - PubMed
    1. Bartz D, et al. Clinical advances in sex- and gender-informed medicine to improve the health of all: a review. JAMA Intern. Med. 2020;180:574–583. - PubMed

Publication types

MeSH terms

Substances