. 2023 Oct 14;14(1):6493.
doi: 10.1038/s41467-023-42154-0.

MANF stimulates autophagy and restores mitochondrial homeostasis to treat autosomal dominant tubulointerstitial kidney disease in mice

Affiliations

MANF stimulates autophagy and restores mitochondrial homeostasis to treat autosomal dominant tubulointerstitial kidney disease in mice

Yeawon Kim et al. Nat Commun. .

Abstract

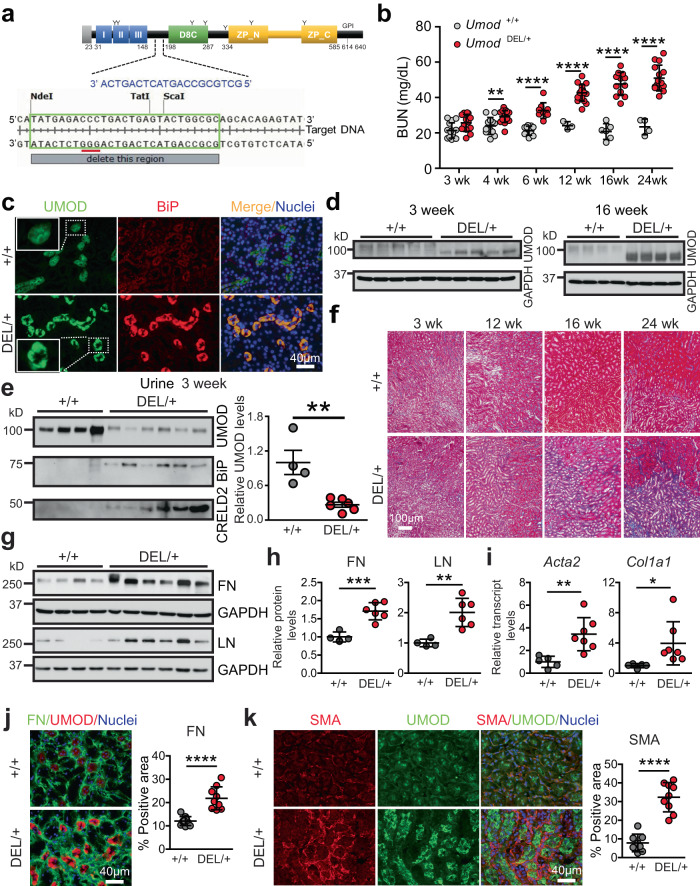
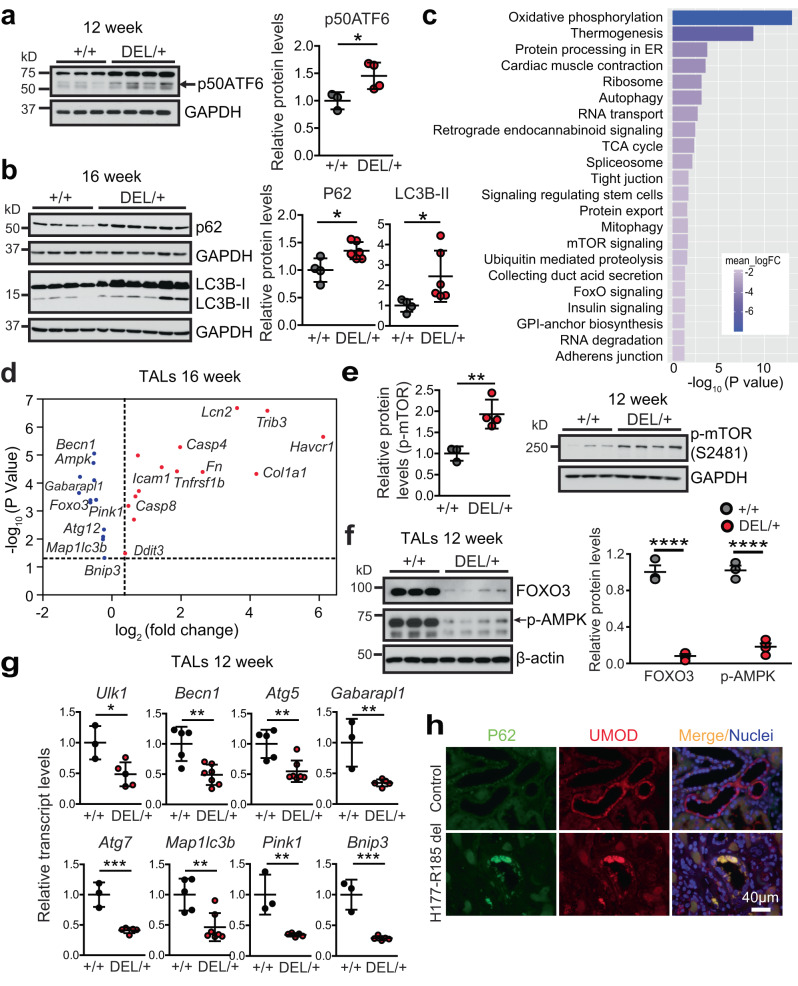
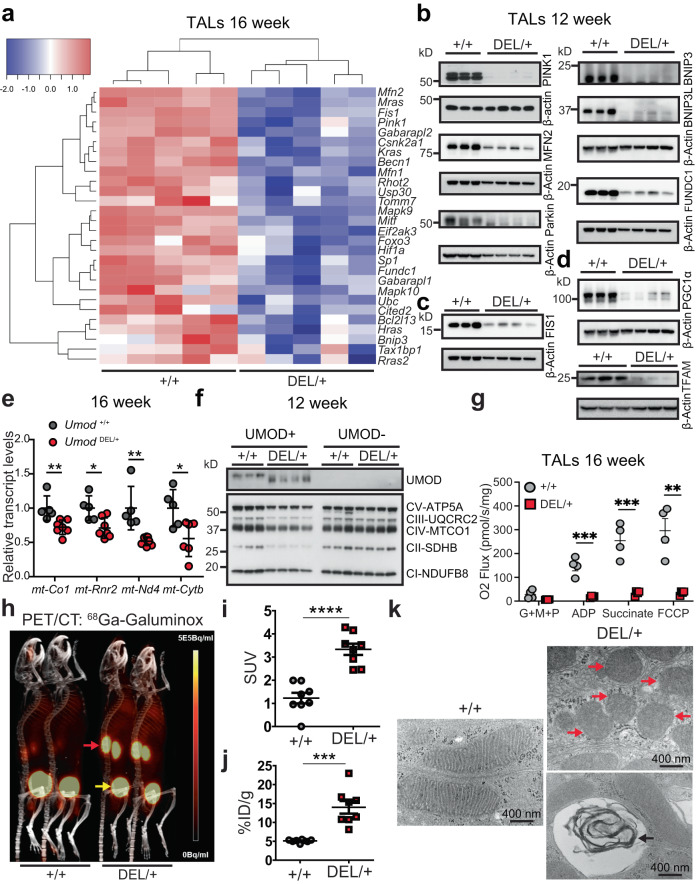
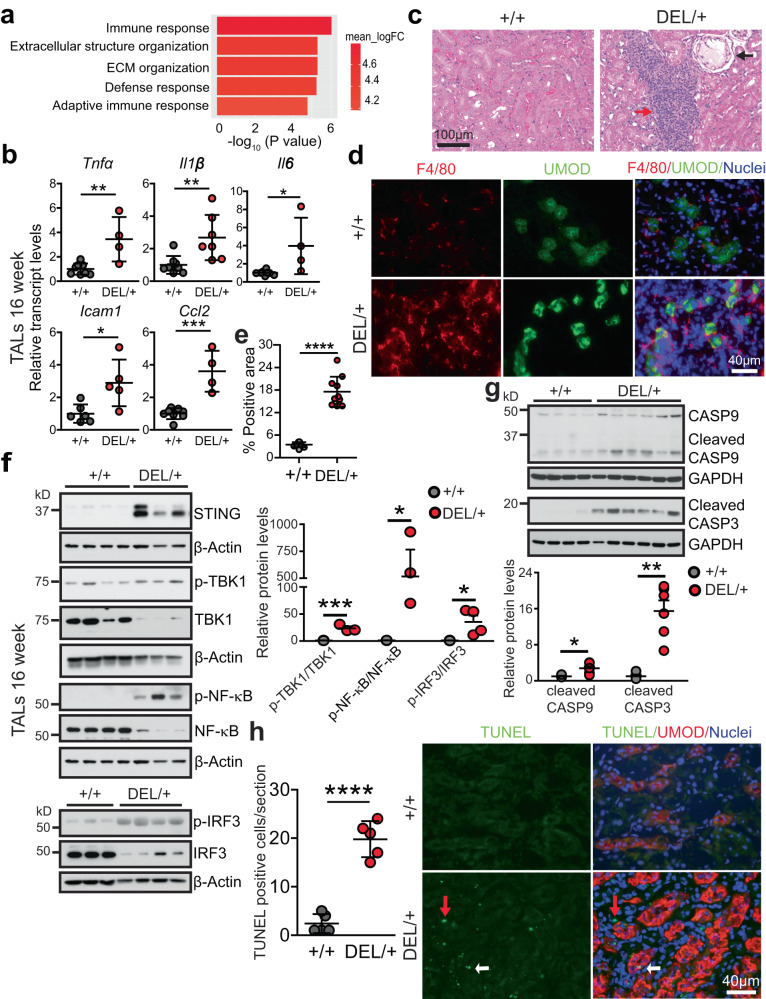
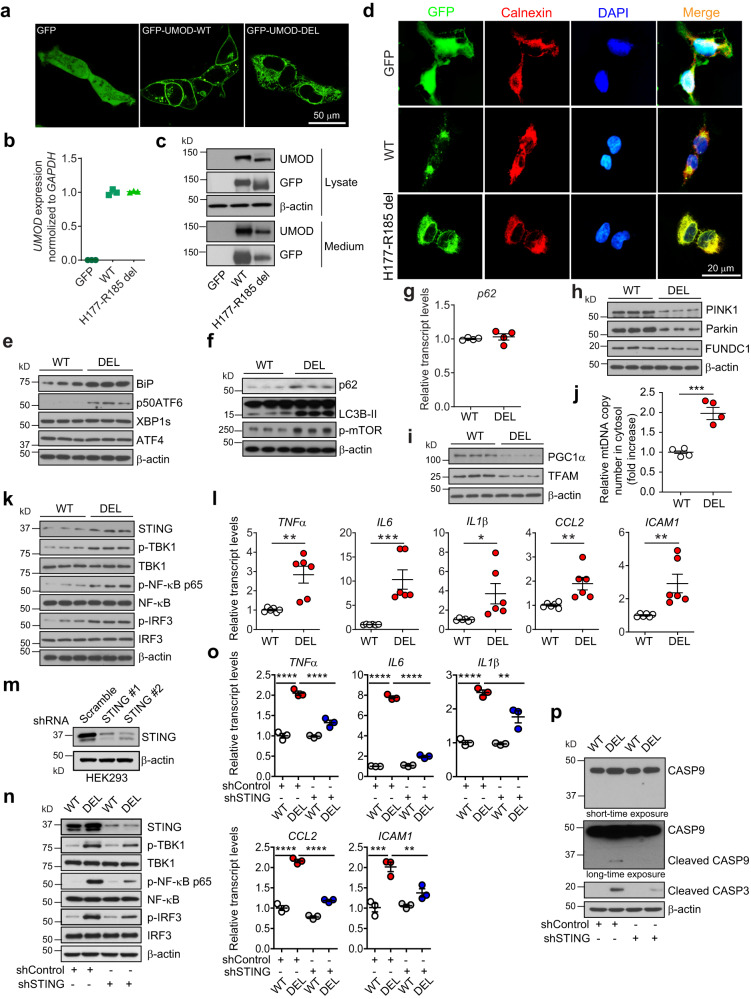
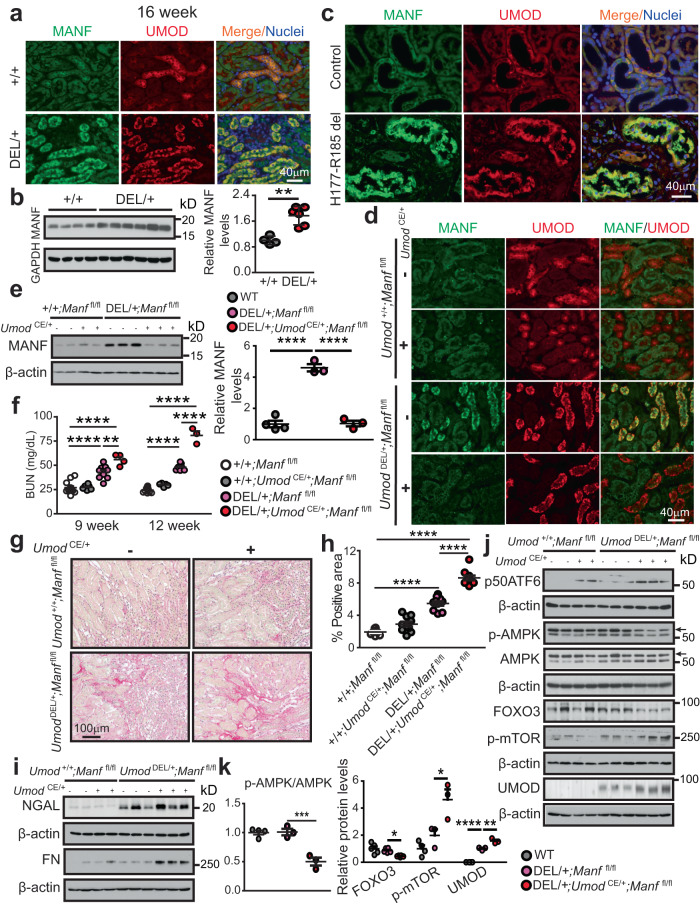
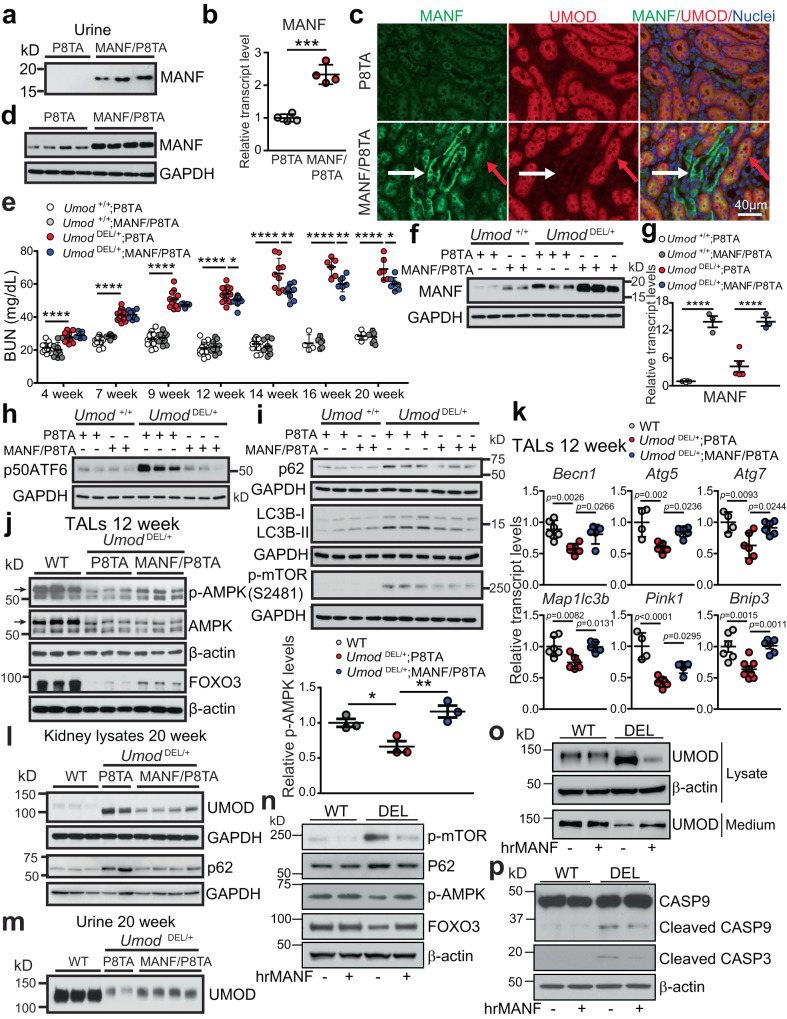
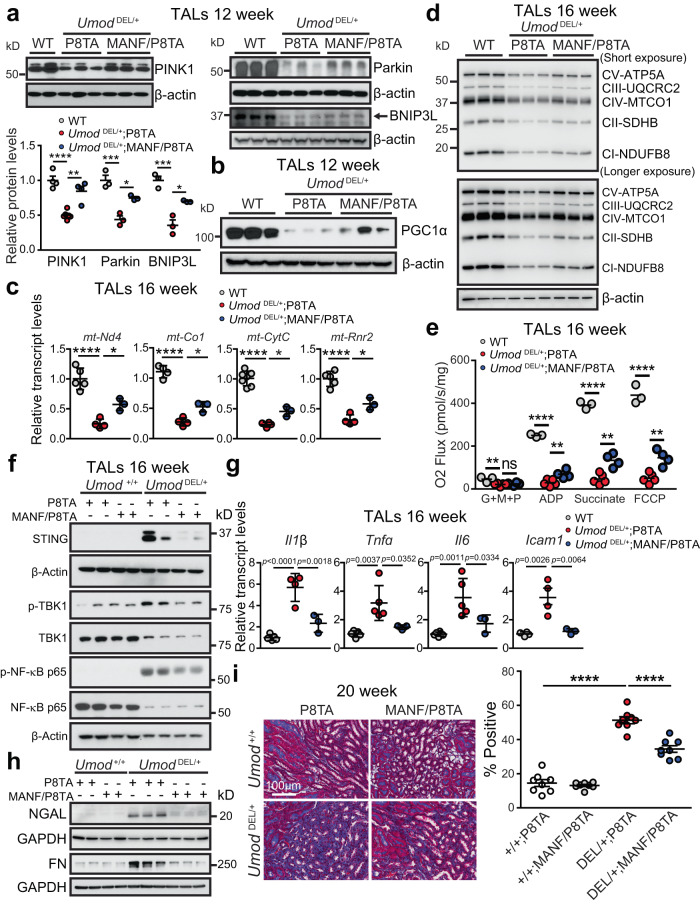
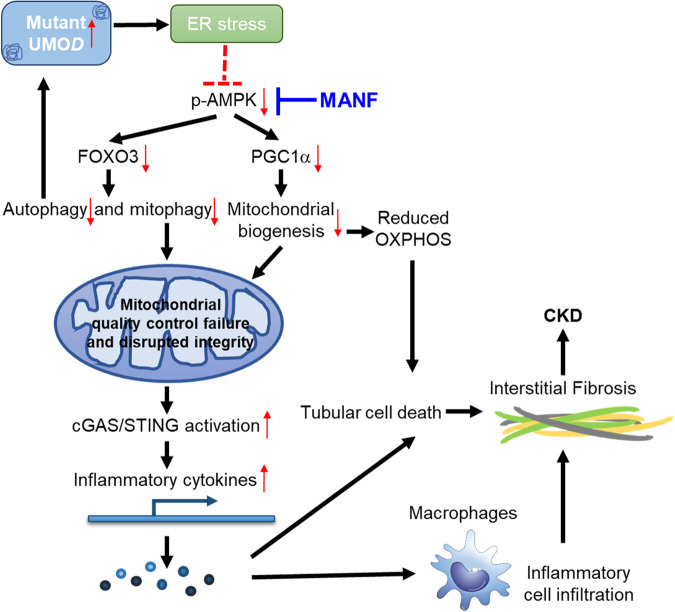
Misfolded protein aggregates may cause toxic proteinopathy, including autosomal dominant tubulointerstitial kidney disease due to uromodulin mutations (ADTKD-UMOD), a leading hereditary kidney disease. There are no targeted therapies. In our generated mouse model recapitulating human ADTKD-UMOD carrying a leading UMOD mutation, we show that autophagy/mitophagy and mitochondrial biogenesis are impaired, leading to cGAS-STING activation and tubular injury. Moreover, we demonstrate that inducible tubular overexpression of mesencephalic astrocyte-derived neurotrophic factor (MANF), a secreted endoplasmic reticulum protein, after the onset of disease stimulates autophagy/mitophagy, clears mutant UMOD, and promotes mitochondrial biogenesis through p-AMPK enhancement, thus protecting kidney function in our ADTKD mouse model. Conversely, genetic ablation of MANF in the mutant thick ascending limb tubular cells worsens autophagy suppression and kidney fibrosis. Together, we have discovered MANF as a biotherapeutic protein and elucidated previously unknown mechanisms of MANF in the regulation of organelle homeostasis, which may have broad therapeutic applications to treat various proteinopathies.


Conflict of interest statement

Y.M.C., S.J.P., Y.K., and F.U. are inventors on a patent entitled “Compositions and methods for treating and preventing endoplasmic reticulum (ER) stress-mediated kidney diseases” (US 11,129,871), which was issued by US Patent and Trademark Office in Sep. 2021. Y.M.C. and Y.K. are inventors on a patent entitled “methods of detecting biomarkers of endoplasmic reticulum (ER) stress-associated kidney diseases” (US 10,156,564), which was issued by US Patent and Trademark Office on Dec. 18, 2018. J.S. and V.S. are inventors on a non-provisional patent, entitled “PET tracers for noninvasive imaging of ROS activity” filed by Washington University in St. Louis, St. Louis, MO. Authors (J.S. & V.S.) declare no competing interests. The remaining authors declare no competing interests.

Figures

Fig. 1
Fig. 1. Generation of a mouse model that recapitulates human ADTKD-UMOD.
a The CRISPR target sites are outlined in green, the sgRNA sequences are marked in blue, and protospacer adjacent motifs (PAMs) are underlined in red. b BUN measurements over a 24-week period (at 3, 4, 6, 12, 16, 24 weeks, n = 14, 12, 11, 3, 6, 4 for WT, n = 13, 17, 9, 17, 12, 15 for DEL/+). Two-tailed t-test, Mean ± SD. **p = 0.0019 (4 weeks), ****p < 0.0001 (for 6–24 weeks). c IF images of kidney sections stained for UMOD and BiP with nuclei counterstain (blue) at 16 weeks. d Immunoblot to detect UMOD protein from whole-kidney tissues. e WBs of urine UMOD, BiP and CRELD2, indexed to urine creatinine (4 µg), from WT (n = 4) and DEL/+ (n = 6) mice at age 3 weeks, with densitometry analysis of urine UMOD. Two-tailed t-test, Mean ± SD. **p = 0.003. f Trichrome staining of WT and DEL/+ kidney sections from 3–24 weeks. g, h WBs of whole-kidney lysates from WT (n = 4) and DEL/+ (n = 6) mice at 16 weeks to detect FN and LN (g) with densitometry analysis (h). Two-tailed t-test, Mean ± SD. ***p = 0.0007 (FN), **p = 0.0033 (LN). i Q-PCR of transcript levels of Acta2 and Col1a1, normalized to 18 s, in WT (n = 5) and DEL/+ (n = 7) kidneys at age 16 weeks. Two-tailed t-test, Mean ± SD. **p = 0.0053 (Acta2), *p = 0.0465 (Col1a1). j Dual IF staining of FN (green) and UMOD (red) with nuclei counterstain (blue) on kidney sections from WT and DEL/+ mice at 16 weeks with quantification. n = 10, 9 images for WT, DEL/+ kidneys, respectively. Two-tailed t-test, Mean ± SD. ****p < 0.0001. k Dual IF staining of SMA and UMOD with nuclear counterstain (blue) on kidney sections from WT and DEL/+ mice at 24 weeks with quantification. n = 8, 9 images for WT, DEL/+ kidneys, respectively. Two-tailed t-test, Mean ± SD. ****p < 0.0001. Source data are provided as a Source Data file.
Fig. 2
Fig. 2. Impaired autophagy in the mutant TALs in ADTKD-UMOD.
a Whole-kidney lysates from Umod +/+ (n = 3) and Umod DEL/+ (n = 4) mice at 12 weeks were analyzed by WB for p50ATF6 (arrow) with densitometry analysis. Two-tailed t-test, Mean ± SD. *p = 0.0376. b WBs of whole-kidney lysates (WT, n = 4; Umod DEL/+, n = 6) at 16 weeks to detect the autophagy mediators p62 and LC3B with densitometry analysis. Two-tailed t-test, Mean ± SD. *p = 0.016 (for p62), 0.049 (LC3B-II). c, d RNA-seq analysis of mutant and WT TALs at 16 weeks. n = 5/group. Benjamini-Hochberg adjusted p < 0.05. c KEGG pathway analysis of the log2 fold-changes in TAL cells showed the top 22 downregulated pathways. GAGE analysis. d RNA-seq analysis of genes for autophagy, ER stress response, inflammation, apoptosis, kidney injury and fibrosis in the mutant TALs compared with WT TALs. Limma analysis for differential gene expression. e WB from Umod +/+ (n = 3) and Umod DEL/+ (n = 4) kidneys for levels of p-mTOR (S2481) at 12 weeks with densitometry analysis. Two-tailed t-test, Mean ± SD. **p = 0.0081. f WBs from Umod +/+ (n = 3) and Umod DEL/+ (n = 4) TALs for levels of FOXO3 and p-AMPK (arrow) at 12 weeks with densitometry analysis. Two-tailed t-test, Mean ± SD. ****p < 0.0001. g Transcript analysis of a panel of autophagy and mitophagy-related genes, normalized to 18 s, from TALs at 12 weeks. WT (n = 3) and Umod DEL/+ (n = 5) for Ulk1, Gabarapl1, Atg7, Pink1 and Bnip3; WT (n = 5) and Umod DEL/+ (n = 7) for Becn1, Atg5 and Map1lc3b. Two-tailed t-test, Mean ± SD. p = 0.02 (for Ulk1), 0.0027 (Becn1), 0.0034 (Atg5), 0.0079 (Gabarapl1), 0.0006 (Atg7), 0.0039 (Map1lc3b), 0.0032 (Pink1), 0.0005 (Bnip3). h Representative IF images of human kidney biopsies obtained from a patient with p.H177-R185 del and from a normal kidney, stained for p62 (green) and UMOD (red) with nuclei counterstain (blue) on paraffin kidney sections. Scale bar, 40 µm. Source data are provided as a Source Data file.
Fig. 3
Fig. 3. Deficient mitophagy and dysfunctional mitochondrial biogenesis in the mutant TALs in ADTKD.
a Heatmap of downregulated mitophagy-associated genes with Benjamini-Hochberg adjusted p ≤ 0.05. GAGE analysis. RNA was isolated from Umod +/+ and Umod DEL/+ TALs from 16-week-old mice. n = 5 mice/group. b Representative immunoblot analysis monitoring mitophagy pathways in Umod +/+ and Umod DEL/+ TALs at 12 weeks. n = 3–4 mice/genotype. c Representative immunoblot analysis monitoring FIS1 in Umod +/+ and Umod DEL/+ TALs at 12 weeks. n = 3–4 mice/genotype. d Representative immunoblot analysis monitoring mitochondrial biogenesis markers in Umod +/+ and Umod DEL/+ TALs at 12 weeks. n = 3–4 mice/genotype. e Relative mRNA levels of mtDNA genes, normalized to 18 s, from Umod +/+ (n = 5) and Umod DEL/+ (n = 6–7) kidneys at 16 weeks. Two-tailed t-test, Mean ± SD. p = 0.0067 (for mt-Co1), 0.0119 (mt-Rnr2), 0.0026 (mt-Nd4), 0.0219 (mt-Cytb). f Representative immunoblot analysis monitoring ETC protein expression in UMOD-positive and UMOD-negative tubular epithelium from Umod +/+ and Umod DEL/+ kidneys at 12 weeks. n = 3–4 mice/genotype. g Measurement of mitochondrial respiration using an OROBOROS Oxygraph system in permeabilized WT and Umod DEL/+ TALs at 16 weeks following sequential additions of G + M + P; ADP; succinate and FCCP. n = 4/genotype. Two-tailed t-test, Mean ± SD. p = 0.0005 (for ADP), 0.0008 (Succinate), 0.0023 (FCCP). h PET/CT images post-68Ga-Galuminox injection were acquired from Umod +/+ and Umod DEL/+ mice at 16 weeks. Uptake of radiotracers in the kidneys (red arrows) and retention in the bladders (yellow arrows) were shown. i SUV analysis of 68Ga-Galuminox uptake in kidneys of the indicated genotypes. n = 8 kidneys/group. Two-tailed t-test, Mean ± SD. ****p < 0.0001. j Post-PET imaging biodistribution data (%ID/g) of Umod +/+ and Umod DEL/+ kidneys at 16 weeks. n = 8 kidneys/group. Two-tailed t-test, Mean ± SD. ***p = 0.00011. k TEM ultrastructural analysis on the renal tubules from Umod +/+ and Umod DEL/+ mice at 16 weeks. Red arrows indicate aggregates of swollen mitochondria with disrupted cristae, and black arrow indicates “myelin body”. Scale bar, 400 nm. Source data are provided as a Source Data file.
Fig. 4
Fig. 4. Activation of STING signaling, increased inflammation and apoptosis in ADTKD-UMOD.
a RNA-seq of WT and mutant TALs at 16 weeks. n = 5/group. GO biological process perturbation bar plot showed the most upregulated pathways in the mutant vs. WT TALs at 16 weeks. GAGE analysis. b Quantitative PCR for proinflammatory cytokines, normalized to β-actin, in isolated TALs (WT: n = 6 for Icam1 and n = 8 for other genes; Umod DEL/+: n = 4 for Tnfa, Il6 and Ccl2, n = 7 for Il1b and n = 5 for Icam1) at 16 weeks. Two-tailed t-test, Mean ± SD. p = 0.0039 (for Tnfa), 0.0075 (Il1b), 0.0179 (Il6), 0.0151 (Icam1), 0.0002 (Ccl2). c H&E staining of paraffin kidney sections from Umod +/+ and Umod DEL/+ mice at 24 weeks. Red arrow indicates interstitial inflammatory infiltration. Black arrow indicates a cortical renal cyst. d, e Representative IF staining of macrophage (F4/80) and UMOD with nuclei counterstain (blue) on frozen kidney sections from Umod +/+ and Umod DEL/+ mice at 24 weeks (d) with quantification (e). n = 10 images/genotype. Two-tailed t-test, Mean ± SD. ****p < 0.0001. f Immunoblot analysis monitoring STING signaling in Umod +/+ and Umod DEL/+ TALs at 16 weeks, including STING, p-TBK1/TBK1, p-NF-κB p65/NF-κB p65 (WT: n = 4; Umod DEL/+: n = 3) and p-IRF3/IRF3 (WT: n = 3; Umod DEL/+: n = 4) with densitometry analysis. Two-tailed t-test, Mean ± SD. p = 0.0008 (for p-TBK1/TBK1), 0.0493 (p-NF-κB/NF-κB), 0.0484 (p-IRF3/IRF3). g Immunoblot analysis monitoring cleaved CASP9 and CASP3 in Umod +/+ (n = 4) and Umod DEL/+ (n = 6) kidneys at 16 weeks with densitometry analysis. Two-tailed t-test, Mean ± SD. p = 0.0176 (for cleaved CASP9), 0.0012 (cleaved CASP3). h Representative IF staining of TUNEL and UMOD (red) with nuclei counterstain (blue) on frozen kidney sections from Umod +/+ and Umod DEL/+ mice at 24 weeks. The TUNEL-positive cells were quantified. n = 5 images/genotype. Red and white arrows: UMOD- and UMOD+ cells, respectively. Two-tailed t-test, Mean ± SD. ****p < 0.0001. Source data are provided as a Source Data file.
Fig. 5
Fig. 5. Cytosolic leak of mtDNA activates STING signaling by utilizing stable HEK 293 cell line expressing N-terminal GFP-tagged WT or H177-R185 del UMOD.
a Confocal live imaging showing GFP signal in HEK 293 cells expressing GFP, GFP-tagged WT or mutant H177-R185 del uromodulin. b UMOD transcript expression assessed by RT-qPCR. Mean ± SD of fold changes of three independent samples from each clone. c Cell lysates and media from the indicated cells were analyzed by WBs for expression of GFP-UMOD by using anti-UMOD or anti-GFP antibody. d IF analysis of GFP and calnexin with nuclei counterstain (DAPI). e, f, h, i, k Cell lysates of WT and DEL cells were analyzed by WBs for the indicated proteins. n = 3/group. g Quantitative PCR analysis for mRNA levels of p62, normalized to GAPDH. n = 4/group. Mean ± SD. j Cytosolic translocation of mtDNA in WT and DEL cells was quantified by q-PCR. The copy number of mtDNA encoding cytochrome c oxidase I was normalized to nuclear DNA encoding 18 S ribosomal RNA. n = 4/group. Two-tailed t-test, Mean ± SD of fold changes. ***p = 0.0008. l Quantitative PCR of proinflammatory genes downstream of STING/NF-κB signaling, normalized to GAPDH. n = 6/group. Two-tailed t-test, Mean ± SD. p = 0.0019 (for TNFα), 0.0009 (IL6), 0.0287 (IL1β), 0.0069 (CCL2), 0.0068 (ICAM1). m WB analysis showed knockdown efficacy of STING expression from shSTING1 and shSTING2 vs. a scrambled shRNA control in HEK 293 cells. n Cell lysates of WT and DEL cells, treated with shControl or shSTING for 48 h, were analyzed by WBs for the indicated proteins. o Quantitative PCR of proinflammatory genes, normalized to GAPDH, in cells treated with shControl or shSTING for 48 h. n = 3/group. One-way ANOVA with Tukey’s multiple comparisons, Mean ± SD. TNFα, IL6, CCL2: ****p < 0.0001; IL1β: ****p < 0.0001, **p = 0.0044; ICAM1: ***p = 0.0003, **p = 0.0062. p Cell lysates of WT and DEL cells, treated with shControl or shSTING for 48 h, were analyzed by WBs for cleaved caspases 9 and 3. Source data are provided as a Source Data file.
Fig. 6
Fig. 6. Loss of MANF in TALs deteriorates autophagy suppression and kidney fibrosis in ADTKD-UMOD.
a Co-localization of MANF and UMOD with nuclei counterstain (blue) on kidney sections from WT and Umod DEL/+ mice at 16 weeks. b WB of MANF in WT (n = 4) and Umod DEL/+ (n = 6) kidneys at 16 weeks with densitometry analysis. Two-tailed t-test, Mean ± SD. **p = 0.0011. c Kidney sections from a patient with p.H177-R185 del and a normal kidney, stained for MANF and UMOD with nuclei counterstain (blue). d Kidney sections from mice of the indicated genotypes were examined by dual IF staining of MANF and UMOD at 9 weeks. e Kidney WB of MANF from WT (n = 4), DEL/+;Manf fl/fl (n = 3), and DEL/+;Umod CE/+;Manf fl/fl (n = 3) mice at 12 weeks with densitometry analysis. One-way ANOVA with Tukey’s multiple comparisons, Mean ± SD. ****p < 0.0001. f BUN measurements at 9 and 12 weeks. +/+;Manf fl/fl (n = 12, 10 for weeks 9, 12), +/+;Umod CE/+;Manf fl/fl (n = 6, 5 for weeks 9, 12), DEL/+;Manf fl/fl (n = 9, 7 for weeks 9, 12), DEL/+;Umod CE/+;Manf fl/fl (n = 4, 3 for weeks 9, 12). One-way ANOVA with Tukey’s multiple comparisons, Mean ± SD. **p = 0.0049; ****p < 0.0001. g Kidney sections stained with Picrosirius red and quantified in h. n = 10 images/genotype. One-way ANOVA with Tukey’s multiple comparisons, Mean ± SD. ****p < 0.0001. i Representative WBs of NGAL and FN in WT and DEL/+ kidneys without or with MANF deletion at 12 weeks. j, k WB of p50ATF6, p-AMPK/AMPK (arrows), FOXO3, p-mTOR (S2481) and UMOD in WT and DEL/+ kidneys without or with MANF loss in TALs at 12 weeks (j) with densitometry analysis (k). WT (n = 5 for FOXO3, n = 4 for other proteins), DEL/+;Manf fl/fl (n = 6 for FOXO3, n = 3 for other proteins), DEL/+;Umod CE/+;Manf fl/fl (n = 6 for FOXO3, n = 3 for other proteins). One-way ANOVA with Tukey’s multiple comparisons, Mean ± SD. ****p < 0.0001. DEL/+;Umod CE/+;Manf fl/fl vs DEL/+;Manf fl/fl: p = 0.0008 (for p-AMPK/AMPK), 0.015 (FOXO3), 0.0198 (p-mTOR) and 0.0011 (UMOD). Source data are provided as a Source Data file.
Fig. 7
Fig. 7. MANF treatment in vivo and in vitro stimulates autophagy in ADTKD.
a WB of urine MANF, indexed to urine creatinine (4 μg), from the indicated DOX-treated mice. b Quantitative-PCR of total MANF transcript levels in 4-week DOX-treated P8TA (n = 4) and MANF/P8TA (n = 4) kidneys. Two-tailed t-test, Mean ± SD. ***p = 0.0002. c IF staining of MANF, UMOD and nuclei counterstain (blue) on the indicated kidney sections after 4 weeks of DOX administration. Red and white arrows point to UMOD+ and UMOD- tubules, respectively. d WB of kidney MANF from the indicated groups with 4-week DOX treatment. e BUN measurements over a 20-week period. For weeks 4, 7, 9, 12, 14, 16, 20, n = 14, 17, 14, 19, 12, 4, 5 for +/+;P8TA, n = 10, 10, 10, 13, 8, 6, 6 for +/+;MANF/P8TA, n = 11, 17, 11, 18, 9, 6, 6 for DEL/ + ;P8TA, and n = 5, 8, 5, 11, 8, 7, 7 for DEL/ + ;MANF/P8TA. One-way ANOVA with Tukey’s multiple comparisons, Mean ± SD. ****p < 0.0001, DEL/ + ;MANF/P8TA vs DEL/ + ;P8TA: *p = 0.033 (12 weeks), 0.0214 (20 weeks); **p = 0.0022 (14 weeks), 0.006 (16 weeks). f, h, i Kidney WB of indicated proteins from the indicated genotypes at 14 weeks. g Q-PCR of total MANF transcript levels in WT and DEL/+ TALs without (n = 5 for both genotypes) or with tubular MANF overexpression (n = 3 for both genotypes) at 20 weeks. One-way ANOVA with Tukey’s multiple comparisons, Mean ± SD. ****p < 0.0001. j WBs of the indicated proteins from TALs of the indicated groups (n = 3/group) at 12 weeks with densitometry analysis of p-AMPK. One-way ANOVA with Tukey’s multiple comparisons, Mean ± SD. *p = 0.0414, **p = 0.0075. k Q-PCR of TALs from the indicated groups at 12 weeks for autophagy and mitophagy-related genes. For WT, DEL/ + ;P8TA and DEL/ + ;MANF/P8TA, n = 6, 6, 5 for Becn1, Map1lc3b, n = 4, 5, 6 for Atg5, n = 4, 6, 6 for Atg7, n = 4, 6, 5 for Pink1, n = 6, 8, 6 for Bnip3. One-way ANOVA with Tukey’s multiple comparisons, Mean ± SD. l, m WBs of UMOD and P62 from kidneys (l) or urines (m) of the indicated groups at 20 weeks. The urinary UMOD excretion was indexed to urine creatinine (4 μg). np Cell lysates and media of stable WT and DEL cells, which were pulsed with BFA, and then treated without or with hrMANF, were analyzed by WBs for the indicated proteins. Source data are provided as a Source Data file.
Fig. 8
Fig. 8. Renal tubular upregulation of MANF promotes mitophagy and improves mitochondrial biogenesis, leading to abrogation of STING activation and kidney fibrosis in ADTKD-UMOD.
a WBs of PINK1, Parkin and BNIP3L (arrow) in TALs isolate from the kidneys of the indicated groups at 12 weeks with densitometry analysis. For WT, DEL/ + ;P8TA, DEL/ + ;MANF/P8TA, n = 4, 6, 4 for PINK1, n = 3, 3, 3 for Parkin and BNIP3L. One-way ANOVA with Tukey’s multiple comparisons, Mean ± SD. DEL/ + ;P8TA vs WT: p < 0.0001 (PINK1), 0.0007 (Parkin) and 0.0005 (BNIP3L). DEL/ + ;MANF/P8TA vs DEL/ + ;P8TA: p = 0.0011 (for PINK1), 0.0141 (Parkin) and 0.0125 (BNIP3L). b WB of PGC1α in TALs from the indicated groups at 12 weeks. c Transcript analysis of mt-Nd4, mt-Co1, mt-CytC and mt-Rnr2 from TALs of WT (n = 4–7), DEL/ + ;P8TA (n = 4) and DEL/ + ;MANF/P8TA (n = 3) at 16 weeks. One-way ANOVA with Tukey’s multiple comparisons, Mean ± SD. ****p < 0.0001. DEL/ + ;MANF/P8TA vs DEL/ + ;P8TA: *p = 0.031 (for mt-Nd4), 0.0115 (mt-Co1), 0.0357 (mt-CytC) and 0.0248 (mt-Rnr2). d WBs of ETC expression in TALs of the indicated genotypes at 16 weeks. e Assessment of mitochondrial function using an OROBOROS Oxygraph system in permeabilized TALs of WT (n = 3), DEL/ + ;P8TA (n = 5) and DEL/ + ;MANF/P8TA (n = 4) at 16 weeks following sequential additions of G + M + P; ADP; succinate and FCCP. One-way ANOVA with Tukey’s multiple comparisons, Mean ± SD. DEL/ + ;P8TA vs WT: **p = 0.0085, ****p < 0.0001. DEL/+;MANF/P8TA vs DEL/ + ;P8TA: p = 0.8880 (ns, G + M + P), 0.0095 (ADP), 0.0017 (Succinate), 0.0052 (FCCP). f WBs of STING signaling in the TALs of the indicated genotypes at 16 weeks. g Transcript analysis of inflammatory genes from TALs of WT (n = 4-6), DEL/ + ;P8TA (n = 4 for Il1b, Icam1, n = 5 for Tnfa, Il6) and DEL/ + ;MANF/P8TA (n = 3) at 16 weeks. One-way ANOVA with Tukey’s multiple comparisons, Mean ± SD. h WBs of NGAL and FN in the kidneys of the indicated genotypes at 20 weeks. i Trichrome staining of kidney sections from the indicated groups at 20 weeks with quantification. n = 8 images/genotype. One-way ANOVA with Tukey’s multiple comparisons, Mean ± SD. ****p < 0.0001. Source data are provided as a Source Data file.
Fig. 9
Fig. 9. Modulation of kidney fibrosis in ADTKD-UMOD by MANF.
Mutant UMOD triggers ER stress response, which may directly or indirectly inhibit AMPK activation. Tubular overexpression of MANF after the onset of ADTKD promotes autophagy/mitophagy via activation of p-AMPK-FOXO3 signaling, and enhances mitochondrial biogenesis via p-AMPK-PGC1α axis. Moreover, elimination of dysfunctional mitochondria and restoration of mitochondrial homeostasis through increased tubular MANF expression abrogate STING activation and mitigate tubular pathological inflammation. Finally, increased autophagic clearance of mutant UMOD by tubular MANF upregulation would further stop the malicious cycle between impaired autophagy and ER stress intensification, eventually protecting kidney function in ADTKD-UMOD.

Update of

References

    1. Koo EH, Lansbury PT, Jr., Kelly JW. Amyloid diseases: abnormal protein aggregation in neurodegeneration. Proc. Natl Acad. Sci. USA. 1999;96:9989–9990. - PMC - PubMed
    1. Walker AK, Atkin JD. Stress signaling from the endoplasmic reticulum: a central player in the pathogenesis of amyotrophic lateral sclerosis. IUBMB Life. 2011;63:754–763. - PubMed
    1. Fonseca SG, et al. Wolfram syndrome 1 gene negatively regulates ER stress signaling in rodent and human cells. J. Clin. Invest. 2010;120:744–755. - PMC - PubMed
    1. Howard M, Welch WJ. Manipulating the folding pathway of delta F508 CFTR using chemical chaperones. Methods Mol. Med. 2002;70:267–275. - PubMed
    1. Lomas DA, Evans DL, Finch JT, Carrell RW. The mechanism of Z alpha 1-antitrypsin accumulation in the liver. Nature. 1992;357:605–607. - PubMed

Publication types