. 2023 Oct 14;7(1):104.
doi: 10.1038/s41698-023-00459-9.

Serum immune checkpoint profiling identifies soluble CD40 as a biomarker for pancreatic cancer

Affiliations

Serum immune checkpoint profiling identifies soluble CD40 as a biomarker for pancreatic cancer

David Digomann et al. NPJ Precis Oncol. .

Abstract

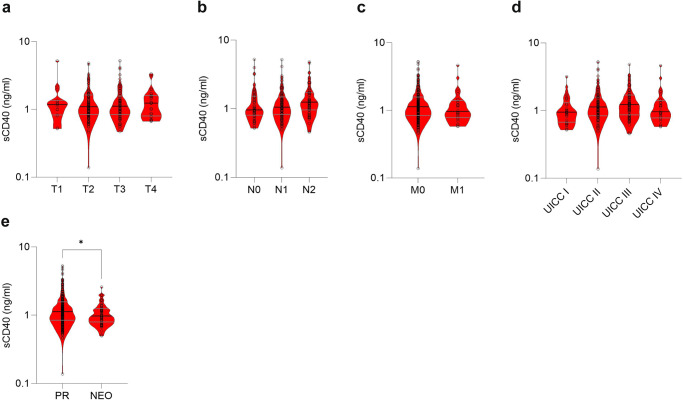
Pancreatic ductal adenocarcinoma (PDAC) responds poorly to systemic treatment, including new immunotherapeutic approaches. Biomarkers are urgently needed for early disease detection, patient stratification for treatment, and response prediction. The role of soluble CD40 (sCD40) is unknown in PDAC. In this study, we performed a quantitative multiplex analysis of 17 immune checkpoint proteins in serum samples from patients with various stages of PDAC in a discovery study (n = 107) and analyzed sCD40 by ELISA in a validation study (n = 317). Youden's J statistic was used for diagnostic cut-off optimization. A Cox proportional hazards regression model was applied in an empiric approach for prognostic threshold optimization. Kaplan-Meier estimator and multivariable Cox regression analyses were used for survival analysis. sCD40 was significantly increased in the serum of patients with PDAC compared to healthy cohorts and patients with IPMN. In the validation cohort, the area under the receiver operating characteristic (ROC) c-statistic was 0.8, and combining sCD40 with CA19-9 yielded a c-statistic of 0.95. sCD40 levels were independent of the tumor stage. However, patients who received neoadjuvant chemotherapy had significantly lower sCD40 levels than those who underwent upfront surgery. Patients with a sCD40 level above the empirical threshold of 0.83 ng/ml had a significantly reduced overall survival with a hazard ratio of 1.4. This observation was pronounced in patients after neoadjuvant chemotherapy. Collectively, soluble CD40 may be considered as both a diagnostic and prognostic non-invasive biomarker in PDAC.


Conflict of interest statement

The authors declare no competing interests.

Figures

Fig. 1
Fig. 1. Serum level of 17 different immune checkpoint proteins measured in a discovery cohort of primarily resected PDAC patients (n = 77) and healthy donors (HD, n = 20).
a Serum levels displayed as truncated violine plot with log10 scale. sTIM-3 and sCD40 with significantly higher levels in PDAC compared to HD (Mann Whitney test, sTIM-3 P = 0.003, sCD40 P = 0.007). b Unsupervised hierarchical clustering heatmap of serum levels; log2 normalized to the median of healthy donors. Measurements below the minimal detection concentrations are marked with crosses.
Fig. 2
Fig. 2. Diagnostic value of sCD40 in primarily resected PDAC patients.
a Serum level of sCD40 from PDAC patients and healthy donors (one-way ANOVA using Tukey’s multiple comparisons test, HD vs. IPMN P = 0.48, IPMN vs. PDAC P < 0.001, HD vs. PDAC P < 0.001). b ROC of sCD40 and CA19-9 with an AUC significantly different to chance for sCD40 (P = 0.001, CI = 0.58–0.774, IPMN n = 38, healthy donors n = 116) and no significant differences to chance for CA19-9 (P = 0.79, CI 0.396–0.635, IPMN n = 38, healthy donors n = 80). c ROC of sCD40 and CA19-9 with an AUC significantly different to chance for sCD40 (P < 0.001, CI = 0.748–0.841, PDAC n = 251, healthy donors n = 116) and CA19-9 (P < 0.001, CI 0.885–0.948, PDAC n = 209, healthy donors n = 80). d Scatterplot with Pearson correlation of CA19-9 and sCD40 serum levels from PDAC patients and healthy donors (Pearson correlation only applied for PDAC samples, PDAC n = 209, HD n = 80). e ROC of sCD40 subcohort with patients showing CA19-9 level below the threshold of 34 U/ml. AUC is significantly different to chance (P < 0.001, 0.701–0.881, PDAC n = 52, healthy donors n = 80). f ROC of sCD40 and CA19-9 combined based on logistic regression analysis with an AUC significantly different to chance (P < 0.001, CI 0.923–0.974, PDAC n = 209, healthy donors n = 80).
Fig. 3
Fig. 3. Correlation between sCD40 and tumor stage or treatment in PDAC patients.
a Serum level of sCD40 in different T stages. No significant differences could be measured (one-way ANOVA using Tukey’s multiple comparisons test, T1 vs. T2 P = 0.982, T1 vs. T3 P = 0.986, T1 vs. T4 P = 0.99, T2 vs. T3 P > 0.999, T2 vs. T4 P = 0.999, T3 vs. T4 P = 0.999). b Serum level of sCD40 in different N stages. No significant differences could be measured (one-way ANOVA using Tukey’s multiple comparisons test, N0 vs. N1 P = 0.958, N0 vs. N2 P = 0.337, N1 vs. N2 P = 0.133). c Serum levels of sCD40 compared between patients with M0 and M1 stage. No significant differences could be measured (two-tailed unpaired t test, M0 vs. M1 P = 0.623). d Serum levels of sCD40 in different UICC stages. No significant differences could be measured (one-way ANOVA using Tukey’s multiple comparisons test, UICC I vs. UICC II P = 0.323, UICC I vs. UICC III P = 0.185, UICC I vs. UICC IV P = 0.847, UICC II vs. UICC III P = 0.955, UICC II vs. UICC IV P = 0.931, UICC III vs. UICC IV P = 0.789). e Serum level of sCD40 compared between patients treated with primary resection (PR) or neoadjuvant chemotherapy (NEO) followed by surgery. Significant differences could be measured (two-tailed unpaired t test, PR vs. NEO P = 0.012).
Fig. 4
Fig. 4. sCD40 as a prognostic marker.
a Kaplan–Meier curve of patients with high or low sCD40 levels in the training cohort. Threshold of 0.835 ng/ml was applied. (Median survival of sCD40 low vs. high: 21.83 vs. 15.47 months, Log-rank P = 0.153, Gehan–Breslow–Wilcoxon P = 0.047). b Kaplan–Meier curve of patients with high or low sCD40 levels in the test cohort. Threshold of 0.835 ng/ml was applied. (Median survival of sCD40 low vs. high: 19.93 vs. 12.57 months, Log-rank P = 0.04, Gehan–Breslow–Wilcoxon P = 0.0138). c Kaplan–Meier curve of patients with high or low sCD40 levels in the complete validation cohort. Threshold of 0.835 ng/ml was applied. (Median survival of sCD40 low vs. high: 20.93 vs. 14.3 months, Log-rank P = 0.03, Gehan–Breslow–Wilcoxon P = 0.003). d Kaplan–Meier curve of patients with high or low sCD40 levels in the primary resected cohort. Threshold of 0.835 ng/ml was applied. (Median survival of sCD40 low vs. high: 21.67 vs. 14.97 months, Log-rank P = 0.183, Gehan–Breslow–Wilcoxon P = 0.036). e Kaplan–Meier curve of patients with high or low sCD40 levels in the neoadjuvant-treated cohort. Threshold of 0.835 ng/ml was applied. (Median survival of sCD40 low vs. high: 20.47 vs. 12.57 months, Log-rank P = 0.006, Gehan–Breslow–Wilcoxon P = 0.01).

References

    1. American Cancer Society. Cancer Facts & Figures 2022, Vol. 80 (American Cancer Society, 2022).
    1. Rahib L, et al. Projecting cancer incidence and deaths to 2030: the unexpected burden of thyroid, liver, and pancreas cancers in the United States. Cancer Res. 2014;74:2913–2921. - PubMed
    1. Robert C. A decade of immune-checkpoint inhibitors in cancer therapy. Nat. Commun. 2020;11:3801. - PMC - PubMed
    1. Sharma P, et al. The next decade of immune checkpoint therapy. Cancer Discov. 2021;11:838–857. - PubMed
    1. Le DT, et al. Mismatch repair deficiency predicts response of solid tumors to PD-1 blockade. Science. 2017;357:409–413. - PMC - PubMed