. 2023 Oct 14;14(1):6499.
doi: 10.1038/s41467-023-42293-4.

Oligodendrocyte dynamics dictate cognitive performance outcomes of working memory training in mice

Affiliations

Oligodendrocyte dynamics dictate cognitive performance outcomes of working memory training in mice

Takahiro Shimizu et al. Nat Commun. .

Abstract

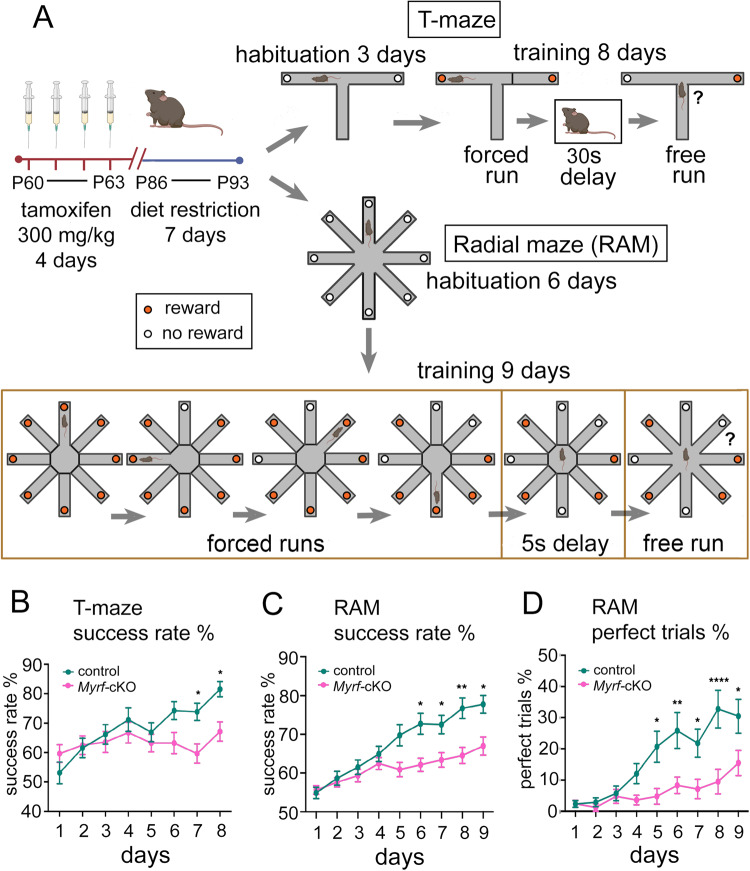
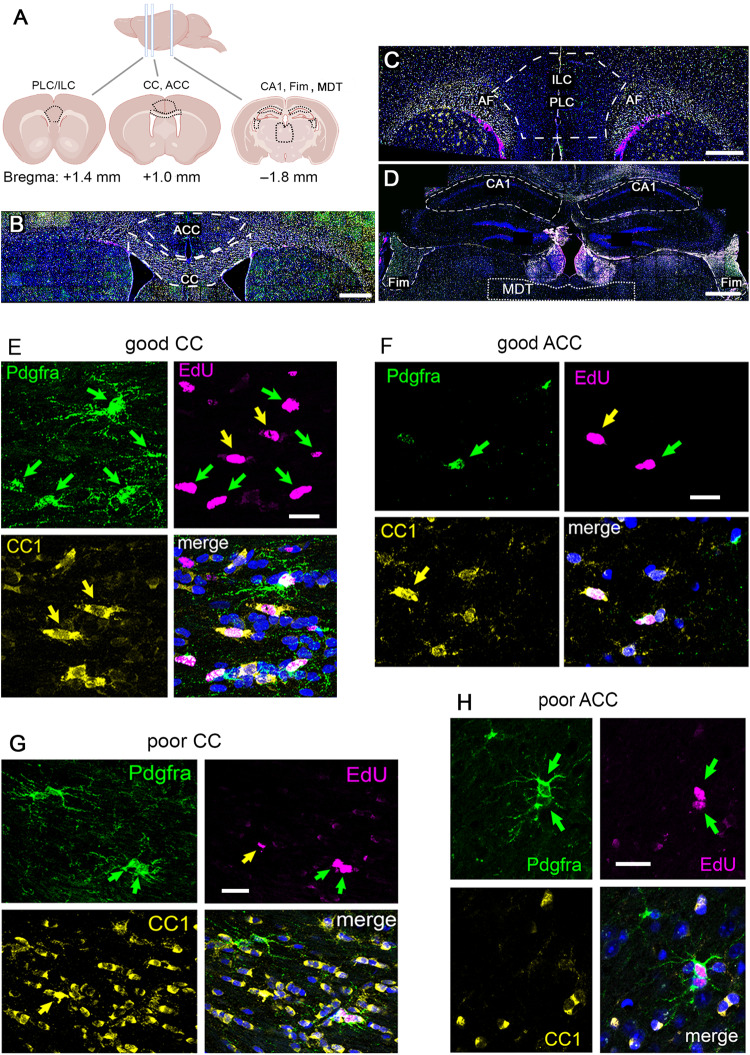
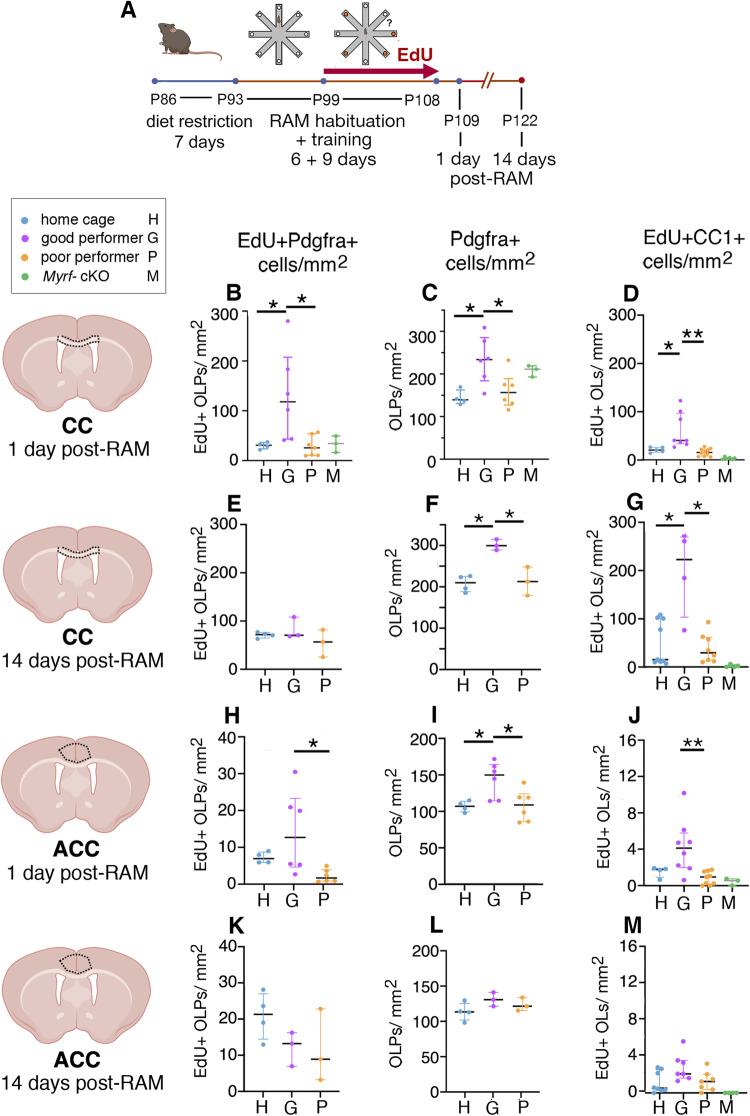
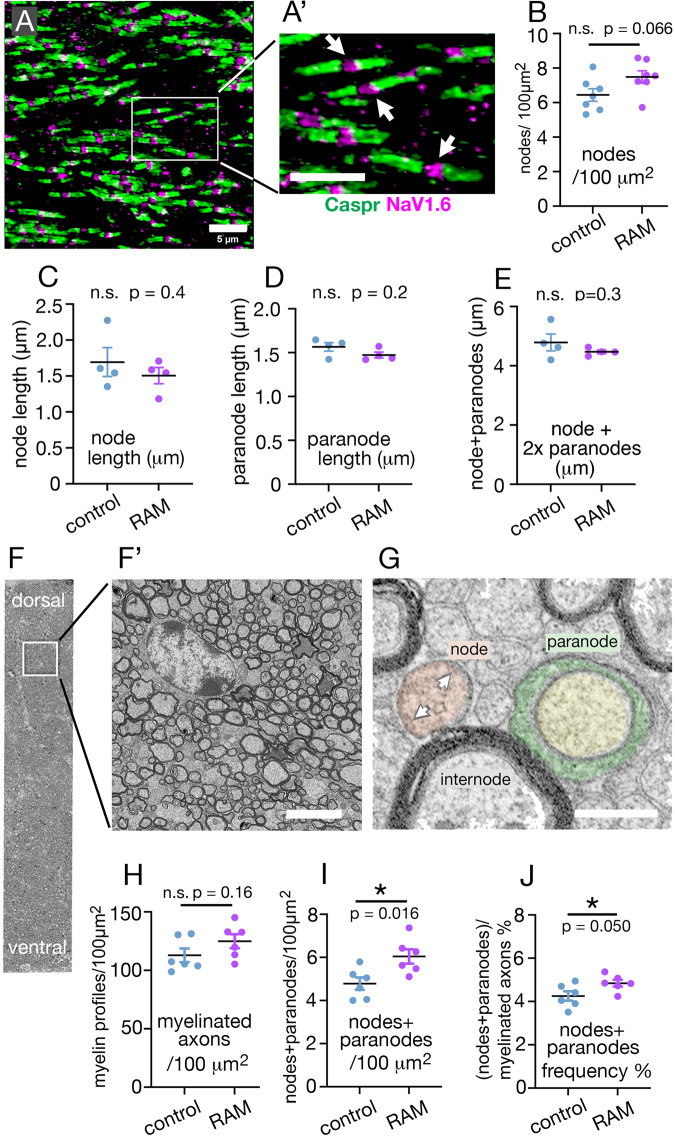
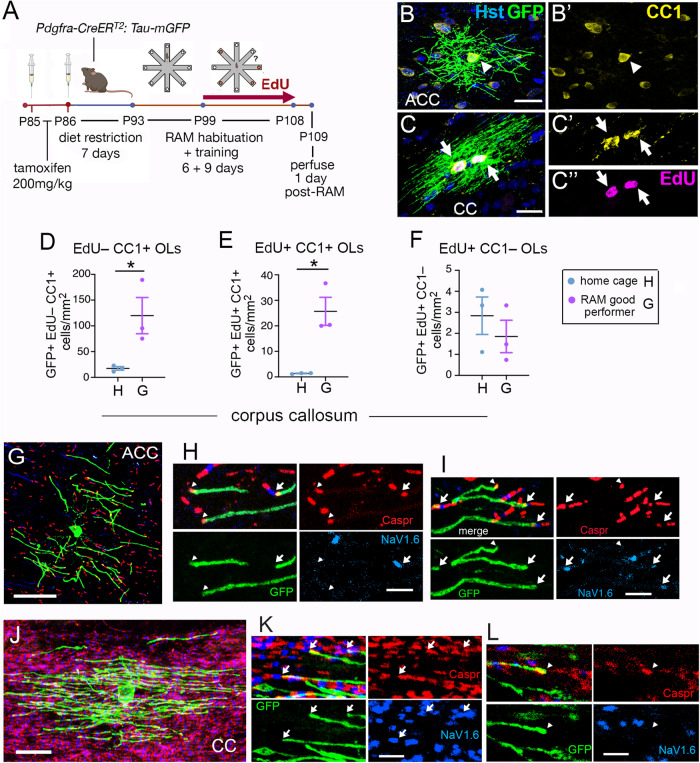
Previous work has shown that motor skill learning stimulates and requires generation of myelinating oligodendrocytes (OLs) from their precursor cells (OLPs) in the brains of adult mice. In the present study we ask whether OL production is also required for non-motor learning and cognition, using T-maze and radial-arm-maze tasks that tax spatial working memory. We find that maze training stimulates OLP proliferation and OL production in the medial prefrontal cortex (mPFC), anterior corpus callosum (genu), dorsal thalamus and hippocampal formation of adult male mice; myelin sheath formation is also stimulated in the genu. Genetic blockade of OL differentiation and neo-myelination in Myrf conditional-knockout mice strongly impairs training-induced improvements in maze performance. We find a strong positive correlation between the performance of individual wild type mice and the scale of OLP proliferation and OL generation during training, but not with the number or intensity of c-Fos+ neurons in their mPFC, underscoring the important role played by OL lineage cells in cognitive processing.


Conflict of interest statement

The authors declare no competing interests.

Figures

Fig. 1
Fig. 1. Working memory training requires OL generation.
A T-maze and radial arm maze (RAM) protocols (drawing created using BioRender). B Success rates of control (n = 26) and Myrf-cKO (n = 28) adult male mice during T-maze training. Controls improved their success rate over the 8 days of training whereas Myrf-cKOs barely improved [repeated measures 2-way ANOVA: time x genotype p = 0.0012, F(7, 364) = 3.50; time, p < 0.0001, F(7, 364) = 7.16; genotype, p = 0.066, F(1, 52) = 3.52]. Controls attained a significantly greater success rate on the final two days of T-maze training compared to Myrf-cKOs (Day 7: control 74% ± 2.9%, Myrf-cKO 60% ± 3.3%, p = 0.02. Day 8: control 82% ± 2.6%, Myrf-cKO 67% ± 3.3%, p = 0.009, Šídák’s post-test). C Success rates of control (n = 28) and Myrf-cKO (n = 29) adult male mice over 9 days of RAM training [repeated measures 2-way ANOVA: time x genotype v  < 0.0001, F(8, 440) = 7.41; time p < 0.0001, F(4, 239) = 39.8; genotype p = 0.009, F(1, 55) = 7.5]. Controls surpassed Myrf-cKOs on days 6-9 (e.g. Day 8: control 77% ± 3%, Myrf-cKO 65% ± 2% p = 0.006. Day 9: control 78% ± 2%, Myrf-cKO 67% ± 2%, p = 0.02. Šídák’s post-test). D Fraction (%) of trials over the full 9 days of RAM testing in which mice recorded no working memory errors (“perfect trials”) [repeated measures 2-way ANOVA: time x genotype p < 0.0001, F(8, 440) = 5.4; time p < 0.0001, F(8, 440) = 19; genotype p = 0.006, F(1, 55) = 8.1]. Control mice (n = 29) recorded more perfect trials than Myrf-cKOs (n = 28) on days 5-9 (e.g. Day 8: control 33% ± 6%, Myrf-cKO 10% ± 4%, p < 0.0001. Day 9: control 31% ± 5%, Myrf-cKO 16% ± 4%, p = 0.03, Šídák’s post-test.). Data are presented as mean ± s.e.m. n.s. not significant (p > 0.05), *p ≤ 0.05, **p ≤ 0.01, ****p ≤ 0.0001. Source data are provided as a Source Data file.
Fig. 2
Fig. 2. Immunofluorescence analysis of OL lineage cells.
A Coronal sections through the brains of RAM-trained mice (1- or 14-days post-training) or home cage controls were analyzed at the level of the anterior cingulate cortex (ACC) ( ~ Bregma +1.0 mm), prelimbic/ infralimbic cortex (PLC/ILC) ( ~ Bregma +1.4 mm), hippocampus (CA1), fimbria (Fim) and mediodorsal thalamus (MDT) ( ~ Bregma –1.8 mm) (Schematic created using BioRender). OL lineage cells were identified by immunolabelling with anti-Pdgfra (for OLPs) and monoclonal CC1 (for differentiated OLs), together with EdU histochemistry to identify recently-divided cells and their progeny. Sections were post-stained with Hoechst dye (blue) to label cell nuclei. B-D Low-magnification images illustrating the areas analyzed: (B) ACC and underlying anterior corpus callosum (CC), (C) PLC/ILC, (D) hippocampal CA1, Fim and MDT. E-H Representative higher-magnification images of OL lineage cells in the ACC and CC of mice that we categorized as either good- (E, F) or poor-performers (G, H) in the RAM task ( ≥ 10 or ≤5 “perfect trials” during the 9 days of RAM training/testing; n = 6 good- and n = 6 poor-performers). Green arrows, recently-divided EdU+ Pdgfra+ OLPs; yellow arrows newly-formed EdU+ CC1+ OLs. Micrographs are representative of more than 3 independent immunolabelling experiments. Scale bars: (B–D), 1 mm; (E–H), 20 μm.
Fig. 3
Fig. 3. Successful working memory training stimulates proliferation and differentiation of OLPs.
A Experimental protocol. Mice were from our Pdgfra-CreERT2: Myrf (flox) breeding colony. Myrf (flox/flox) and some Myrf (flox/+) received tamoxifen as in Fig. 1A while other Myrf (flox/+) did not. They were given EdU in their drinking water during radial arm maze (RAM) training and perfusion-fixed 1- or 14-days post-training. RAM-trained mice were characterized as good- or poor-performers based on whether they achieved ≥10 or ≤5 “perfect trials”, respectively, over the 9 days of RAM training. Home cage controls did not experience dietary restriction and were not exposed to the RAM at any time. B-D In the corpus callosum (CC) at 1-day post-RAM, the number-densities of proliferating OLPs (EdU+ Pdgfra+), all OLPs (Pdgfra+) and newly-formed OLs (EdU+CC1+) were all increased in good-performers relative to poor-performers. Note that in the best of the good-performers >90% OLPs proliferated (compare B, C). Poor-performers were indistinguishable from home cage controls. E-G In the CC at 14-days post-RAM densities of OLPs and newly-formed OLs were still elevated in good- versus poor-performers. The number of newly differentiated OLs was increased further from 1-day post-RAM because of continuing OLP differentiation post-RAM (compare D,G). H-J Also in the anterior cingulate cortex (ACC) at 1-day post-RAM proliferating OLPs (EdU+Pdgfra+), all OLPs (Pdgfra+) and newly-formed OLs (EdU+CC1+) were all more numerous in good- versus poor-performers, but by 14-days post-RAM all had returned to baseline (K-M). Corresponding data for prelimbic/ infralimbic cortex, mediodorsal thalamus, hippocampal CA1 and fimbria are shown in Supplementary Fig. S2. Data for Myrf-cKO mice (D, G, J, M), were included here primarily as a technical control for the experiments in Fig. 1, so they are not included in the statistical analysis. As expected, almost no new EdU+CC1+ OLs were produced in the Myrf-KOs. (B-M) x-axis labels are: H=home cage control, G=good performer, P=poor performer, M=Myrf-cKO, as also indicated in the key beneath panel (A). Data are presented as median ± 25%-75% interquartile range. p-values were determined by the Kruskal-Wallis non-parametric test, corrected for multiple comparisons using the Benjamini-Krieger-Yekutieli (BKY) false discovery rate test. *p ≤ 0.05, **p ≤ 0.01 (see Supplementary Data 1 for full statistics). Source data are provided as a Source Data file. Drawings were created using BioRender.
Fig. 4
Fig. 4. Working memory performance correlates with training-induced OLP proliferation and differentiation in individual mice.
The working memory performance of individual mice in the RAM (estimated by number of “perfect trials” during the 9 days of RAM training) correlates closely (R2 > 0.6) with the number-density of proliferating OLPs (Pdgfra+EdU+) counted on 1-day post-training in either their corpus callosum (CC) (A) or anterior cingulate cortex (ACC) (D), and with the density of newly-generated OLs (CC1+ EdU+) in the CC (C). Significant correlations (R2 ~ 0.5) were also observed between performance and OLP population densities (B, E). Lines of best fit (simple linear, least-squares regression) are drawn with 95% confidence intervals; R2 and n values are shown on graphs and in Supplementary Data 3, together with slopes and intercepts. Corresponding data for prelimbic/infralimbic cortex, mediodorsal thalamus, hippocampal CA1 and fimbria are shown in Supplementary Fig. S4. Source data are provided as a Source Data file. Drawings were created using BioRender.
Fig. 5
Fig. 5. Working memory training stimulates new myelin sheath production.
A Confocal images of coronal sections through anterior corpus callosum (CC) at the level of the anterior cingulate cortex (ACC) were immunolabelled for NaV1.6 (magenta) and Caspr (green) to visualize nodes and paranodes respectively. (A’) is a higher-magnification view of the area indicated in (A); arrows indicate nodes of Ranvier. These micrographs are representative of more than 3 independent immunolabelling experiments. B Node/paranode structures were counted in photographic images of 5 μm confocal stacks; there is a trend towards higher node/paranode density in good-performing RAM-trained mice (n = 7) compared to home-cage controls (n = 7). CE We measured the lengths of mature nodes of Ranvier as in Arancibia-Cárcamo et al. (see Methods). The mean lengths of nodes (C), paranodes (D) and complete nodal structures (node flanked by two paranodes, E) were all unchanged in RAM-trained mice (n = 4) compared to home-cage controls (n = 4). F Part of a wide-field EM backscatter image (parasagittal), including the entire dorsal-ventral extent of the CC, 600 μm from its anterior tip; (F’) is a higher-magnification image of the area indicated in (F). G EM profiles of myelinated fibres sectioned through a node (false-colour orange), a paranode (false-colour green/yellow) and a myelin internode. Nodes can be distinguished from unmyelinated axons by the presence of electron-dense material undercoating the axonal membrane (arrows). All myelin internode (M), node (N) and paranode (P) profiles were counted in single ~ 260 ×50 μm areas of 100 nm thick sections such as (F) for each individual RAM-trained or home-cage control mouse (n = 6 of each). H There was no significant change in myelinated axon (M + N + P) density in RAM-trained mice (n = 6) versus controls (n = 6), but there was a significant increase in the combined N + P density (I) and a marginally significant increase in the ratio (N + P)/(M + N + P) (“nodes + paranodes frequency”) (J). Together these data indicate that there are more nodal structures, hence more internodes in RAM-trained versus control mice and suggest that those extra internodes might be shorter than the majority, consistent with their being recently-formed. Data are presented as mean ± s.e.m. (Student’s two-tailed t-test). n.s. not significant (p > 0.05), * p ≤ 0.05, actual p-values specified in the Figure. Source data are provided as a Source Data file. Scale bars: A-A’, 5 μm; F’, 5 μm; G, 2 μm.
Fig. 6
Fig. 6. Working memory training stimulates production of myelin-forming OLs.
A Experimental protocol (drawing created using BioRender). Pdgfra-CreERT2: Tau-mGFP mice were given a lower than normal dose of tamoxifen (200 mg/kg on 2 consecutive days) immediately before dietary restriction followed by RAM habituation and training as before. EdU was given in the drinking water during RAM training and the mice were perfusion-fixed 1-day post-training. mGFP-expressing OLs (generated from Pdgfra+ OLPs post-tamoxifen) were double-immunolabelled with anti-GFP and monoclonal CC1, followed by EdU chemistry (B, C). Newly-formed GFP+ OLs with myelinating morphology were visualized in both the anterior cingulate cortex (ACC) (B) and anterior corpus callosum (CC) (C). The majority of GFP+ OLs was also CC1+ (B,C). Both EdU+ OLs (arrows) and EdU-negative OLs (arrowheads) were observed. D, E Number densities of GFP+ EdU CC1+ and GFP+ EdU+ CC1+ OLs with myelinating morphology were greatly increased in the corpus callosum of good RAM-performers (n = 3) relative to home cage controls (n = 3) [EdU OLs: 120 ± 35 OLs/mm2 vs 17 ± 3 OLs/mm2 in good-performers vs controls (p = 0.012). EdU+ OLs: 26 ± 6 OLs/mm2 vs 1.4 ± 0.12 OLs/mm2 in good-performers vs controls (p = 0.044). means ± s.e.m., Student’s two-tailed t-tests]. F Small numbers of GFP+ EdU+ CC1 OLs (presumably pre-myelinating) were also observed in the corpus callosum of both good RAM-performers and home cage controls (n = 3 for both). G-L NaV1.6 and Caspr immunolabelling showed that some GFP+ new myelin sheaths in both ACC and CC terminated in normal-appearing paranode/node structures with clustered NaV1.6 (arrows), while others terminated in heminodes that did not appear to cluster NaV1.6 (arrowheads) (n = 3). Micrographs are representative of more than 3 independent immunolabelling experiments. Data are presented as mean ± s.e.m. Source data are provided as a Source Data file. Scale bars: 20 µm (B, C, G, J), 2 µm (H, I, K, L).
Fig. 7
Fig. 7. Working memory performance and c-Fos immunoreactivity in the mPFC.
AC c-Fos immunolabelling in the ACC of good- and poor-performing mice (n = 6 for both) (A, B), perfusion-fixed immediately following 9 days of RAM training, alongside a home-cage control (n = 4) (C). C’ is a higher-magnification view of the area outlined in (C). D Average fluorescence intensities (arbitrary units, A.U.) and (E) number-densities (cells/mm2) of c-Fos+ neuronal nuclei in the ACC of good- and poor-performers and home cage controls (median and 25%-75% interquartile range (IQR) is shown). [Kruskal-Wallis non-parametric statistics: c-Fos intensities (arbitrary units), median (IQR): good 14 (10-19); poor 30 (7-35), q = 0.61, p = 0.33; home cage 22 (9-39), q = 0.61, p = 0.39, H-statistic 1.2. number of c-Fos+ neurons per 100 µm2, median (IQR): good 46 (29-68); poor 98 (46-129), q = 0.23, p = 0.15; home cage 111 (35–238), q = 0.23, p = 0.13, H-statistic 3.1.]. F, G The working memory performances of individual mice in the RAM (estimated by number of “perfect trials” during the 9 days of RAM training) were plotted against the mean fluorescence intensities (F) or number-densities (G) of c-Fos+ neuronal nuclei. Lines of best fit (simple linear, least-squares regression) are drawn with 95% confidence intervals; R2 and n values are shown. There was a weak inverse correlation between RAM performance and the density of c-Fos+ neurons in the ACC (R2 = 0.21). HK In the same mice there was a strong positive correlation between RAM performance and OLP proliferation in the CC and the ACC (R2 = 0.68 and 0.43, respectively) and weaker correlations with the density of newly-generated OLs in both regions (R2 = 0.27 in both CC and ACC). LO There were no obvious correlations between the number of c-Fos+ neurons in the ACC and the numbers of either newly-divided EdU+, Pdgfra+ OLPs (L, M) or newly-differentiated EdU+, CC1+ OLs (N, O) in the ACC or the adjacent CC. Full Kruskal-Wallis statistics are given in Supplementary Data 4. Source data are provided as a Source Data file.

References

    1. Bergles DE, Richardson WD. Oligodendrocyte development and plasticity. Cold Spring Harb. Perspect. Biol. 2015;8:a020453. - PMC - PubMed
    1. Bergles DE, Roberts JD, Somogyi P, Jahr CE. Glutamatergic synapses on oligodendrocyte precursor cells in the hippocampus. Nature. 2000;405:187–191. - PubMed
    1. Kougioumtzidou, E. et al. Signalling through AMPA receptors on oligodendrocyte precursors promotes myelination by enhancing oligodendrocyte survival. Elife6, (2017). 10.7554/eLife.28080. - PMC - PubMed
    1. Gibson EM, et al. Neuronal activity promotes oligodendrogenesis and adaptive myelination in the mammalian brain. Science. 2014;344:1252304. - PMC - PubMed
    1. Mitew S, et al. Pharmacogenetic stimulation of neuronal activity increases myelination in an axon-specific manner. Nat. Commun. 2018;9:306. - PMC - PubMed

Publication types