

Investigation of LGALS2 expression in the TCGA database reveals its clinical relevance in breast cancer immunotherapy and drug resistance
- PMID: 37838802
- PMCID: PMC10576795
- DOI: 10.1038/s41598-023-44777-1
Investigation of LGALS2 expression in the TCGA database reveals its clinical relevance in breast cancer immunotherapy and drug resistance
Abstract
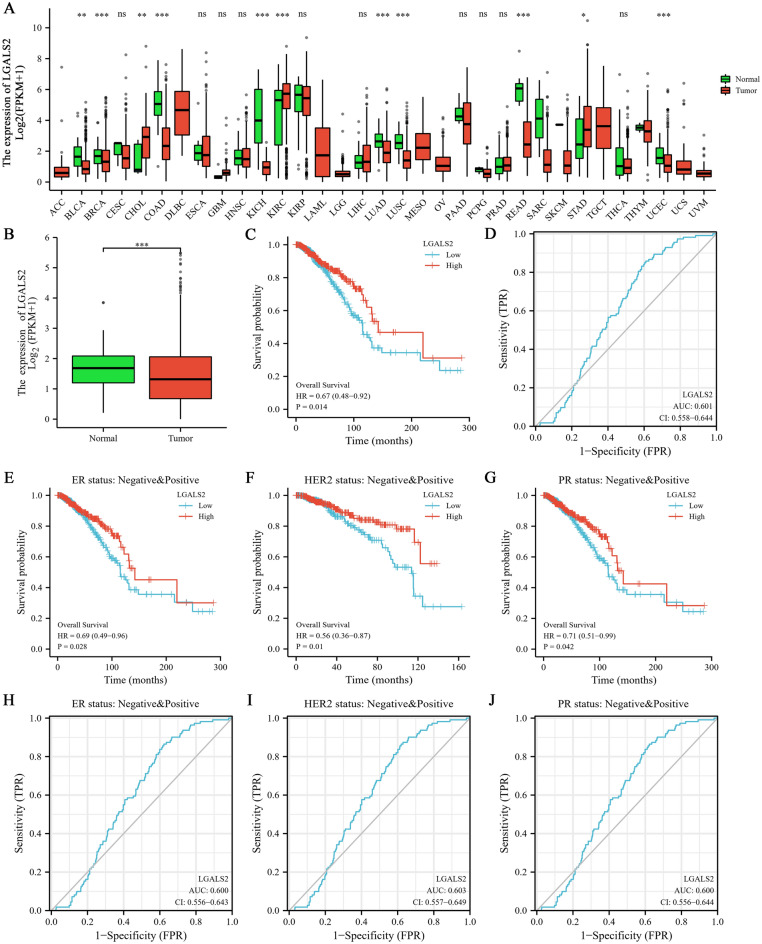
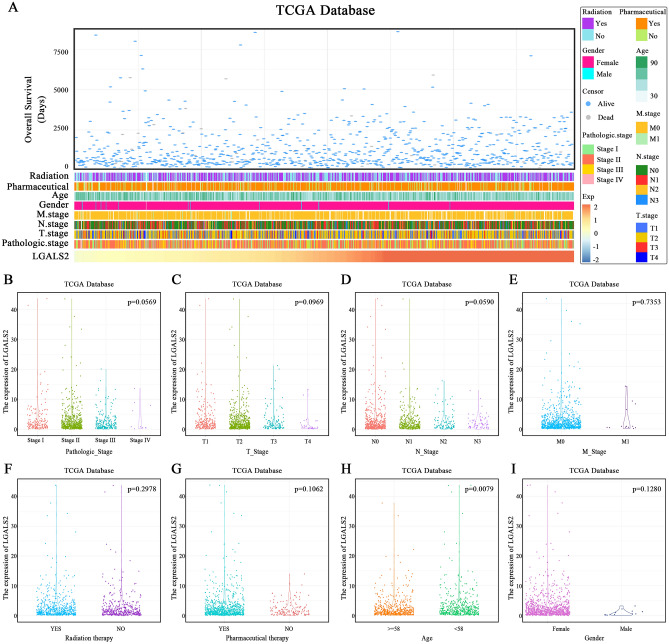
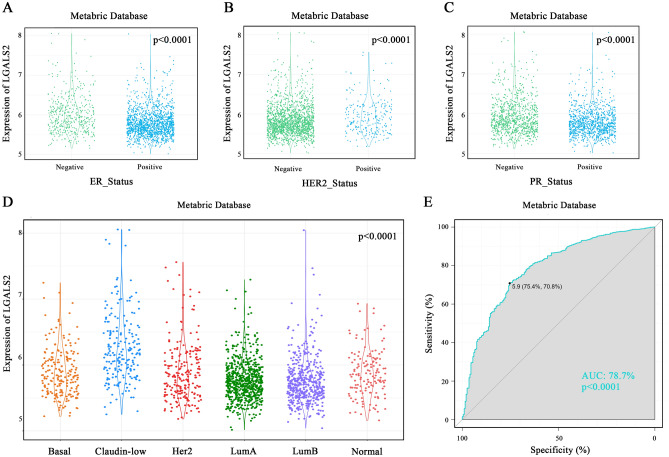
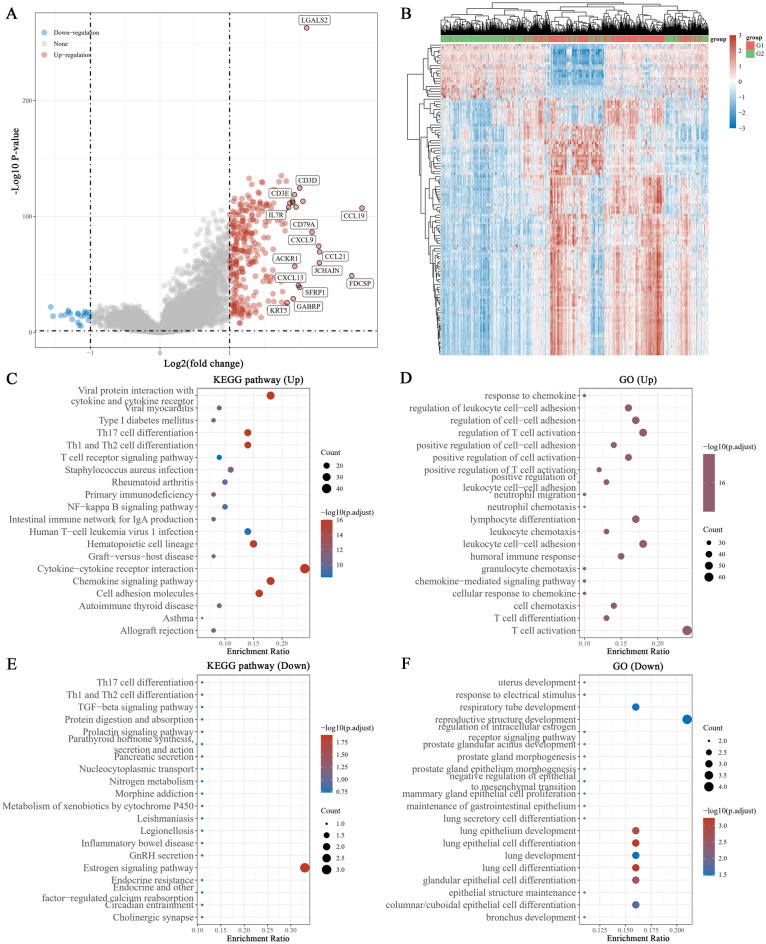
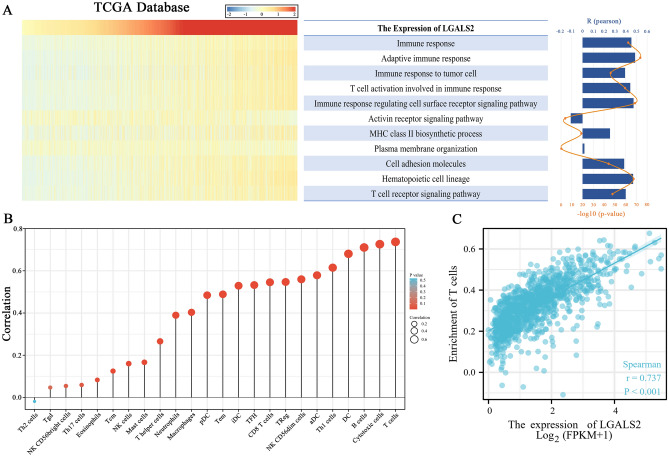
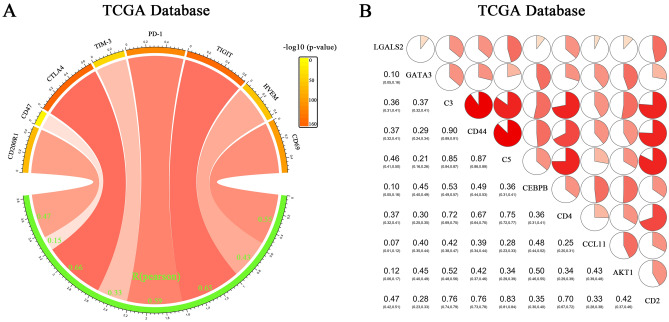
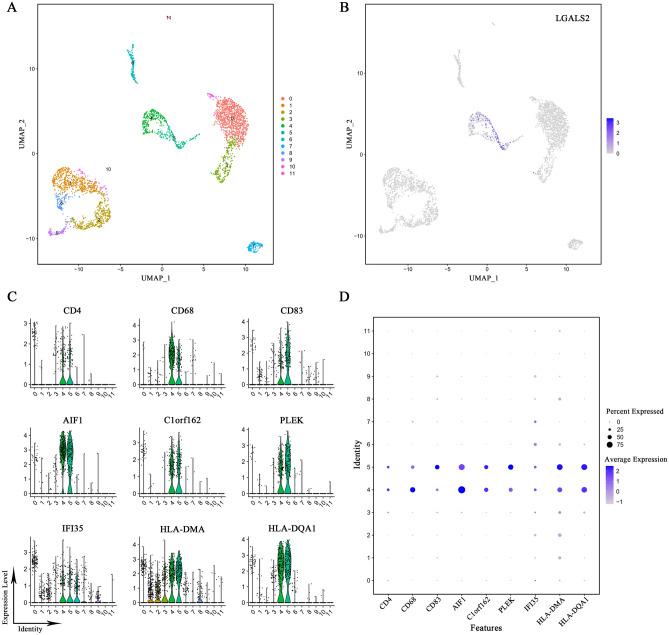
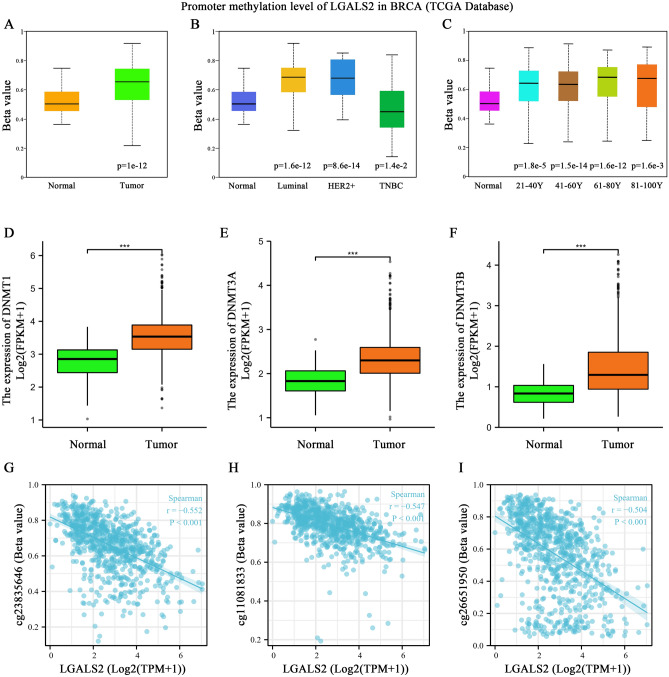
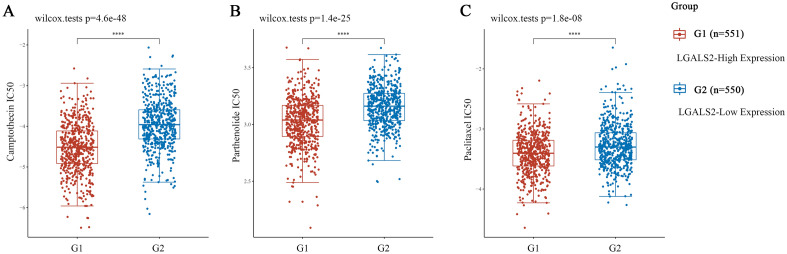
Breast cancer (BRCA) is known as the leading cause of death in women worldwide and has a poor prognosis. Traditional therapeutic strategies such as surgical resection, radiotherapy and chemotherapy can cause adverse reactions such as drug resistance. Immunotherapy, a new treatment approach with fewer side effects and stronger universality, can prolong the survival of BRCA patients and even achieve clinical cure. However, due to population heterogeneity and other reasons, there are still certain factors that limit the efficacy of immunotherapy. Therefore, the importance of finding new tumor immune biomarker cannot be emphasized enough. Studies have reported that LGALS2 was closely related to immunotherapy efficacy, however, it is unclear whether it can act as an immune checkpoint for BRCA immunotherapy. In the current study, changes in LGALS2 expression were analyzed in public datasets such as TCGA-BRCA. We found that LGALS2 expression was associated with immune infiltration, drug resistance and other characteristics of BRCA. Moreover, high LGALS2 expression was closely related to immunotherapy response, and was associated with methylation modifications and clinical resistance for the first time. These findings may help to elucidate the role of LGALS2 in BRCA for the development and clinical application of future immunotherapy strategies against BRCA.
© 2023. Springer Nature Limited.
Conflict of interest statement
The authors declare no competing interests.
Figures
Similar articles
-
Oncogenic signaling pathway-related long non-coding RNAs for predicting prognosis and immunotherapy response in breast cancer.Front Immunol. 2022 Aug 4;13:891175. doi: 10.3389/fimmu.2022.891175. eCollection 2022. Front Immunol. 2022. PMID: 35990668 Free PMC article.
-
ADRB1 was identified as a potential biomarker for breast cancer by the co-analysis of tumor mutational burden and immune infiltration.Aging (Albany NY). 2020 Nov 21;13(1):351-363. doi: 10.18632/aging.104204. Epub 2020 Nov 21. Aging (Albany NY). 2020. PMID: 33234738 Free PMC article.
-
GNPNAT1 is a potential biomarker correlated with immune infiltration and immunotherapy outcome in breast cancer.Front Immunol. 2023 May 5;14:1152678. doi: 10.3389/fimmu.2023.1152678. eCollection 2023. Front Immunol. 2023. PMID: 37215111 Free PMC article.
-
An overview on breast cancer genetics and recent innovations: Literature survey.Breast Dis. 2021;40(3):143-154. doi: 10.3233/BD-201040. Breast Dis. 2021. PMID: 33867352 Review.
-
Cancer immunotherapy resistance based on immune checkpoints inhibitors: Targets, biomarkers, and remedies.Drug Resist Updat. 2020 Dec;53:100718. doi: 10.1016/j.drup.2020.100718. Epub 2020 Jul 15. Drug Resist Updat. 2020. PMID: 32736034 Review.
Cited by
-
Integrated bioinformatic analysis identifies GADD45B as an immune-related prognostic biomarker in skin cutaneous melanoma.Hereditas. 2025 May 11;162(1):74. doi: 10.1186/s41065-025-00437-0. Hereditas. 2025. PMID: 40350499 Free PMC article.
-
Deciphering the role of LGALS2: insights into tertiary lymphoid structure-associated dendritic cell activation and immunotherapeutic potential in breast cancer patients.Mol Cancer. 2024 Sep 30;23(1):216. doi: 10.1186/s12943-024-02126-4. Mol Cancer. 2024. PMID: 39350165 Free PMC article.
-
Neurotrophic Receptor Tyrosine Kinase 3 as a Prognostic Biomarker in Breast Cancer Using Bioinformatic Analysis.Medicina (Kaunas). 2025 Mar 8;61(3):474. doi: 10.3390/medicina61030474. Medicina (Kaunas). 2025. PMID: 40142285 Free PMC article.
-
The assessment of breast cancer biomarkers in diagnosis, prognosis and treatment monitoring: integrated analysis.J Cancer Res Clin Oncol. 2025 Aug 22;151(8):233. doi: 10.1007/s00432-025-06271-1. J Cancer Res Clin Oncol. 2025. PMID: 40844552 Free PMC article. Review.
References
Publication types
MeSH terms
Substances
LinkOut - more resources
Full Text Sources
Medical
