. 2023 Oct 14;13(1):17470.
doi: 10.1038/s41598-023-44926-6.

Rapid detection of vaccinia virus using biofunctionalized fiber-optic ball-tip biosensors

Affiliations

Rapid detection of vaccinia virus using biofunctionalized fiber-optic ball-tip biosensors

Aida Rakhimbekova et al. Sci Rep. .

Abstract

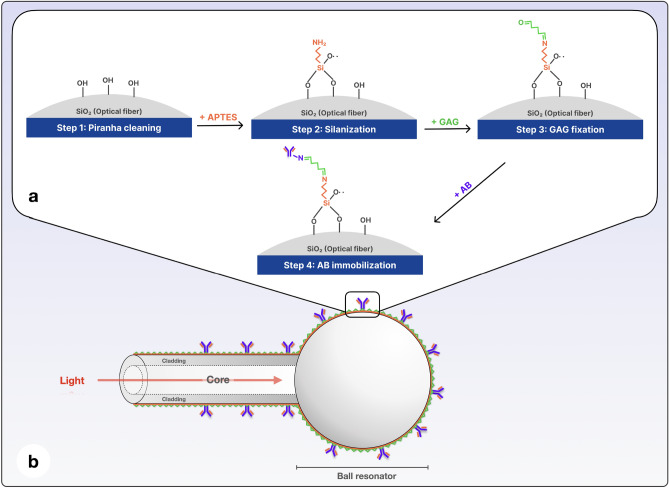
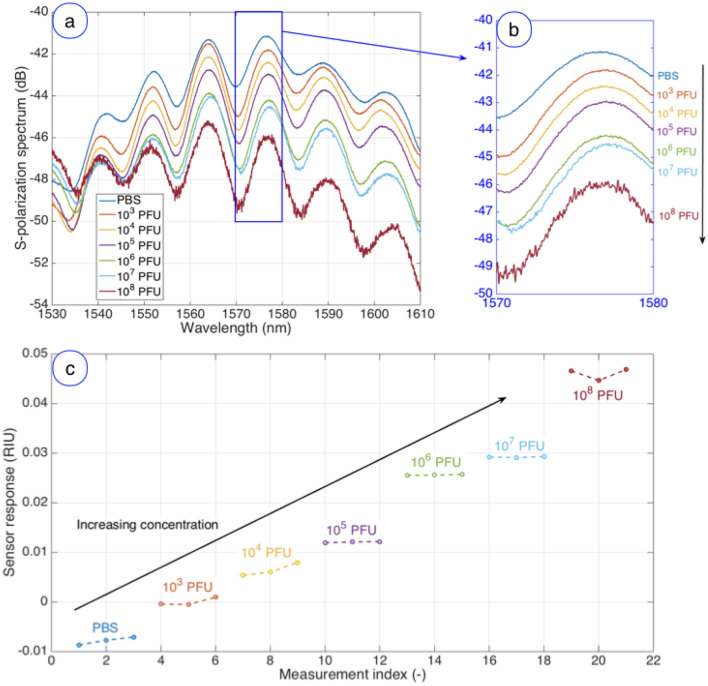
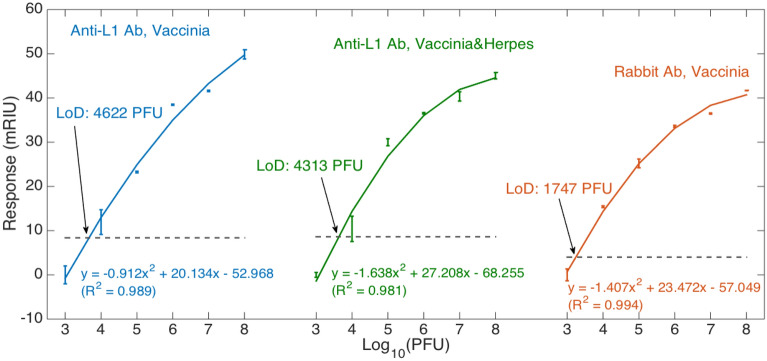
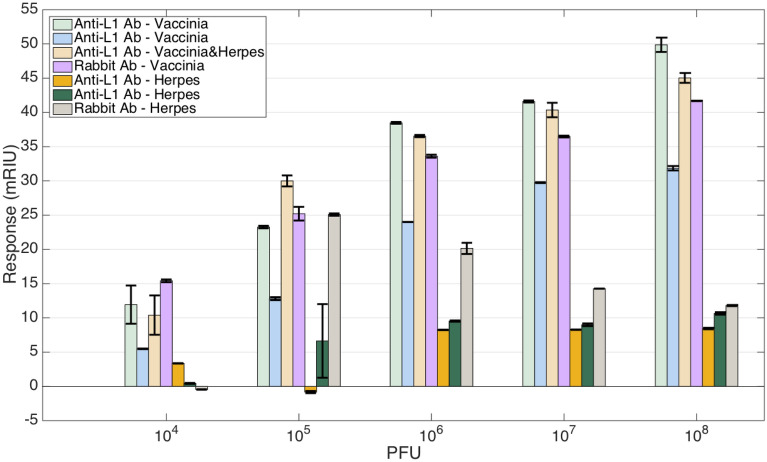
In this work, we present the development and biofunctionalization of a fiber-optic ball-resonator biosensor for the real-time detection of vaccinia poxvirus. We fabricated several ball-tip resonators, functionalized through a silanization process to immobilize two bioreceptors: the monoclonal anti-L1R antibody targeting the L1R protein, and the polyclonal rabbit serum antibodies targeting the whole vaccinia virus (VV) pathogen. Experimental measurements were carried out to detect VV in concentrations from 103 to 108 plaque-forming units (PFU), with a limit of detection of around 1.7-4.3 × 10³ PFU and a log-quadratic pattern, with a response up to 5 × 10⁻⁴ RIU (refractive index units). The specificity was assessed against herpes simplex virus, used as a non-specific control, with the best results obtained with anti-L1R monoclonal antibodies, and through the detection of vaccinia virus/herpes simplex-1 combination. The obtained results provide a real-time viral recognition with a label-free sensing platform, having rapid response and ease of manufacturing, and paving the road to the seamless detection of poxviruses affecting different human and animal species using optical fibers.


Conflict of interest statement

The authors declare no competing interests.

Figures

Figure 1
Figure 1
Biofunctionalization process: (a) Surface biofunctionalization steps on the fiber surface; (b) Schematic of a biofunctionalized fiber optic BR sensor.
Figure 2
Figure 2
Set up of the experiment: (a) Computer used for data acquisition; (b) OBR; (c) Biological safety cabinet; (d) Experimental installation; (e) Intravenous catheter fixed on a scaffold box with a biosensor inside and insulin syringe for injection of prepared viral concentrations.
Figure 3
Figure 3
Detection of the vaccinia virus at various concentrations through a ball resonator functionalized with anti-L1 antibodies. (a) S-polarization spectrum, measured for each concentration of vaccinia from 103 to 108 PFU and for the reference value in PBS. (b) Inset on the highlighted blue region (1570–1580 nm) containing the most prominent spectral feature, i.e. the spectral peak around 1576.5 nm. (c) Timeline of the vaccinia virus detection, reporting the response of the sensor over time, for the reference level (PBS) and increasing the virus concentration from 103 to 108 PFU.
Figure 4
Figure 4
Detection of VV at different concentrations through a ball resonator functionalized with rabbit serum antibodies. (a) S-polarization spectrum, measured for each concentration of VV from 103 to 108 PFU and for for the reference value in PBS. (b) Inset on the highlighted green region (1580–1590 nm) containing the most prominent spectral feature, i.e. the spectral peak around 1583 nm. (c) Timeline of VV detection, reporting the response of the sensor over time, for the reference level (PBS) and by increasing the virus concentration from 103 to 108 PFU.
Figure 5
Figure 5
Response of different probes in the various measurement conditions, and limit of detection identification. The chart shows the sensor responses, obtained by normalizing the intensity change by the estimated sensitivity, for each concentration of vaccinia. Charts report the measured data (markers = average data; error bars =  ± standard deviation) and a log-quadratic fit obtained by polynomial regression (R2 > 0.98). Left/blue = probe functionalized with Anti-L1 antibodies measuring vaccinia; center/green = probe functionalized with Anti-L1 antibodies measuring vaccinia and herpes at the same concentration; right/red = probe functionalized with rabbit antibodies measuring vaccinia. Grey horizontal lines show, for each sensor, the limit of response yLoD = yblank + 3σmax (standard deviation obtained through 3 consecutive measurements).
Figure 6
Figure 6
Comparison of the detection of vaccinia and specificity to herpes virus for all probes. For each vaccinia, herpes, or vaccinia/herpes mixture concentration ranging from 104 to 108 PFU the chart shows the average response from reference level (error bars =  ± standard deviation). The data report four sensors used for measurements of vaccinia (respectively, two sensors with anti-L1 antibodies measuring vaccinia, one sensor with anti-L1 antibodies measuring vaccinia/herpes mixture, and one sensor with rabbit antibodies measuring vaccinia), and three sensors for control reporting the response to herpes virus (respectively, two sensors with anti-L1 antibodies measuring herpes, and one sensor with rabbit antibodies measuring herpes).

References

    1. Matheri AN, Belaid M, Njenga CK, Ngila JC. Water and wastewater digital surveillance for monitoring and early detection of the COVID-19 hotspot: industry 4.0. Int. J. Environ. Sci. Technol. 2023;20:1095–1112. doi: 10.1007/s13762-022-03982-7. - DOI - PMC - PubMed
    1. Santiago I. Trends and innovations in biosensors for COVID-19 mass testing. Chem. Bio. Chem. 2020;21:2880–2889. doi: 10.1002/cbic.202000250. - DOI - PMC - PubMed
    1. Mohit E, Rostami Z, Vahidi H. A comparative review of immunoassays for COVID-19 detection. Exp. Rev. Clin. Immunol. 2021;17:573–599. doi: 10.1080/1744666X.2021.1908886. - DOI - PubMed
    1. Bhalla N, Pan Y, Yang Z, Payam AF. Opportunities and challenges for biosensors and nanoscale analytical tools for pandemics: COVID-19. ACS Nano. 2020;14:7783–7807. doi: 10.1021/acsnano.0c04421. - DOI - PMC - PubMed
    1. Lukose J, Chidangil S, George SD. Optical technologies for the detection of viruses like COVID-19: Progress and prospects. Biosens. Bioelectron. 2021;178:113004. doi: 10.1016/j.bios.2021.113004. - DOI - PMC - PubMed

Publication types