. 2023 Oct 16;8(1):395.
doi: 10.1038/s41392-023-01639-6.

Epigenetic regulation of TP53 is involved in prostate cancer radioresistance and DNA damage response signaling

Affiliations

Epigenetic regulation of TP53 is involved in prostate cancer radioresistance and DNA damage response signaling

Catarina Macedo-Silva et al. Signal Transduct Target Ther. .

Abstract

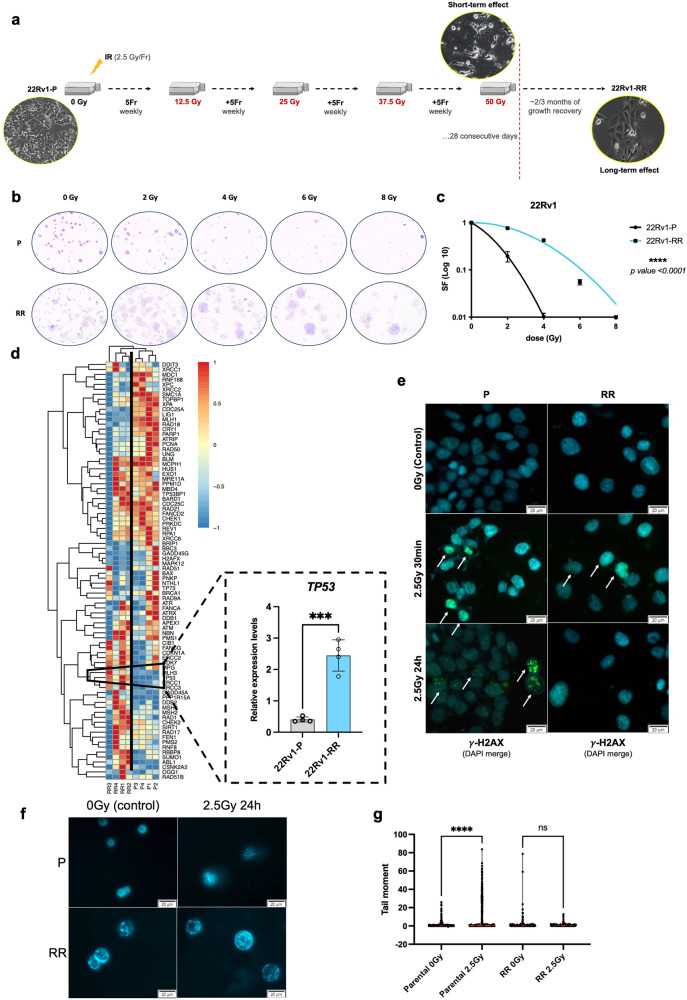
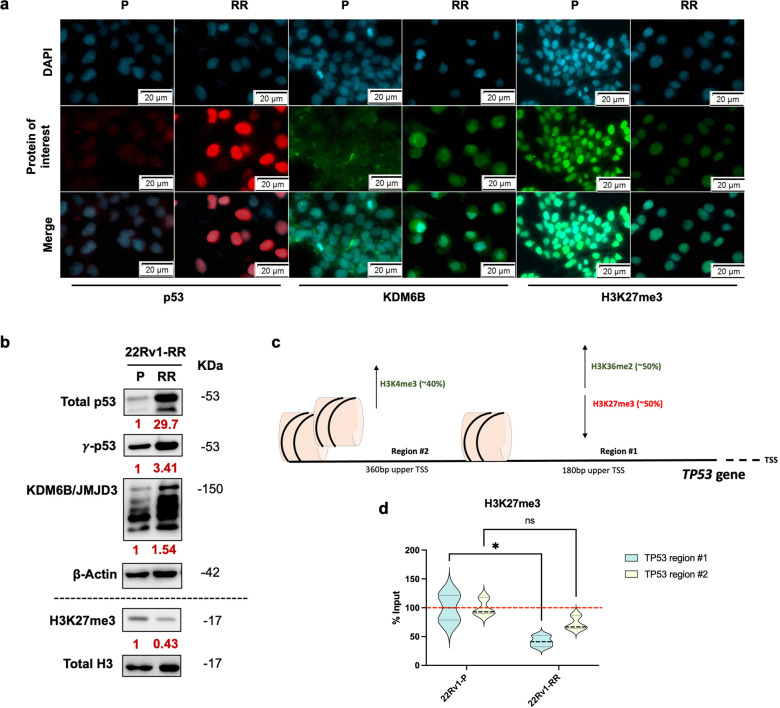
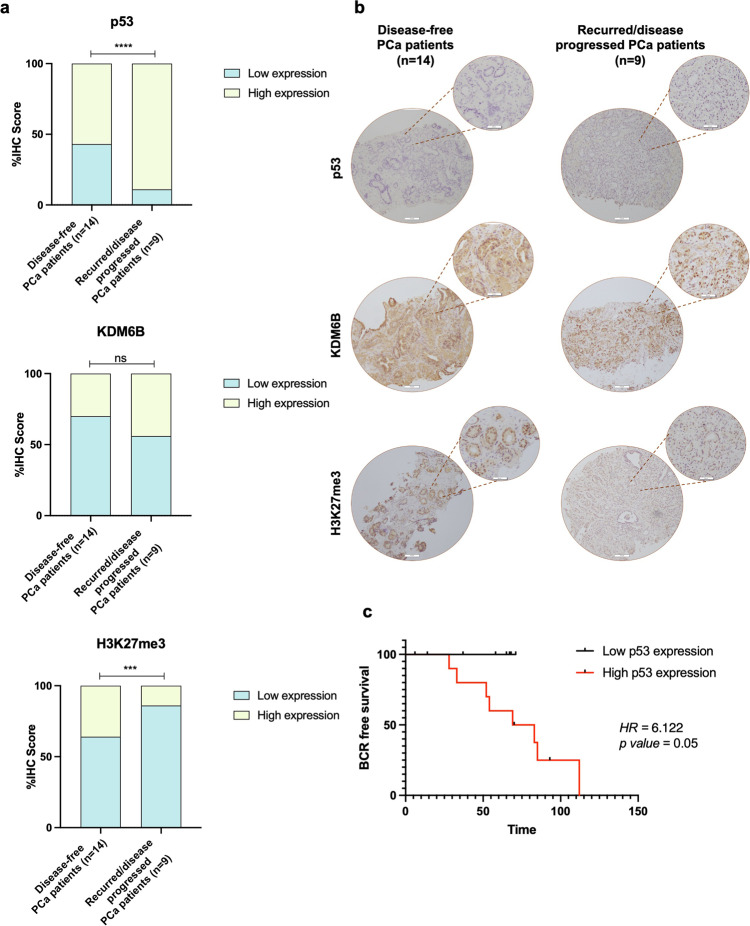
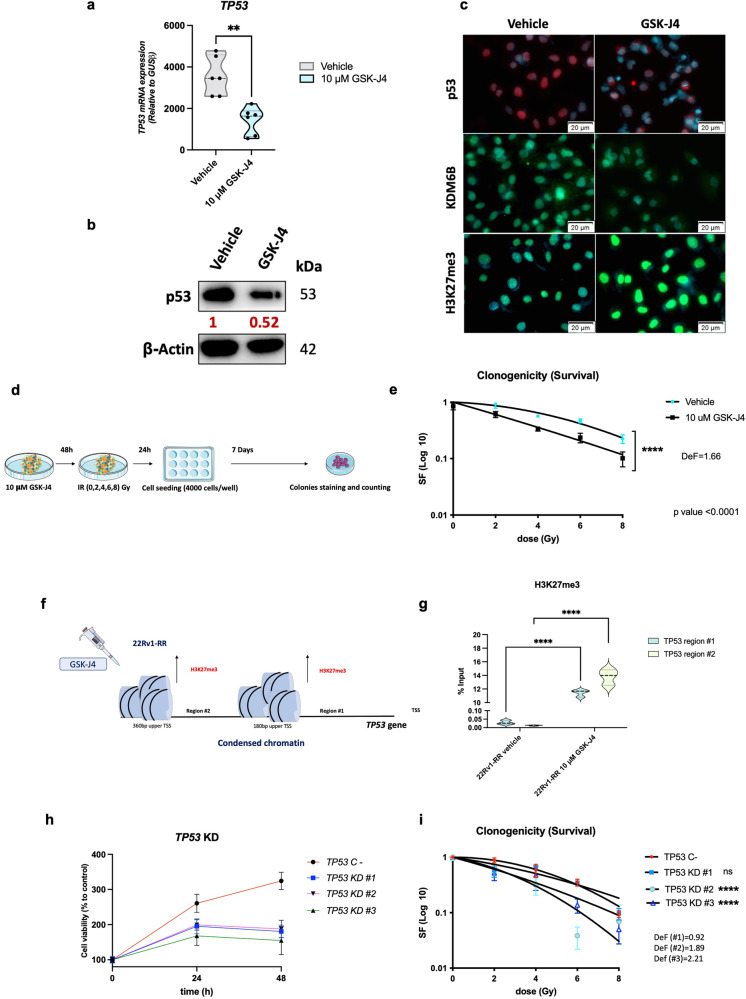
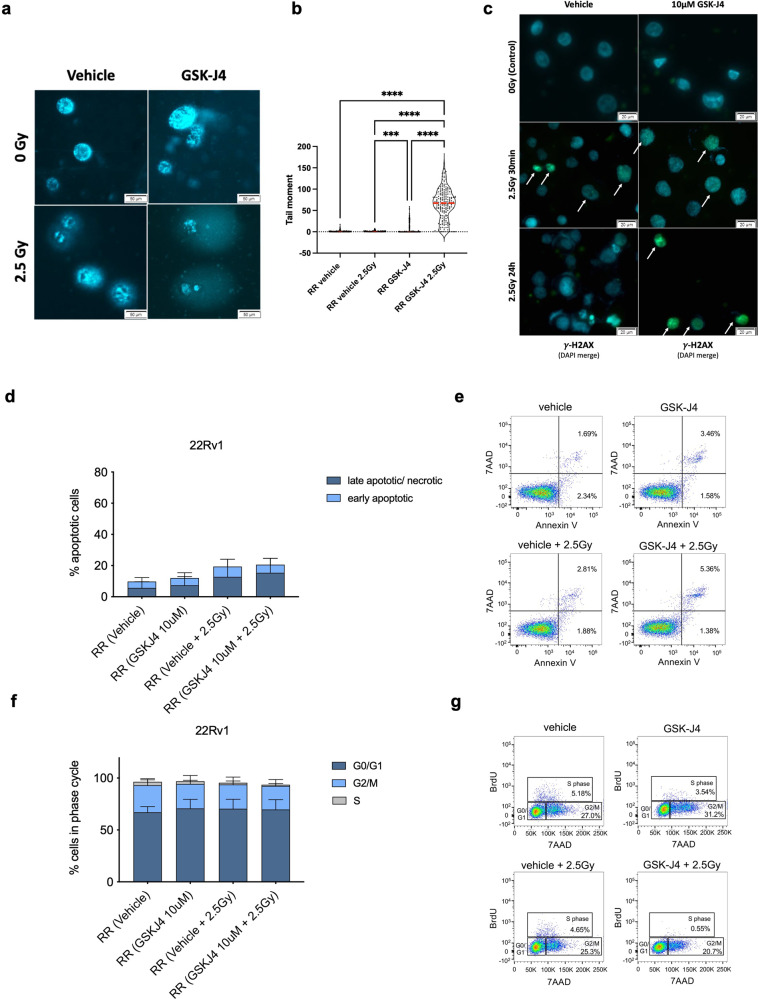
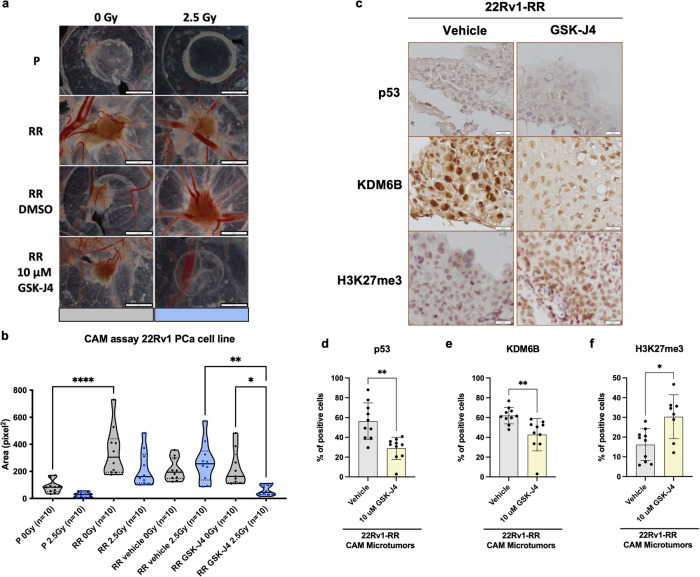
External beam radiotherapy (RT) is a leading first-line therapy for prostate cancer (PCa), and, in recent years, significant advances have been accomplished. However, RT resistance can arise and result in long-term recurrence or disease progression in the worst-case scenario. Thus, making crucial the discovery of new targets for PCa radiosensitization. Herein, we generated a radioresistant PCa cell line, and found p53 to be highly expressed in radioresistant PCa cells, as well as in PCa patients with recurrent/disease progression submitted to RT. Mechanism dissection revealed that RT could promote p53 expression via epigenetic modulation. Specifically, a decrease of H3K27me3 occupancy at TP53 gene promoter, due to increased KDM6B activity, was observed in radioresistant PCa cells. Furthermore, p53 is essential for efficient DNA damage signaling response and cell recovery upon stress induction by prolonged fractionated irradiation. Remarkably, KDM6B inhibition by GSK-J4 significantly decreased p53 expression, consequently attenuating the radioresistant phenotype of PCa cells and hampering in vivo 3D tumor formation. Overall, this work contributes to improve the understanding of p53 as a mediator of signaling transduction in DNA damage repair, as well as the impact of epigenetic targeting for PCa radiosensitization.


Conflict of interest statement

The authors declare no competing interests.

Figures

Fig. 1
Fig. 1
DNA damage signaling in radioresistant 22Rv1 (RR) PCa cell lines. a Schematic representation of 22Rv1-RR in vitro generation upon 20 fractions of 2.5 Gy for 28 consecutive days for a total dose of 50 Gy. Cells recover the growth properties within ~2–3 months in culture after the acute effect of ionizing radiation. Morphological differences were observed in cells between short-term and long-term effect of ionization. b Representative images of the stained colonies submitted to a range of 0 to 8 Gy. Images were taken by stereomicroscope Olympus S2X16 using a digital camera Olympus SC180, 0.7×. c Cell survival fraction of 22Rv1-RR and parental (P) cells represented through linear-quadratic model (LQ = (S = e – (xD + BD2))), ****P value < 0.0001. d Heatmap of RT2 Profiler Human DNA Damage Signaling Pathway PCR array comparing between 22Rv1-P and 22Rv1-RR samples (four biological replicates), highlighting relative mRNA expression levels of TP53, normalized by HPRT1 gene expression levels (housekeeping). In blue, less expressed samples (−1) and in red, high expressed samples (1). Results are presented as mean ± SD of at least three independent experiments. ***P value < 0.001. e Immunofluorescence staining of γ-H2AX foci (merged with DAPI for nuclei staining) in 22Rv1-P and RR cells control (0 Gy) and after 2.5 Gy IR (30 min and 24 h after). Images were taken using Olympus IX51 microscope at ×400 magnification (scale bar 20 μm). f, g Effect of 2.5 Gy irradiation treatment in DNA damage of 22Rv1-P and RR cells by comet assay. The results are the mean of at least 100 comets per condition. ns not significant; **P value < 0.01; ***P value < 0.001; ****P value < 0.0001. Representative images of the DAPI-stained single cells were taken using Olympus IX51 microscope at 400x magnification (scale bar 20 μm). The graph represents tail moment which means tail length × % of DNA in the tail. Red line represents the median value. Fr fraction, IR ionizing radiation, P parental, RR radioresistant
Fig. 2
Fig. 2
Epigenetic regulation of TP53 gene promoter. a Nuclear immunofluorescent staining of p53 (red) and H3K27me3 (green) and cytoplasm/nuclear staining of KDM6B (green), for 22Rv1-P and 22Rv1-RR cells. DAPI images represent the nucleus location. Merge images represent the merge of DAPI and images of protein of interest. Images were taken using Olympus IX51 microscope at 400x magnification (scale bar 20 μm). b Total protein levels of p53 (53 kDa), γ-p53 (53 kDa), and KDM6B/JMJD3 (150 kDa) for 22Rv1-P and RR cells. β-actin (42 kDa) was used as loading control (upper). Histone protein levels of H3K27me3 (17 kDa) for 22Rv1-P and RR cells. Total H3 (17 kDa) was used as a loading control (down). The values below each target represent the optical density average of the fold change between 22Rv1-RR and 22Rv1-P, measured using ImageJ tools. The images were taken by Chemidoc detection system (Biorad, Berkeley, California). Optical density values were obtained using ImageJ software version 1.53 (National Institutes of Health). Values are representative of RR vs. P of at least three independent replicates. c Representative scheme of TP53 gene promoter under epigenetic regulation. Transcription activation-related markers are marked in green and transcription repression-related markers in red. d The graphs represent H3K27me3 %input values (ChIP-qPCR) at TP53 gene promoter in regions #1 and #2 (180 bp and 360 bp upper TSS, respectively). The violin plots depict mean ± SD of at least three independent replicates. ns, non-significant; *P value < 0.05; ***P value < 0.001; ****P value < 0.0001. bp base pairs, P parental, RR radioresistant, TSS transcription starting site
Fig. 3
Fig. 3
p53, KDM6B, and H3K27me3 immunoexpression in a series of PCa tissues from patients who experience or not recurrences after RT treatment. a p53, KDM6B, and H3K27me3 IHC score values comparing recurrent/progressive disease with disease-free PCa patients, represented by contingency graphs. Fisher’s exact test was used to determine statistically significant differences between the two groups. ns non-significant; ***P value < 0.001; ****P value < 0.0001. b Representative IHC images for p53, KDM6B, and H3K27me3 protein expression in PCa tissues for both groups of disease-free and recurrent/progressive PCa patients. Images were taken using Olympus BX41 microscope with a digital camera Olympus U-TV0.63XC in CellSens software (version V0116, Olympus), at ×100 magnification and ×200 (larger and smaller circle, scale bar 100 μm and 200 μm, respectively). c Biochemical recurrence (BCR) free survival analysis in months discriminated according to low or high p53 expression levels. Hazard ratio (HR) risk of 6.122 and P value = 0.05
Fig. 4
Fig. 4
TP53 epigenetic silencing leads to the mitigation of radioresistant phenotype in 22Rv1-RR cells. a Relative mRNA expression levels of TP53 gene for 22Rv1-RR GSK-J4-treated cells and vehicle control (DMSO), normalized by GUSB gene expression levels (housekeeping). Results are presented as mean ± SD of at least three independent experiments. **P value < 0.01. b Total protein levels of p53 (53 kDa) to compare between 10 μM GSK-J4-treated 22Rv1-RR cells and the vehicle (DMSO). β-actin (42 kDa) was used as loading control. Images were taken by the Chemidoc detection system (Biorad, Berkeley, California). Optical density values were obtained using ImageJ software version 1.53 (National Institutes of Health). Values are representative of GSK-J4 vs. vehicle of at least three independent replicates. c DAPI merged images of nuclear immunofluorescent staining of p53 (red) and H3K27me3 (green) and cytoplasm/nuclear staining of KDM6B (green), for 22Rv1-RR GSK-J4-treated cells and vehicle control (DMSO). Images were taken using Olympus IX51 microscope at ×400 magnification (scale bar 20 μm). d Schematic representation of colony formation assay experiments for GSK-J4 treatment. e Cell survival fraction of 22Rv1-RR treated with 10 μM of GSK-J4 and vehicle cells represented through linear-quadratic model (LQ = (S = e – (xD + BD2))), ****P value < 0.0001, with a dose-enhancement factor (DeF) of 1.66. f Representative scheme of TP53 promoter epigenetic regulation upon GSK-J4 treatment in 22Rv1-RR cells. In red is represented the transcription repression-related marker, H3K27me3. g The graph represents H3K27me3 %input values (ChIP-qPCR) at TP53 gene promoter in regions #1 and #2 (180 bp and 360 bp upper TSS, respectively). The violin plots were represented by mean ± SD of at least three independent replicates. ns non-significant; **P value < 0.01; ****P value < 0.0001. h Cell viability assay for 22Rv1-RR negative control (TP53 C-) and TP53-KD clones #1 to #3 at 24 h and 48 h. i Cell survival fraction of 22Rv1-RR-negative control (TP53 C-) and TP53-KD clones #1 to #3 transfected cells represented through linear-quadratic model (LQ = (S = e – (αD + βD2))), ns, non-significant; ****P value < 0.0001. Results are presented as mean ± SD of at least 3 independent experiments. bp base pairs, Def, dose enhancement factor, KD knockdown, RR radioresistant, TSS transcription starting site
Fig. 5
Fig. 5
Impaired DNA damage repair, proliferation, and increased apoptosis in 22Rv1-RR GSK-J4-treated cells. a, b Effect of 2.5 Gy irradiation treatment in DNA damage of 22Rv1-RR GSK-J4-treated cells and vehicle control (DMSO) by comet assay. The results are the mean of at least 100 comets per condition. *P value < 0.05; ***P value < 0.001; ****P value < 0.0001. The graph represents tail moment, corresponding to tail length × % of DNA in the tail. Red line represents the median value. c Immunofluorescence staining of γ-H2AX foci (merged with DAPI) in 22Rv1-RR treated with GSK-J4 and vehicle control (DMSO) at 0 Gy and after 2.5 Gy IR (30 min and 24 h after). Images were taken using Olympus IX51 microscope at ×400 magnification (scale bar 20 μm). d, e Data quantification by flow cytometry for early and late apoptotic % cells and representative Annexin V/7ADD staining dot plots. f, g Representative graphs and dot plots for cell cycle analysis by flow cytometry according to BrdU/7ADD cell staining
Fig. 6
Fig. 6
GSK-J4 impaired in vivo microtumor formation of 22Rv1-RR cells. a Representative images of CAM microtumors for 22Rv1-P, RR, RR vehicle (DMSO), and RR GSK-J4-treated cells with or without expsure to 2.5 Gy of IR-SD. Digital images were taken under a stereomicroscope Olympus S2X16 using a digital camera Olympus SC180. b Relative area (pixel2) of the formed microtumors was assessed using ImageJ software tools. Results are presented as mean ± SD of ten eggs per group condition; *P < 0.05; **P < 0.01; ****P < 0.001. c Representative IHC images for p53, KDM6B, and H3K27me3 protein expression in CAM-assay microtumors tissue sections for both groups of vehicle and GSK-J4. Pictures were taken using Olympus BX41 microscope with a digital camera Olympus U-TV0.63XC in CellSens software (version V0116, Olympus), at ×400 magnification (scale bar, 20 μm). d p53, e KDM6B, and f H3K27me3—% of positive staining cells in vehicle and GSK-J4 treatment groups. Scatter plot bar graphs depict mean ± SD of all selected microtumors. *P value < 0.05. CAM Chicken choriallantoic membrane, P parental, PCa prostate cancer, RR radioresistant, SD single-dose

References

    1. Huang RX, Zhou PK. DNA damage response signaling pathways and targets for radiotherapy sensitization in cancer. Signal Transduct. Target Ther. 2020;5:60. doi: 10.1038/s41392-020-0150-x. - DOI - PMC - PubMed
    1. Maréchal, A. & Zou, L. DNA damage sensing by the ATM and ATR kinases. Cold Spring Harb. Perspect. Biol.5, a012716 (2013). - PMC - PubMed
    1. Macheret M, Halazonetis TD. DNA replication stress as a hallmark of cancer. Annu. Rev. Pathol. 2015;10:425–448. doi: 10.1146/annurev-pathol-012414-040424. - DOI - PubMed
    1. Morgan MA, Lawrence TS. Molecular pathways: overcoming radiation resistance by targeting DNA damage response pathways. Clin. Cancer Res. 2015;21:2898–2904. doi: 10.1158/1078-0432.CCR-13-3229. - DOI - PMC - PubMed
    1. Roos WP, Thomas AD, Kaina B. DNA damage and the balance between survival and death in cancer biology. Nat. Rev. Cancer. 2016;16:20–33. doi: 10.1038/nrc.2015.2. - DOI - PubMed

Publication types

MeSH terms

Substances