. 2023 Oct 16;21(1):219.
doi: 10.1186/s12915-023-01725-9.

Metabolic shift toward ketosis in asocial cavefish increases social-like affinity

Affiliations

Metabolic shift toward ketosis in asocial cavefish increases social-like affinity

Motoko Iwashita et al. BMC Biol. .

Abstract

Background: Social affinity and collective behavior are nearly ubiquitous in the animal kingdom, but many lineages feature evolutionarily asocial species. These solitary species may have evolved to conserve energy in food-sparse environments. However, the mechanism by which metabolic shifts regulate social affinity is not well investigated.

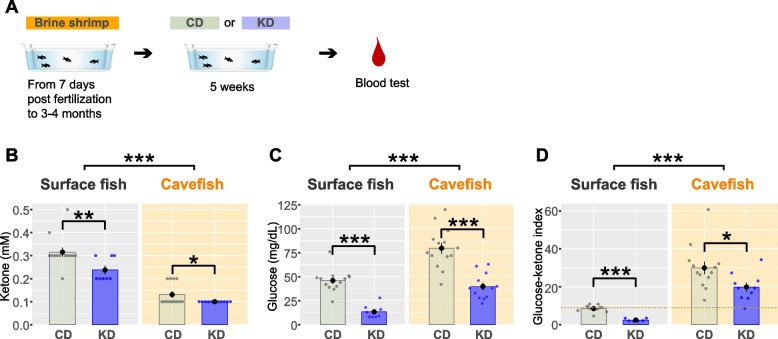
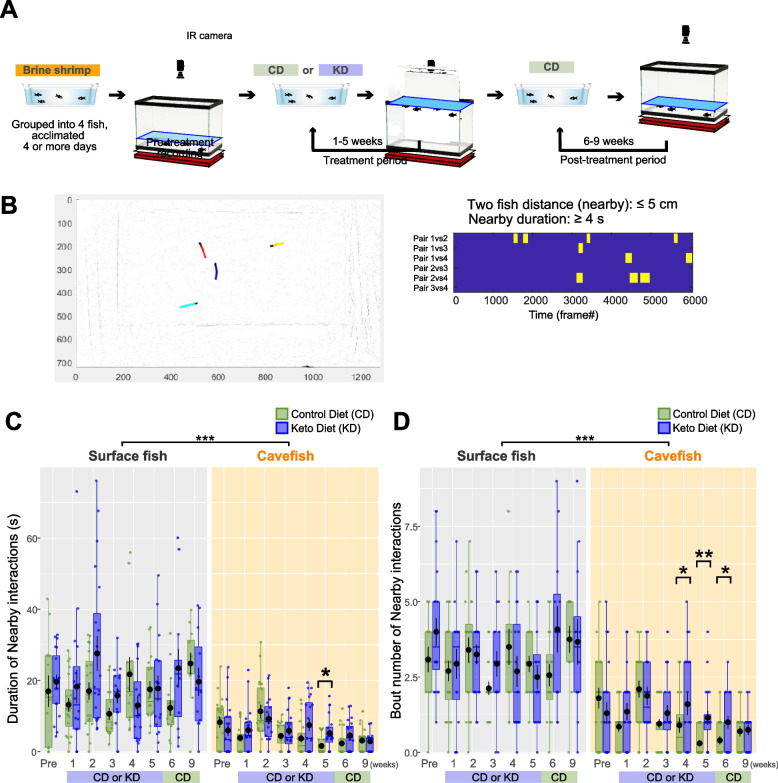
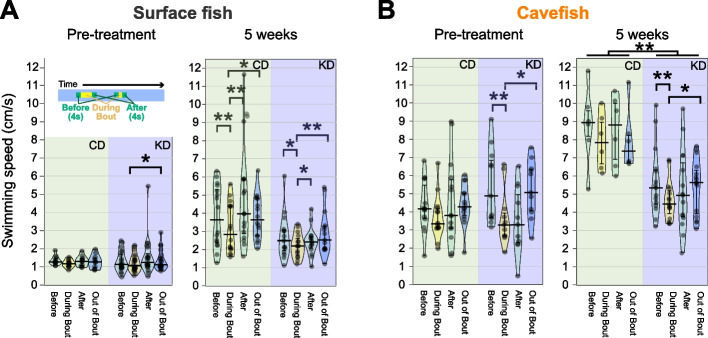
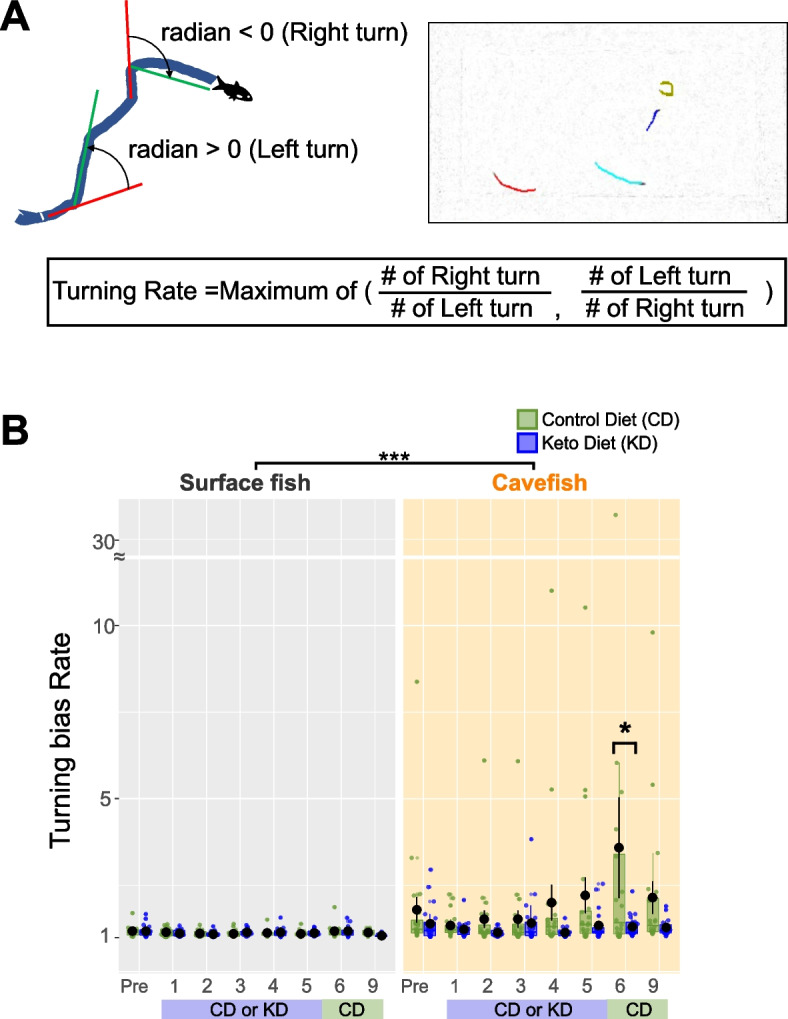
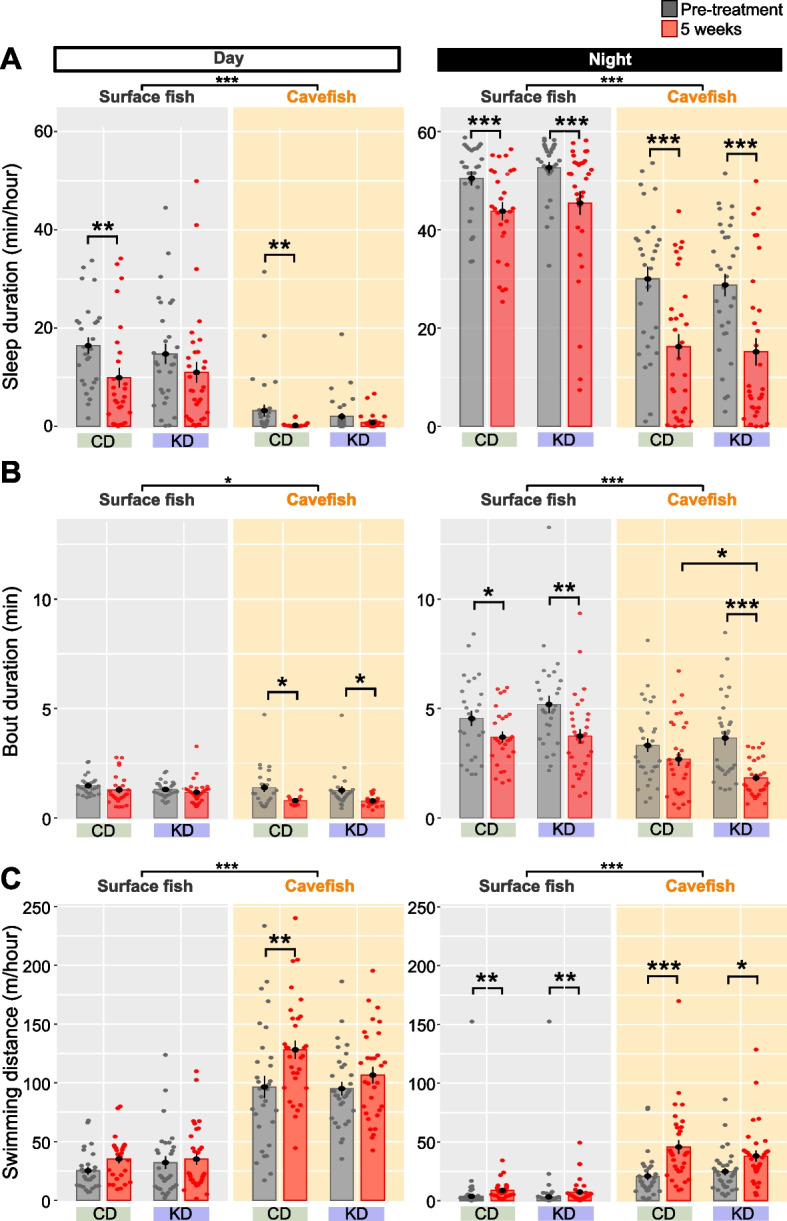
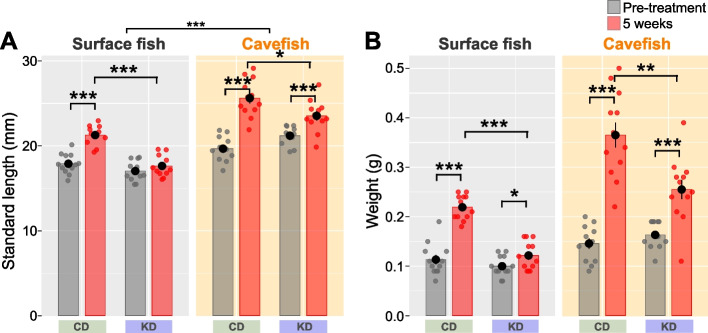
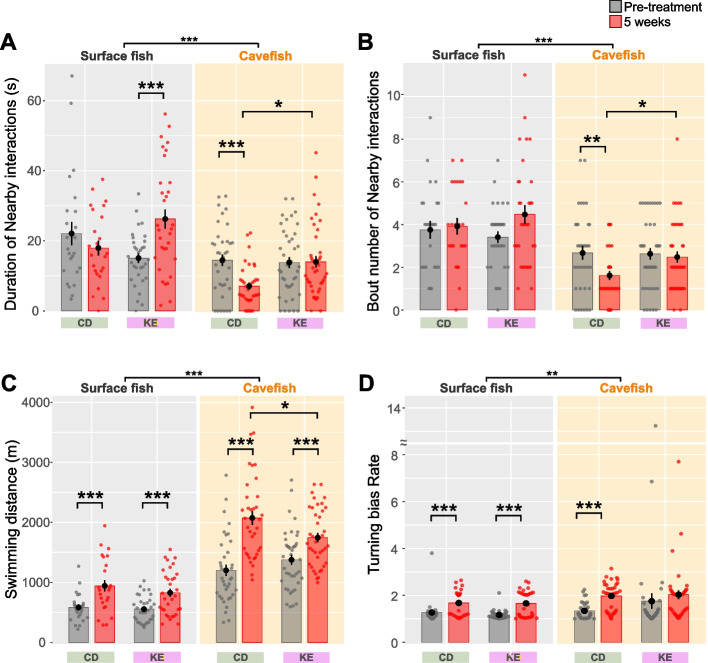
Results: In this study, we used the Mexican tetra (Astyanax mexicanus), which features riverine sighted surface (surface fish) and cave-dwelling populations (cavefish), to address the impact of metabolic shifts on asociality and other cave-associated behaviors in cavefish, including repetitive turning, sleeplessness, swimming longer distances, and enhanced foraging behavior. After 1 month of ketosis-inducing ketogenic diet feeding, asocial cavefish exhibited significantly higher social affinity, whereas social affinity regressed in cavefish fed the standard diet. The ketogenic diet also reduced repetitive turning and swimming in cavefish. No major behavioral shifts were found regarding sleeplessness and foraging behavior, suggesting that other evolved behaviors are not largely regulated by ketosis. We further examined the effects of the ketogenic diet via supplementation with exogenous ketone bodies, revealing that ketone bodies are pivotal molecules positively associated with social affinity.

Conclusions: Our study indicated that fish that evolved to be asocial remain capable of exhibiting social affinity under ketosis, possibly linking the seasonal food availability and sociality.

Keywords: Asociality; Cavefish; Fasting; Glycolysis; Ketone; Ketosis; Starvation.


Conflict of interest statement

The authors declare that they have no competing interests.

Figures

Fig. 1
Fig. 1
Blood glucose and ketone levels under the control diet (CD) or ketogenic diet (KD). A Experimental procedure. After fish were raised for 3–4 months on a brine shrimp larva diet, fish were fed the CD or KD for 5 weeks. Blood glucose and ketone levels were measured after the 5-week period. B Blood ketone level (mmol/L). Ketone levels were significantly reduced by KD feeding in both surface fish (SF) and cavefish (CF). Bars represent the data mean and whiskers represent ± standard error of the mean. Dots indicate individual data. The generalized linear model (family = Poisson) followed by post hoc Holm’s correction was applied for the statistical tests (see “Methods” and Additional file 3). C Blood glucose level (mg/dL). Glucose levels were significantly reduced by KD feeding in both SF and CF. The linear model (family = Gaussian) followed by post hoc Holm’s correction was applied for the statistical tests. D The glucose ketone index (GKI) indicated that the ratio of glucose to ketone was lowered by KD feeding in both SF and CF, suggesting that this diet altered the balance between glucose and ketone. The generalized linear model (family = Gamma) followed by post hoc Holm’s correction was applied for the statistical tests. SF: N = 13 for CD feeding, N = 8 for KD feeding. CF: N = 13 for CD feeding, N = 11 for KD feeding. *: P < 0.05, **: P < 0.01, ***: P < 0.001. All detailed statistical data are available in Additional file 3
Fig. 2
Fig. 2
Time-course of nearby interaction changes during 9 weeks of control diet (CD) or ketogenic diet (KD) feeding. A Experimental procedure. After rearing fish for 3–4 months on a brine shrimp larva diet, the pre-treatment recording was performed, followed by CD or KD feeding for 5 weeks. Nearby interactions were recorded every week until week 5 of feeding. Subsequently, all groups, including KD-fed fish, were given the CD until week 9. B Example of nearby interaction events among surface fish (SF). The left panel presents an example frame of the video, with colored lines indicating the trajectories of individual fish. A red-labeled fish was followed by a blue-labeled fish. Each nearby event that met the detection criteria, namely a distance of ≤ 5 cm between two fish that was maintained for more than 4 s, was counted as a nearby interaction event. The right panel presents an example of the detected events in a raster plot, where each yellow bar indicates a nearby interaction event. Each pair of fish (six pairs among four fish) is presented in the rows. C Duration of nearby interactions. Although SF did not exhibit any differences in the duration of nearby interactions (s) between CD (green) and KD (blue) feeding, differences were detected among cavefish (CF) in week 5. However, the nearby interaction duration was indistinguishable from that of the CD group starting in week 6 when the KD was withdrawn from the experimental group. Data are shown in boxplots indicating the 25th, 50th, and 75th percentiles in the boxes. The linear mixed-effect model followed by post hoc Holm’s correction was applied for the statistical tests. D Number of nearby interactions. Whereas SF exhibited no differences between CD and KD feeding, differences were observed in CF in weeks 4–6. After the KD was withdrawn in week 6, the number of events decreased to the level observed with CD feeding. Data are presented as boxplots indicating the 25th, 50th, and 75th percentiles. The generalized linear model (family = Poisson) followed by post hoc Holm’s correction was applied for the statistical tests. Dots indicate individual data. N = 20 for each group. *: P < 0.05, **: P < 0.01, ***: P < 0.001. All detailed statistical data are available in Additional file 3
Fig. 3
Fig. 3
Ketogenic diet (KD) feeding induced surface fish (SF)-like speed profiles during nearby interactions in cavefish (CF). Changes in swimming speed before, during, and after nearby interaction events in SF (A) and CF (B). The mean swimming speeds were plotted for: (i) 4 s before the nearby interaction event, (ii) during the event, (iii) during 4 s after the event, and (iv) during the out-of-event period (see the top-left inset of A). A Swimming speed was reduced during nearby interactions in SF in both the CD and KD groups. This profile was clearer in the fifth week (right panel). The linear mixed-effect model followed by post hoc Holm’s correction was applied for the statistical tests. B Swimming speed was reduced during nearby interactions only in the KD group in week 5 (right panel). The bars indicate the 25th, medians, and 75th percentiles of the data points. The different speed profiles between the CD and KD groups in the Pre-treatment are due to the naturalistic standing variation in A. mexicanus system. The linear mixed-effect model followed by post hoc Holm’s correction was applied for the statistical tests. Dots indicate individual data. SF: N = 11 for CD, N = 20 for KD. CF: N = 16 for CD, N = 15 for KD. *: P < 0.05, **: P < 0.01, ***: P < 0.001. All detailed statistical data are available in Additional file 3
Fig. 4
Fig. 4
Biased turning was attenuated by the ketogenic diet (KD). A Diagram and the calculation formula for the turning bias index. The changes in the left or right traveling directions were calculated every five frames (every 0.25 s) across all trajectories and expressed as radians. Positive radian values represent left (anticlockwise) turning, and negative values indicate right turning. The ratio between the numbers of clockwise and anticlockwise turns was used as the turning rate (1–infinity, positive value). B Turning biases of surface fish (left) and cavefish (right). There was no difference between CD and KD feeding in surface fish, whereas the turning index in CD-fed cavefish was larger than in KD-fed cavefish (see week 6). The generalized linear model followed by post hoc Holm’s correction was applied for the statistical tests. Bars represent the data mean and whiskers represent ± standard error of the mean. Dots indicate individual data. N = 20 for all groups. *: P < 0.05, **: P < 0.01, ***: P < 0.001. All detailed statistical data are available in Additional file 3
Fig. 5
Fig. 5
Day and night sleeping durations and swimming distances were not altered by ketogenic diet (KD) feeding. A Sleep duration (min/h) during the day (left) and night (right). During 5 weeks of growth, the sleep duration decreased in both surface fish and cavefish regardless of the diet (particularly during night). The linear mixed-effect model followed by post hoc Holm’s correction was applied for the statistical tests. B Average sleep bout duration (min/10 min bin) during the day (left) and night (right). During 5 weeks of growth, the sleep bout duration was lower in surface fish under both dietary conditions and in KD-fed cavefish (night). The linear mixed-effect model followed by post hoc Holm’s correction was applied for the statistical tests. C Swimming distance during the day (left) and night (right). Cavefish fed the control diet (CD) exhibited a longer swimming distance during the day and night. Conversely, both surface fish fed either diet and cavefish fed the KD exhibited a significantly increased swimming distance only at night. The linear mixed-effect model followed by post hoc Holm’s correction was applied for the statistical tests. Bars represent the data mean and whiskers represent ± standard error of the mean. Dots indicate individual data. Surface fish: N = 28 for CD, N = 32 for KD. Cavefish: N = 28 for CD, N = 32 for KD. *: P < 0.05, **: P < 0.01, ***: P < 0.001. All detailed statistical data are available in Additional file 3
Fig. 6
Fig. 6
Body length and weight under control diet (CD) or ketogenic diet (KD) feeding. A Standard length (cm). KD-fed surface fish and cavefish were significantly smaller than their CD-fed counterparts. The linear mixed-effect model followed by post hoc Holm’s correction was applied for the statistical tests. B Body weight (g). KD-fed surface fish and cavefish weighed less than their CD-fed counterparts. The linear mixed-effect model followed by post hoc Holm’s correction was applied for the statistical tests. Data are presented as the mean ± standard error of the mean. Dots indicate individual data. Surface fish: N = 28 for CD, N = 32 for KD. Cavefish: N = 28 for CD, N = 32 for KD. *: P < 0.05, **: P < 0.01, ***: P < 0.001. All detailed statistical data are available in Additional file 3
Fig. 7
Fig. 7
Nearby interactions and other behaviors under control diet (CD) or ketone ester–supplemented diet (KE) feeding. A Duration of nearby interactions (s). After 5 weeks, the duration of nearby interactions increased in KE-treated surface fish and cavefish. The linear mixed-effect model followed by post hoc Holm’s correction was applied for the statistical tests. B Number of nearby interaction events. The number of nearby interactions was promoted in KE-treated cavefish. The generalized linear model (family = Poisson) followed by post hoc Holm’s correction was applied for the statistical tests. C Swimming distance. KE-treated cavefish exhibited a slight but significant decrease in swimming distance compared to CD-treated cavefish in a 5-min assay. The linear mixed-effect model followed by post hoc Holm’s correction was applied for the statistical tests. D Turning bias ratio. No significant difference was detected between the CD and KE groups. The generalized linear model (family = Gamma) followed by post hoc Holm’s correction was applied for the statistical tests. Data are presented as the mean ± standard error of the mean. Dots indicate individual data. N = 20 for all groups. *: P < 0.05, **: P < 0.01, ***: P < 0.001. All detailed statistical data are available in Additional file 3

References

    1. McCue MD. Starvation physiology: reviewing the different strategies animals use to survive a common challenge. Comp Biochem Physiol A Mol Integr Physiol. 2010;156(1):1–18. - PubMed
    1. Padilla SL, Qiu J, Soden ME, Sanz E, Nestor CC, Barker FD, et al. Agouti-related peptide neural circuits mediate adaptive behaviors in the starved state. Nat Neurosci. 2016;19(5):734–741. - PMC - PubMed
    1. Filosa A, Barker AJ, Dal Maschio M, Baier H. Feeding state modulates behavioral choice and processing of prey stimuli in the Zebrafish Tectum. Neuron. 2016;90(3):596–608. - PubMed
    1. Solianik R, Sujeta A, Terentjevienė A, Skurvydas A. Effect of 48 h fasting on autonomic function, brain activity, cognition, and mood in amateur weight lifters. Biomed Res Int. 2016;2016(5):1–8. - PMC - PubMed
    1. Fokidis HB, Prior NH, Soma KK. Fasting increases aggression and differentially modulates local and systemic steroid levels in male zebra finches. Endocrinology. 2013;154(11):4328–4339. - PubMed

Publication types