Proteome profiling of early gestational plasma reveals novel biomarkers of congenital heart disease
- PMID: 37840432
- PMCID: PMC10701625
- DOI: 10.15252/emmm.202317745
Proteome profiling of early gestational plasma reveals novel biomarkers of congenital heart disease
Abstract
Prenatal diagnosis of congenital heart disease (CHD) relies primarily on fetal echocardiography conducted at mid-gestational age-the sensitivity of which varies among centers and practitioners. An objective method for early diagnosis is needed. Here, we conducted a case-control study recruiting 103 pregnant women with healthy offspring and 104 cases with CHD offspring, including VSD (42/104), ASD (20/104), and other CHD phenotypes. Plasma was collected during the first trimester and proteomic analysis was performed. Principal component analysis revealed considerable differences between the controls and the CHDs. Among the significantly altered proteins, 25 upregulated proteins in CHDs were enriched in amino acid metabolism, extracellular matrix receptor, and actin skeleton regulation, whereas 49 downregulated proteins were enriched in carbohydrate metabolism, cardiac muscle contraction, and cardiomyopathy. The machine learning model reached an area under the curve of 0.964 and was highly accurate in recognizing CHDs. This study provides a highly valuable proteomics resource to better recognize the cause of CHD and has developed a reliable objective method for the early recognition of CHD, facilitating early intervention and better prognosis.
Keywords: congenital heart disease; plasma; proteomics gestational.
© 2023 The Authors. Published under the terms of the CC BY 4.0 license.
Conflict of interest statement
The authors declare that they have no conflict of interest.
Figures

Overview of the investigated groups and a schematic diagram of the proteomic analysis. Maternal blood samples were collected at 10–12 weeks of gestation. The total number of participants in each group and the basic procedures for proteomic analysis are described.
Proteins were quantified using a 1% false discovery rate (FDR) cutoff. Values are reported as mean ± standard deviation (SD). n = 71 (control in group 1), 67 (CHD offspring in group 1), 32 (control in group 2), and 37 (CHD offspring in group 2) as biological replicates.
Cumulative number of proteins identified (the left panel shows the results for control and the right panel shows the results for CHD) in group 1. The number of proteins in the dataset (Y‐axis) was plotted against the number of samples (X‐axis).
Cumulative number of proteins identified (the left panel shows the results for the control and the right panel shows the results for CHD) in group 2. The number of proteins in the dataset (Y‐axis) was plotted against the number of samples (X‐axis).
Data completeness curve. The number of proteins in the dataset (Y‐axis) is plotted against the minimum number of samples in which the proteins were quantified (X‐axis). Arrows indicate data completeness values of 50, 75, and 100%.
The protein abundance distributions in the CHD group (red) and the control group (blue) are plotted. The top 10 most abundant proteins are indicated in the box.

Pearson's correlation coefficients for replicate proteome profiling of 20 plasma samples (10 CHD and 10 healthy control samples).
Reproducibility of the fraction of total (FOT) of six proteins in 207 samples. FOT was defined as the iBAQ of a protein divided by the total iBAQ of all identified proteins within a sample.

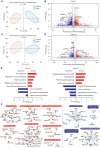
Principal component analysis (PCA) of proteins in plasma samples from group 1. Control participants are represented in red and CHD in blue.
Relationship between fold‐change values for CHD/control samples and statistical significance for group 1. Red indicates upregulated proteins, blue indicates downregulated proteins, and proteins above the gray dotted line are statistically significant (P < 0.05).
PCA of plasma proteins from group 2. Control participants are represented in red, and CHD in blue.
Relationship between fold‐change values for CHD/control samples and statistical significance for group 2. Red indicates upregulated proteins, blue indicates downregulated proteins, and proteins above the gray dotted line are statistically significant (P < 0.05).
Gene ontology (GO) annotations with upregulated or downregulated proteins (P < 0.05).
Protein interaction analysis of enriched pathways in the two groups is shown in (E). Red indicates interactions between upregulated proteins, whereas blue indicates interactions between downregulated proteins.


Expression levels of previously reported heart disease‐related proteins. ***P < 0.001; **P < 0.01; *P < 0.05; P‐values from unpaired t‐test are shown. Lines indicate mean and SD. n = 71 (control in group 1), 67 (CHD offspring in group 1), 32 (control in group 2), and 37 (CHD offspring in group 2) as biological replicates.
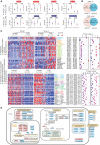
Venn diagram of up‐ and downregulated proteins.
Expression levels and pathway enrichment of identified proteins in both groups. The heatmaps indicate the expression levels, frequencies, and P‐values for 25 upregulated proteins in the two groups (upper panel) and 49 downregulated proteins in the two groups (lower panel).
Pathway patterns of differentially expressed proteins in the two groups.

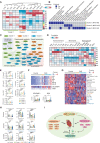
Weighted gene co‐expression network analysis (WGCNA) of 207 plasma samples showed that 12 pathological features of CHD could be integrated into three clusters according to the correlations between module proteins. The strengths of the positive (red) and negative (blue) correlations are illustrated in the two‐color heatmap. Pearson correlation coefficients and P‐values were calculated by WGCNA package. ***P < 0.001; **P < 0.01; *P < 0.05.
Gene ontology (GO) analysis of proteins in each cluster.
Protein–protein interaction analysis of three major pathological features.
Analysis of changes in different CHD protein networks and their correlation with clinical indicators.
Expression levels of blood lipids in the controls and CHDs. ***P < 0.001; **P < 0.01; *P < 0.05; P‐values from unpaired t‐test are shown. Whiskers mark minimum or maximum values. n = 103 (Control), 10 (Cluster 1), 23 (Cluster 2), and 71 (Cluster 3) as biological replicates.
Correlations of protein expression with clinical indicators (blood lipids). ***P < 0.001; *P < 0.05; P‐values from unpaired t‐test are shown. Lines indicate mean and SD. n = 103 (Control), 10 (Cluster 1), 23 (Cluster 2), and 71 (Cluster 3) as biological replicates.
Heatmap of cluster types of specific immune cells in the controls and CHDs.
Scatter plot illustrating the xCell scores for specific cell types in the control and CHDs groups. ***P < 0.001; **P < 0.01; *P < 0.05; P‐values from unpaired t‐test are shown. Lines indicate mean and SD. n = 103 (Control), 10 (Cluster 1), 23 (Cluster 2), and 71 (Cluster 3) as biological replicates.
Blood lipids and the potential pathogenesis of CHD.

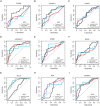
- A–C
(A) The receiver operating characteristic (ROC) curve for the training dataset of group 1, (B) Confusion matrix for the combination biomarkers in the training dataset, and (C) principal component analysis (PCA) plot for the prediction of CHD and control outcomes.
- D–F
(D) The ROC curve for the test dataset of group 1, (E) confusion matrix for the combination biomarkers in the test dataset, and (F) PCA plot for the prediction of CHD and control outcomes.
- G–I
(G) The ROC curve for the external validation set in group 2, (H) confusion matrix for the combination biomarkers in the external validation set, and (I) PCA plot for the prediction of CHD and control outcomes.

The receiver operating characteristic (ROC) curve of protein calpain‐5 (CAPN5) in the training set, test set, and validation set.
The ROC curve of protein enolase‐phosphatase E1 (ENOPH1) in the training set, test set, and validation set.
The ROC curve of protein histone H2A type 1‐C (H2AC6) in the training set, test set, and validation set.
The ROC curve of protein heat shock protein HSP 90‐alpha (HSP90AA1) in the training set, test set, and validation set.
The ROC curve of protein importin subunit beta‐1 (KPNB1) in the training set, test set, and validation set.
The ROC curve of protein malate dehydrogenase (MDH2) in the training set, test set, and validation set.
The ROC curve of protein myosin regulatory light polypeptide 9 (MYL9) in the training set, test set, and validation set.
The ROC curve of protein radixin (RDX) in the training set, test set, and validation set.
The ROC curve of protein deoxynucleoside triphosphate triphosphohydrolase 1 (SAMHD1) in the training set, test set, and validation set.
References
-
- Alanen J, Korpimaki T, Kouru H, Sairanen M, Leskinen M, Gissler M, Ryynanen M, Nevalainen J (2019) First trimester combined screening biochemistry in detection of congenital heart defects. J Matern Fetal Neonatal Med 32: 3272–3277 - PubMed
-
- Bahado‐Singh R, Vishweswaraiah S, Mishra NK, Guda C, Radhakrishna U (2020) Placental DNA methylation changes in detection of tetralogy of Fallot. Ultrasound Obstet Gynecol 55: 768–775 - PubMed
-
- Bogachkov YY, Chen L, Le Master E, Fancher IS, Zhao Y, Aguilar V, Oh MJ, Wary KK, DiPietro LA, Levitan I (2020) LDL induces cholesterol loading and inhibits endothelial proliferation and angiogenesis in Matrigels: correlation with impaired angiogenesis during wound healing. Am J Physiol Cell Physiol 318: C762–C776 - PMC - PubMed
Publication types
MeSH terms
Substances
Grants and funding
- Fudan Original Research Personalized Support Project
- ZJ2019-ZD-004/Major Projects of Special Development Funds in Zhangjiang National Independent Innovation Demonstration Zone, Shanghai
- 2019YFA0801900/MOST | National Key Research and Development Program of China (NKPs)
- 2020YFA0803601/MOST | National Key Research and Development Program of China (NKPs)
- 2022YFA1303200/MOST | National Key Research and Development Program of China (NKPs)
- 2022YFA1303201/MOST | National Key Research and Development Program of China (NKPs)
- 82300428/National Natural Science Foundation of China (NSFC)
- 82330048/National Natural Science Foundation of China (NSFC)
- 32000895/National Natural Science Foundation of China (NSFC)
- 82170236/National Natural Science Foundation of China (NSFC)
- 81700212/National Natural Science Foundation of China (NSFC)
- 32370824/National Natural Science Foundation of China (NSFC)
- 32330062/National Natural Science Foundation of China (NSFC)
- 31972933/National Natural Science Foundation of China (NSFC)
- 2017SHZDZX01/Shanghai Municipal Science and Technology Major Project
- 23YF1425500/Shanghai Sailing Program
- 21XD1421700/STCSM | Program of Shanghai Academic Research Leader (Shanghai Academic Research Leader)
- 22XD1420100/STCSM | Program of Shanghai Academic Research Leader (Shanghai Academic Research Leader)
LinkOut - more resources
Full Text Sources
Medical

