

Quantitative myelin water imaging using short TR adiabatic inversion recovery prepared echo-planar imaging (STAIR-EPI) sequence
- PMID: 37840897
- PMCID: PMC10568074
- DOI: 10.3389/fradi.2023.1263491
Quantitative myelin water imaging using short TR adiabatic inversion recovery prepared echo-planar imaging (STAIR-EPI) sequence
Abstract
Introduction: Numerous techniques for myelin water imaging (MWI) have been devised to specifically assess alterations in myelin. The biomarker employed to measure changes in myelin content is known as the myelin water fraction (MWF). The short TR adiabatic inversion recovery (STAIR) sequence has recently been identified as a highly effective method for calculating MWF. The purpose of this study is to develop a new clinical transitional myelin water imaging (MWI) technique that combines STAIR preparation and echo-planar imaging (EPI) (STAIR-EPI) sequence for data acquisition.
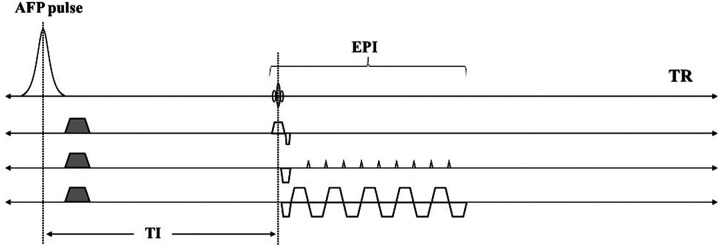
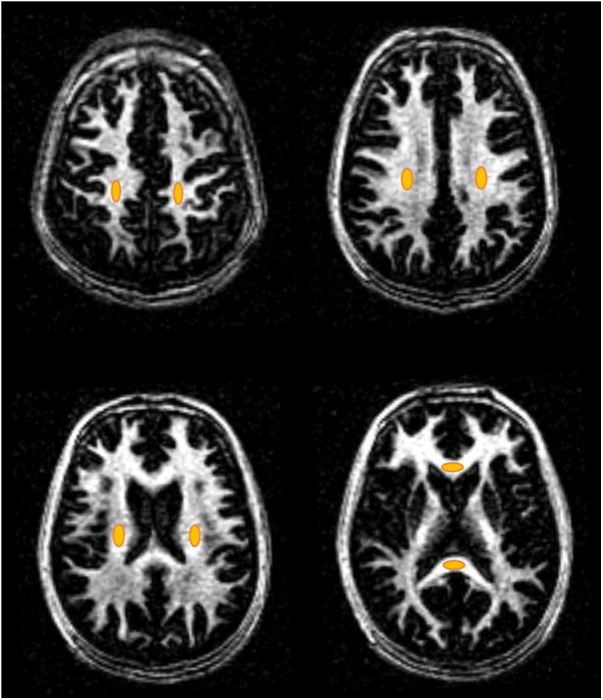
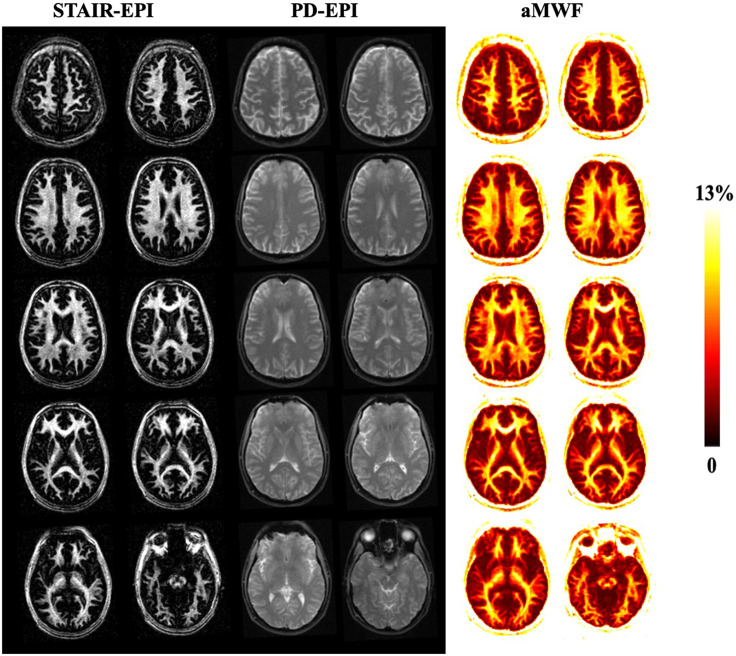
Methods: Myelin water (MW) in the brain has shorter T1 and T2 relaxation times than intracellular and extracellular water. In the proposed STAIR-EPI sequence, a short TR (e.g., ≤300 ms) together with an optimized inversion time enable robust long T1 water suppression with a wide range of T1 values [i.e., (600, 2,000) ms]. The EPI allows fast data acquisition of the remaining MW signals. Seven healthy volunteers and seven patients with multiple sclerosis (MS) were recruited and scanned in this study. The apparent myelin water fraction (aMWF), defined as the signal ratio of MW to total water, was measured in the lesions and normal-appearing white matter (NAWM) in MS patients and compared with those measured in the normal white matter (NWM) in healthy volunteers.
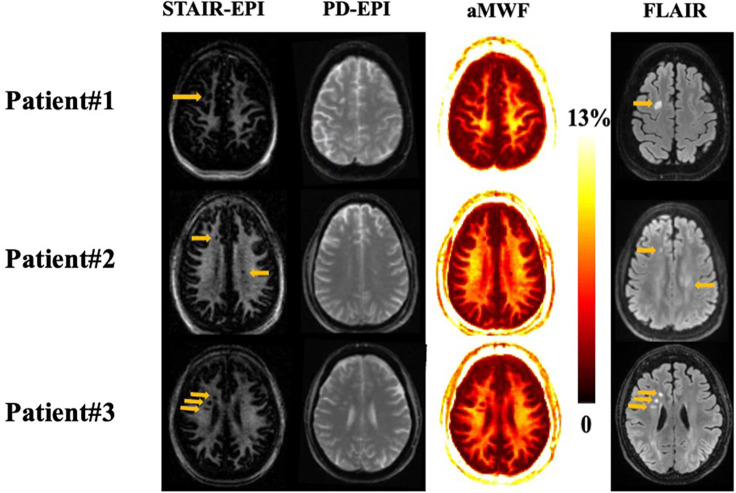
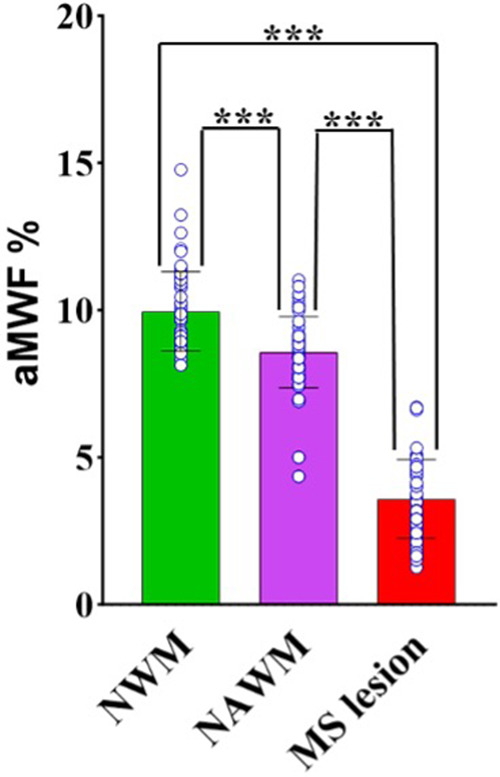
Results: As seen in the STAIR-EPI images acquired from MS patients, the MS lesions show lower signal intensities than NAWM do. The aMWF measurements for both MS lesions (3.6 ± 1.3%) and NAWM (8.6 ± 1.2%) in MS patients are significantly lower than NWM (10 ± 1.3%) in healthy volunteers (P < 0.001).
Discussion: The proposed STAIR-EPI technique, which can be implemented in MRI scanners from all vendors, is able to detect myelin loss in both MS lesions and NAWM in MS patients.
Keywords: EPI; STAIR; aMWF; multiple sclerosis; myelin water imaging.
© 2023 Shaterian Mohammadi, Moazamian, Athertya, Shin, Lo, Suprana, Malhi and Ma.
Conflict of interest statement
The authors declare that the research was conducted in the absence of any commercial or financial relationships that could be construed as a potential conflict of interest.
Figures
References
Grants and funding
LinkOut - more resources
Full Text Sources
Research Materials