. 2023 Sep 29:14:1236444.
doi: 10.3389/fimmu.2023.1236444. eCollection 2023.

Identification of specific prognostic markers for lung squamous cell carcinoma based on tumor progression, immune infiltration, and stem index

Affiliations

Identification of specific prognostic markers for lung squamous cell carcinoma based on tumor progression, immune infiltration, and stem index

Rihan Wu et al. Front Immunol. .

Abstract

Introduction: Lung squamous cell carcinoma (LUSC) is a unique subform of nonsmall cell lung cancer (NSCLC). The lack of specific driver genes as therapeutic targets leads to worse prognoses in patients with LUSC, even with chemotherapy, radiotherapy, or immune checkpoint inhibitors. Furthermore, research on the LUSC-specific prognosis genes is lacking. This study aimed to develop a comprehensive LUSC-specific differentially expressed genes (DEGs) signature for prognosis correlated with tumor progression, immune infiltration,and stem index.

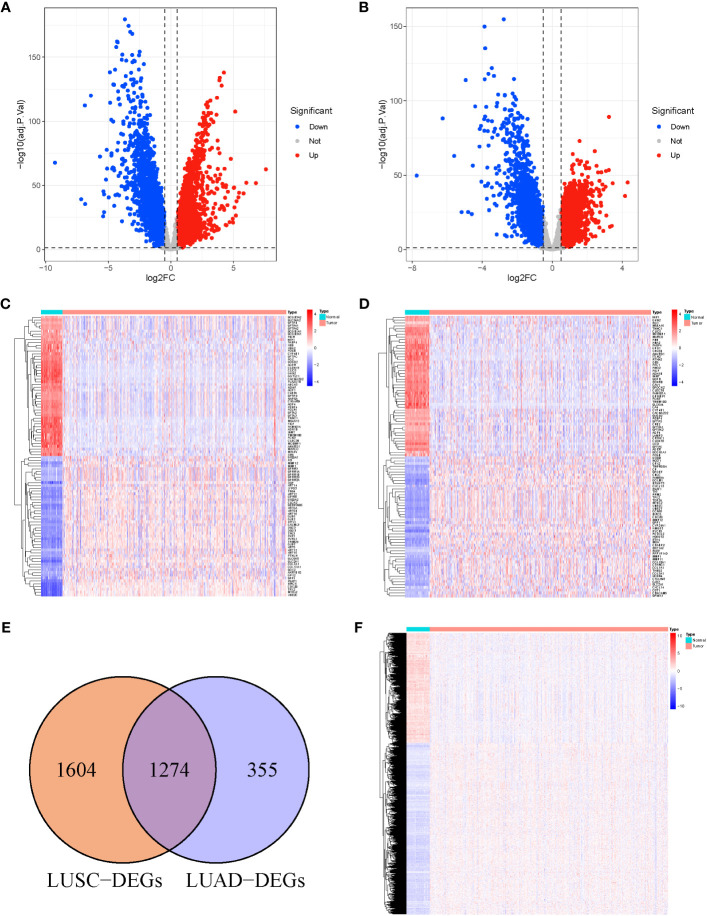
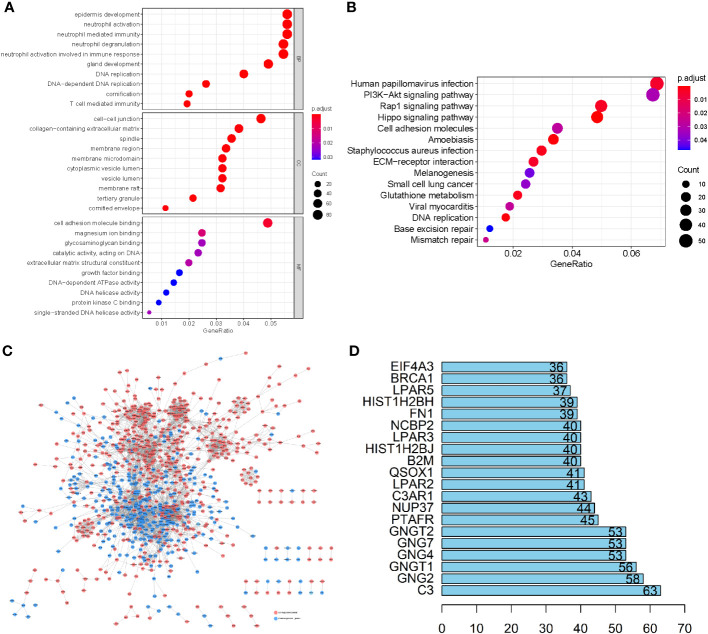
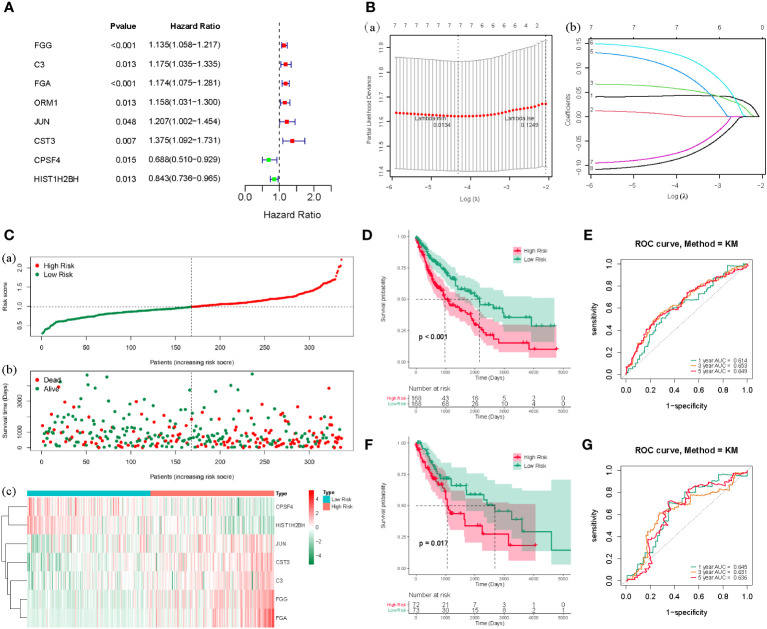
Methods: RNA sequencing data for LUSC and lung adenocarcinoma (LUAD) were extracted from The Cancer Genome Atlas (TCGA) data portal, and DEGs analyses were conducted in TCGA-LUSC and TCGA-LUAD cohorts to identify specific DEGs associated with LUSC. Functional analysis and protein-protein interaction network were performed to annotate the roles of LUSC-specific DEGs and select the top 100 LUSC-specific DEGs. Univariate Cox regression and least absolute shrinkage and selection operator regression analyses were performed to select prognosis-related DEGs.

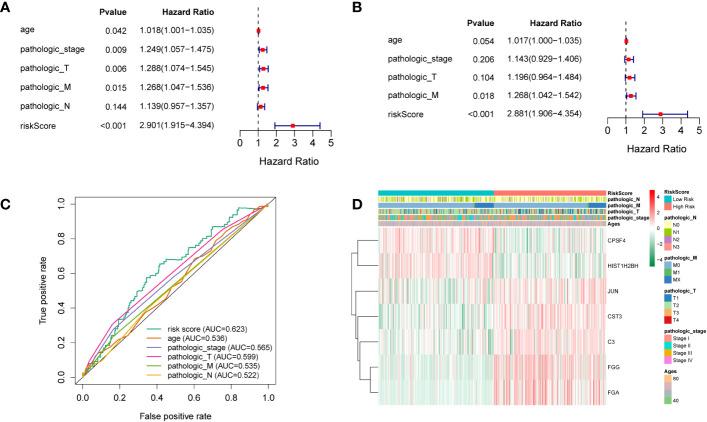
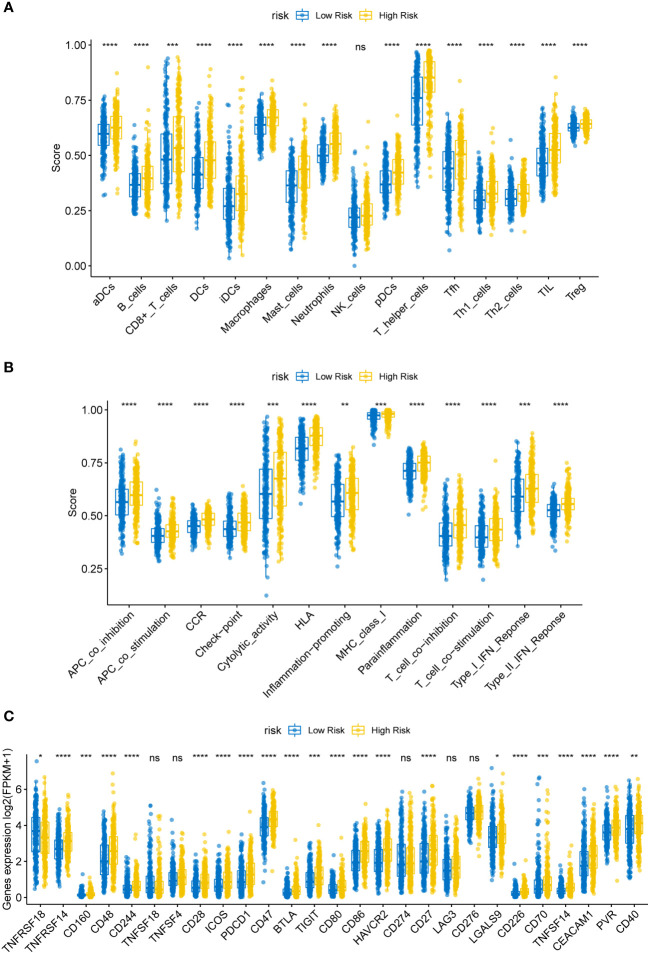
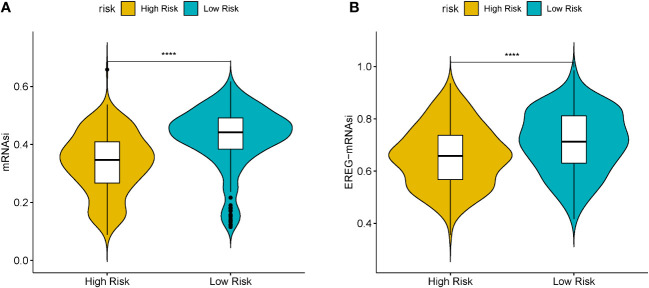
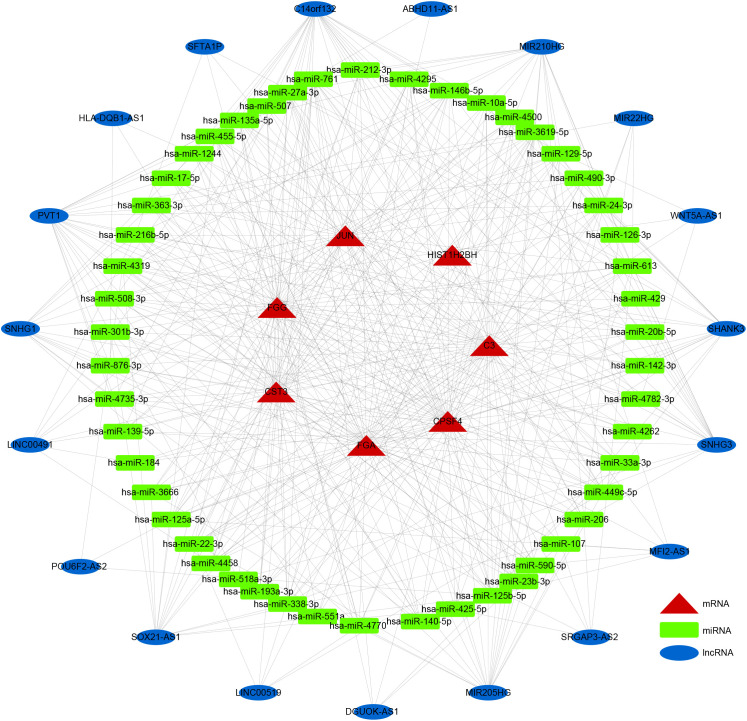
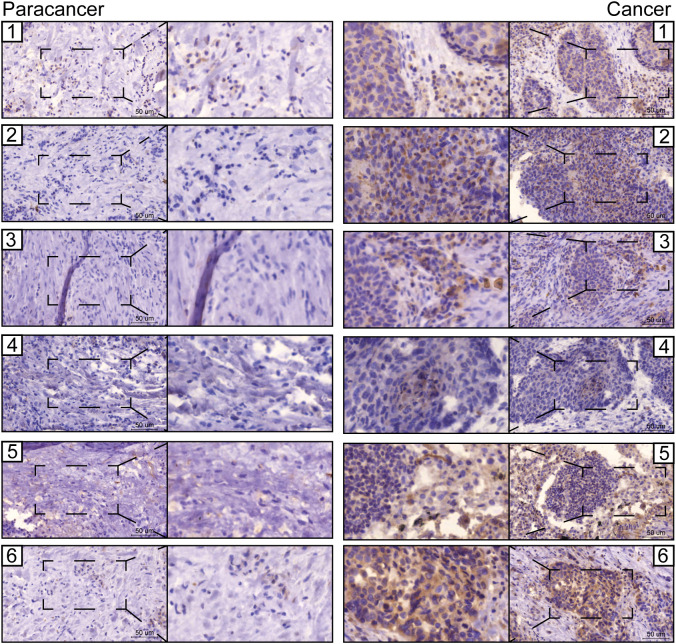
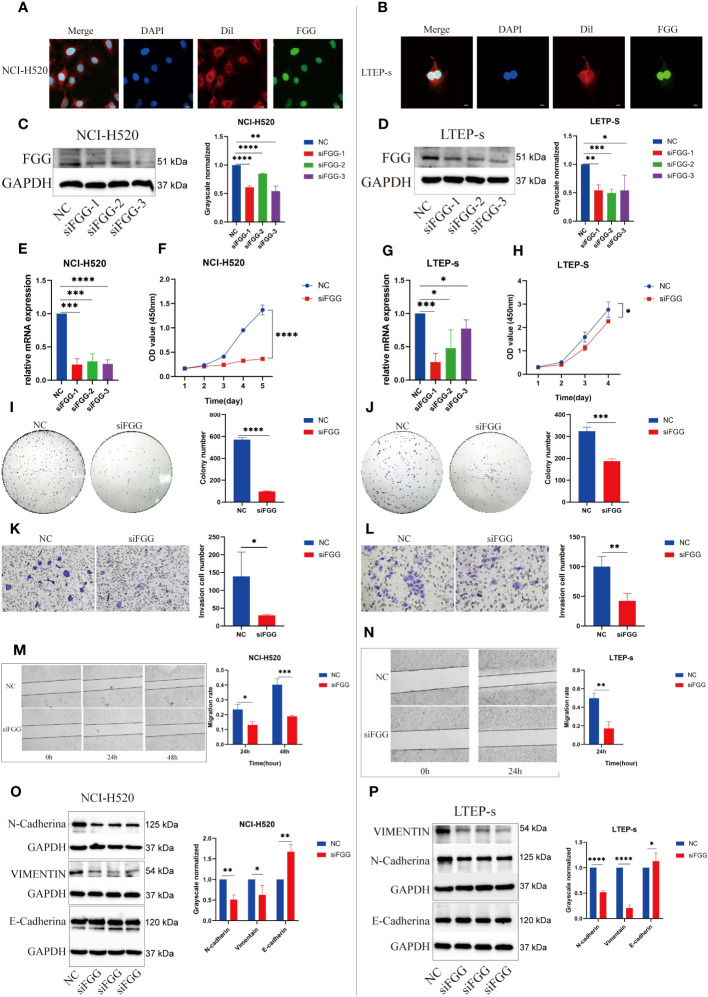
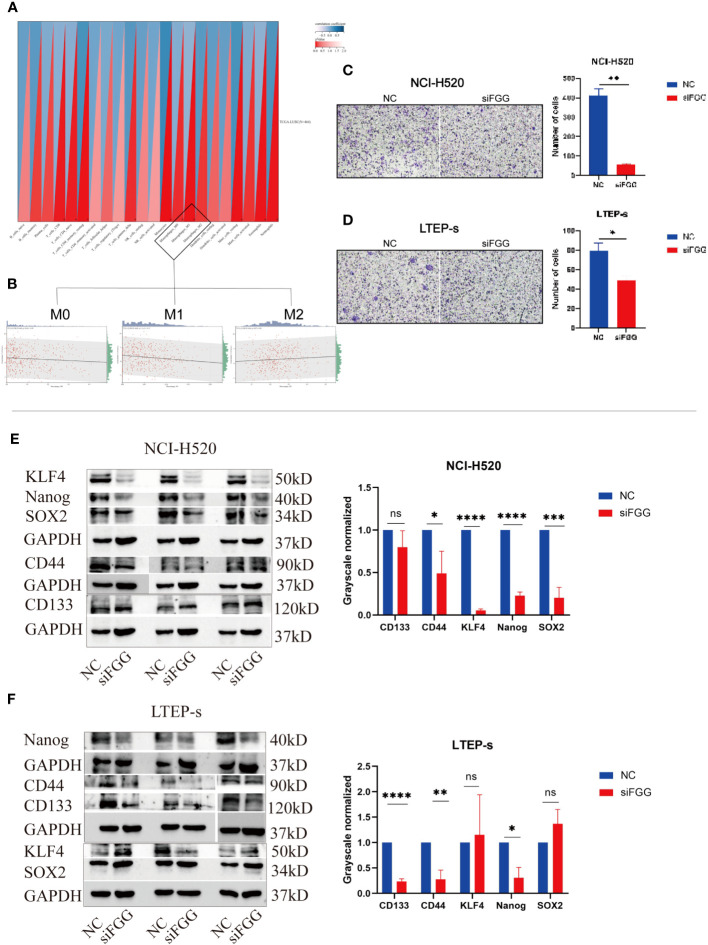
Results: Overall, 1,604 LUSC-specific DEGs were obtained, and a validated seven-gene signature was constructed comprising FGG, C3, FGA, JUN, CST3, CPSF4, and HIST1H2BH. FGG, C3, FGA, JUN, and CST3 were correlated with poor LUSC prognosis, whereas CPSF4 and HIST1H2BH were potential positive prognosis markers in patients with LUSC. Receiver operating characteristic analysis further confirmed that the genetic profile could accurately estimate the overall survival of LUSC patients. Analysis of immune infiltration demonstrated that the high risk (HR) LUSC patients exhibited accelerated tumor infiltration, relative to low risk (LR) LUSC patients. Molecular expressions of immune checkpoint genes differed significantly between the HR and LR cohorts. A ceRNA network containing 19 lncRNAs, 50 miRNAs, and 7 prognostic DEGs was constructed to demonstrate the prognostic value of novel biomarkers of LUSC-specific DEGs based on tumor progression, stemindex, and immune infiltration. In vitro experimental models confirmed that LUSC-specific DEG FGG expression was significantly higher in tumor cells and correlated with immune tumor progression, immune infiltration, and stem index. In vitro experimental models confirmed that LUSC-specific DEG FGG expression was significantly higher in tumor cells and correlated with immune tumor progression, immune infiltration, and stem index.

Conclusion: Our study demonstrated the potential clinical implication of the 7- DEGs signature for prognosis prediction of LUSC patients based on tumor progression, immune infiltration, and stem index. And the FGG could be an independent prognostic biomarker of LUSC promoting cell proliferation, migration, invasion, THP-1 cell infiltration, and stem cell maintenance.

Keywords: LUSC; biomarker; cancer stem cell; prognosis; tumor microenvironment.


Conflict of interest statement

The authors declare that the research was conducted in the absence of any commercial or financial relationships that could be construed as a potential conflict of interest.

Figures

Figure 1
Figure 1
(A) Volcano Plots of 2,878 LUSC-DEGs. (B) Volcano Plots of 1,629 LUAD-DEGs. Multiples of the abscissa difference (Tumor/Normal) taken the logarithm of 2 and the ordinate representation of -log10(adj.P.Val). Each dot represents a gene. Red dots indicate gene upregulation (Tumor vs. Normal samples), blue dots indicate downregulation (Tumor vs. Normal samples), and gray dots indicate no significant differences in expression. (C) The heat map of the top 100 DEGs in LUSC. (D) The top 100 DEGs LUAD. The abscissa direction represents the DEGs, while the vertical direction represents the samples. Colors indicate normalized differential expression; high and low expressions are shown in red and blue, respectively. (E) The Venn diagram of 1,604 LUSC-specific DEGs calculated by subtraction of LUSC-DEGs and the cross-section of LUSC and LUAD DEGs. (F) The heat map of LUSC-specific DEGs. The abscissa direction indicates the DEGs, while the vertical direction indicates the samples. Colors indicate normalized differential expression; red represents elevated levels, and blue represents reduced levels.
Figure 2
Figure 2
(A) GO enrichment analysis of the LUSC-specific DEGs. (B) The KEGG analysis of LUSC-specific DEGs. The ordinate and abscissa are the GO pathway sorted by the P-value and gene proportion. The shades of color denote the P-value, while the dot sizes represent the number of participating genes. (C) A PPI network containing 1,604 nodes and 14,209 edges further revealed the interactions of these LUSC-specific DEGs, where lines represent the interactions between them, red nodes refer to elevated gene expression, and blue nodes refer to diminished gene expression. (D) The bar plot of the top 20 DEGs in LUSC-specific DEGs.
Figure 3
Figure 3
(A) The forest map of the eight risk genes (FGG, C3, FGA, CRM1, JUN, CST3, CPSF4, and HIST1H2BH) using univariate analysis. (B), (a) LASSO analysis, where the screened characteristic gene ordinate is the gene coefficient; (b) the abscissa is the log(Lambda), and the ordinate denotes cross-validation error. In the analysis, we identified the position with the minimum error of cross-validation. In (B), the dotted line on the left represents the position with the minimum error of cross-validation. Based on the position (lambda.min), we determined the associated horizontal coordinate log(Lambda) and the number of characteristic genes (shown above); we also found the optimal log(Lambda) value and the associated gene and its coefficient in the left figure (A). (C) The risk curve and the distributions of OS status of the seven-gene TC (P < 0.05). The risk score (RS) of the TC in high- (HR) and low-risk (LR) cohorts (a), the OS status (b), and the heat map (c) are shown. The figure above (a) is consistent with the abscissa of the middle figure (b), indicating that RSs rose from left to right. The ordinate represents the RS and survival time, while the dotted line represents the median RS and the corresponding number of patients. Below (c) is the gene expression heat maps in the HR and LR cohorts. (D) The OS curve based on the HR and LR cohorts. (E) ROC curve of the seven-gene set in TCGA-LUSC training cohort (TC) 1-3-5-years OS. (F) TCGA-LUSC validation of survival curves for concentrated HR and LR cohorts. (G) ROC curves for 1-3-5-years OS in TCGA-LUSC validation cohort (VC).
Figure 4
Figure 4
(A) Univariate analysis. (B) Multivariate analysis. (C) ROC curves of multiple indicators. (D) Heat maps of different clinicopathological features of TCGA-LUSC.
Figure 5
Figure 5
(A) Box plot of immune infiltrating cells in the high- (HR) and low-risk (LR) cohorts. The HR cohort was strongly associated with elevated tumor infiltration levels in LUSC (P < 0.05). (B) Box plot of tumor infiltrated pathway. (C) Box plot of immunoassay sites in the HR and LR cohorts. The levels of the remaining immune checkpoint genes were markedly different between the HR and LR cohorts (P-values < 0.05); ns, not significant. (*P<0.05, **P<0.01, ***P<0.001, ****P<0.0001).
Figure 6
Figure 6
(A) Boxplots of mRNAsi in the high- (HR) and low-risk (LR) LUSC patients. (B) Boxplots of EREG-mRNAsi in the HR and LR LUSC patients. (*P<0.05, **P<0.01, ***P<0.001, ****P<0.0001).
Figure 7
Figure 7
ceRNA network. Rectangles, ellipses, and triangles represent the miRNAs, lncRNAs, and mRNAs of the risk model genes, respectively.
Figure 8
Figure 8
Representative images from immunohistochemical staining of FGG in lung cancers (n = 6) and normal tissues (n = 6). Scale bars: 100 μm and 50 μm.
Figure 9
Figure 9
Expression locations of FGG detected using immunofluorescence in (A) NCI-H520 and (B) LTEP-s. FGG knockdown was determined using western blotting in (C) NCI-H520 and (D) LTEP-s cells. FGG knockdown was determined using Q-PCR in (E) NCI-H520 and (G) LTEP-s cells. CCK-8 assay was used to detect the proliferation of (F) NCI-H520 and (H) LTEP-s cells Viability line graph (I) NCI-H520 and (J) LTEP-s cell colony formation result. The result of the invasion of (K) NCI-H520 and (L) LTEP-s cells. The results of Wound Healing and migration of (M) NCI-H520 cells and (N) LTEP-s cells. Western blotting assay showing EMT markers N-cadherin, Vimentin, and E-cadherin expression following FGG knockdown in (O) NCI-H520 and (P) LTEP-s cells. The significant differences were analyzed using GraphPad Prism t-test, n=3 (*P<0.05, **P<0.01, ***P<0.001, ****P<0.0001).
Figure 10
Figure 10
(A) Pearson’s correlation coefficient of FGG with 22 immune cell infiltration scores in LUSC was calculated using the corr.test function of the R package psych (version 2.1.6), and 10 significantly correlated immune infiltration scores, including macrophages, were identified, (B) for further individual correlations plotted for FGG with M0, M1, and M2 macrophages, respectively (p=0.04, r=0.09, p=1.1e-03, r=0.15, p=0.07, r=0.09). Tranwell shows the infiltration of THP-1of (C) NCI-H520 cells and (D) LTEP-s cells. Western blotting assay showing the expression of stemness marker genes SOX2, Nanog, CD133, CD44, KLF4 following FGG knockdown in (E) NCI-H520 and (F) LTEP-s cells. "ns" No Significant.

Similar articles

Cited by

References

    1. Chen Z, Fillmore CM, Hammerman PS, Kim CF, Wong KK. Non-small-cell lung cancers: a heterogeneous set of diseases. Nat Rev Cancer (2014) 14(8):535–46. doi: 10.1038/nrc3775 - DOI - PMC - PubMed
    1. Lu J, Wang W, Xu M, Li Y, Chen C, Wang X. A global view of regulatory networks in lung cancer: An approach to understand homogeneity and heterogeneity. Semin Cancer Biol (2017) 42:31–8. doi: 10.1016/j.semcancer.2016.11.004 - DOI - PubMed
    1. Relli V, Trerotola M, Guerra E, Alberti S. Abandoning the notion of non-small cell lung cancer. Trends Mol Med (2019) 25(7):585–94. doi: 10.1016/j.molmed.2019.04.012 - DOI - PubMed
    1. Ren S, Xiong X, You H, Shen J, Zhou P. The combination of immune checkpoint blockade and angiogenesis inhibitors in the treatment of advanced non-small cell lung cancer. Front Immunol (2021) 12:689132. doi: 10.3389/fimmu.2021.689132 - DOI - PMC - PubMed
    1. Siegel RL, Miller KD, Jemal A. Cancer statistics, 2019. CA: Cancer J Clin (2019) 69(1):7–34. doi: 10.3322/caac.21551 - DOI - PubMed

Publication types