Mild hypoxia-induced structural and functional changes of the hippocampal network
- PMID: 37841285
- PMCID: PMC10576450
- DOI: 10.3389/fncel.2023.1277375
Mild hypoxia-induced structural and functional changes of the hippocampal network
Abstract
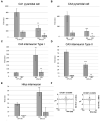
Hypoxia causes structural and functional changes in several brain regions, including the oxygen-concentration-sensitive hippocampus. We investigated the consequences of mild short-term hypoxia on rat hippocampus in vivo. The hypoxic group was treated with 16% O2 for 1 h, and the control group with 21% O2. Using a combination of Gallyas silver impregnation histochemistry revealing damaged neurons and interneuron-specific immunohistochemistry, we found that somatostatin-expressing inhibitory neurons in the hilus were injured. We used 32-channel silicon probe arrays to record network oscillations and unit activity from the hippocampal layers under anaesthesia. There were no changes in the frequency power of slow, theta, beta, or gamma bands, but we found a significant increase in the frequency of slow oscillation (2.1-2.2 Hz) at 16% O2 compared to 21% O2. In the hilus region, the firing frequency of unidentified interneurons decreased. In the CA3 region, the firing frequency of some unidentified interneurons decreased while the activity of other interneurons increased. The activity of pyramidal cells increased both in the CA1 and CA3 regions. In addition, the regularity of CA1, CA3 pyramidal cells' and CA3 type II and hilar interneuron activity has significantly changed in hypoxic conditions. In summary, a low O2 environment caused profound changes in the state of hippocampal excitatory and inhibitory neurons and network activity, indicating potential changes in information processing caused by mild short-term hypoxia.
Keywords: dark neuron; electrophysiology; hippocampus; mild hypoxia; network oscillation.
Copyright © 2023 Hencz, Magony, Thomas, Kovacs, Szilagyi, Pal and Sik.
Conflict of interest statement
The authors declare that the research was conducted in the absence of any commercial or financial relationships that could be construed as a potential conflict of interest. The author(s) declared that they were an editorial board member of Frontiers, at the time of submission. This had no impact on the peer review process and the final decision.
Figures


Similar articles
-
Short-term hyperoxia-induced functional and morphological changes in rat hippocampus.Front Cell Neurosci. 2024 Apr 15;18:1376577. doi: 10.3389/fncel.2024.1376577. eCollection 2024. Front Cell Neurosci. 2024. PMID: 38686017 Free PMC article.
-
Transition between fast and slow gamma modes in rat hippocampus area CA1 in vitro is modulated by slow CA3 gamma oscillations.J Physiol. 2014 Feb 15;592(4):605-20. doi: 10.1113/jphysiol.2013.263889. Epub 2013 Nov 25. J Physiol. 2014. PMID: 24277864 Free PMC article.
-
Excitatory Inputs Determine Phase-Locking Strength and Spike-Timing of CA1 Stratum Oriens/Alveus Parvalbumin and Somatostatin Interneurons during Intrinsically Generated Hippocampal Theta Rhythm.J Neurosci. 2016 Jun 22;36(25):6605-22. doi: 10.1523/JNEUROSCI.3951-13.2016. J Neurosci. 2016. PMID: 27335395 Free PMC article.
-
Interneurons in rat hippocampus after cerebral ischemia. Morphometric, functional, and therapeutic investigations.Acta Neurol Scand Suppl. 1993;150:1-32. Acta Neurol Scand Suppl. 1993. PMID: 7907456 Review.
-
Hippocampus as comparator: role of the two input and two output systems of the hippocampus in selection and registration of information.Hippocampus. 2001;11(5):578-98. doi: 10.1002/hipo.1073. Hippocampus. 2001. PMID: 11732710 Review.
Cited by
-
Oxygen Saturation Targeting in the Neonatal Intensive Care Unit.J Clin Med. 2025 Jun 4;14(11):3975. doi: 10.3390/jcm14113975. J Clin Med. 2025. PMID: 40507737 Free PMC article. Review.
-
Opposite and Differently Altered Postmortem Changes in H3 and H3K9me3 Patterns in the Rat Frontal Cortex and Hippocampus.Epigenomes. 2024 Mar 18;8(1):11. doi: 10.3390/epigenomes8010011. Epigenomes. 2024. PMID: 38534795 Free PMC article.
-
Hypoxia's Impact on Hippocampal Functional Connectivity: Insights from Resting-State fMRI Studies.Brain Sci. 2025 Jun 14;15(6):643. doi: 10.3390/brainsci15060643. Brain Sci. 2025. PMID: 40563813 Free PMC article. Review.
-
Short-term hyperoxia-induced functional and morphological changes in rat hippocampus.Front Cell Neurosci. 2024 Apr 15;18:1376577. doi: 10.3389/fncel.2024.1376577. eCollection 2024. Front Cell Neurosci. 2024. PMID: 38686017 Free PMC article.
-
Aspects on Oxygenation in Preterm Infants before, Immediately after Birth, and Beyond.Neonatology. 2024;121(5):562-569. doi: 10.1159/000540481. Epub 2024 Aug 1. Neonatology. 2024. PMID: 39089224 Free PMC article. Review.
References
-
- Aliev G., Priyadarshini M., Reddy V. P., Grieg N. H., Kaminsky Y., Cacabelos R., et al. . (2014). Oxidative stress mediated mitochondrial and vascular lesions as markers in the pathogenesis of Alzheimer disease. Curr. Med. Chem. 21, 2208–2217. doi: 10.2174/0929867321666131227161303, PMID: - DOI - PubMed
-
- Atillo A., Söderfeldt B., Kalimo H., Olsson Y., Siesjö B. K. (1983). Pathogenesis of brain lesions caused by experimental epilepsy. Light- and electron-microscopic changes in the rat hippocampus following bicuculline-induced status epilepticus. Acta Neuropathol. 59, 11–24. doi: 10.1007/BF00690312 - DOI - PubMed
LinkOut - more resources
Full Text Sources
Miscellaneous

