. 2023 Oct 11;10(5):054501.
doi: 10.1063/4.0000206. eCollection 2023 Sep.

Electron population dynamics in resonant non-linear x-ray absorption in nickel at a free-electron laser

Affiliations

Electron population dynamics in resonant non-linear x-ray absorption in nickel at a free-electron laser

Robin Y Engel et al. Struct Dyn. .

Abstract

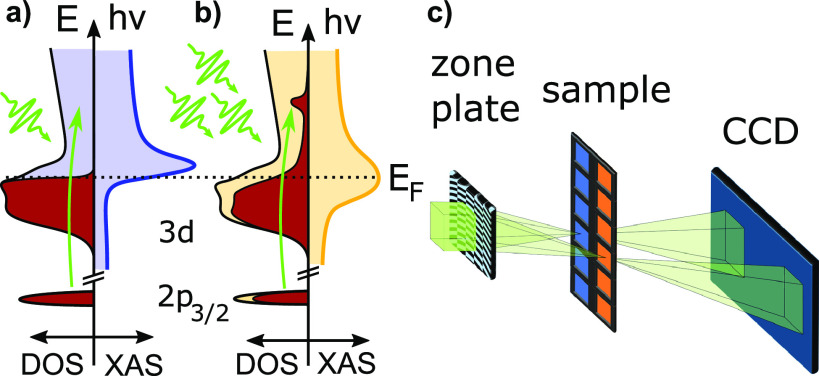
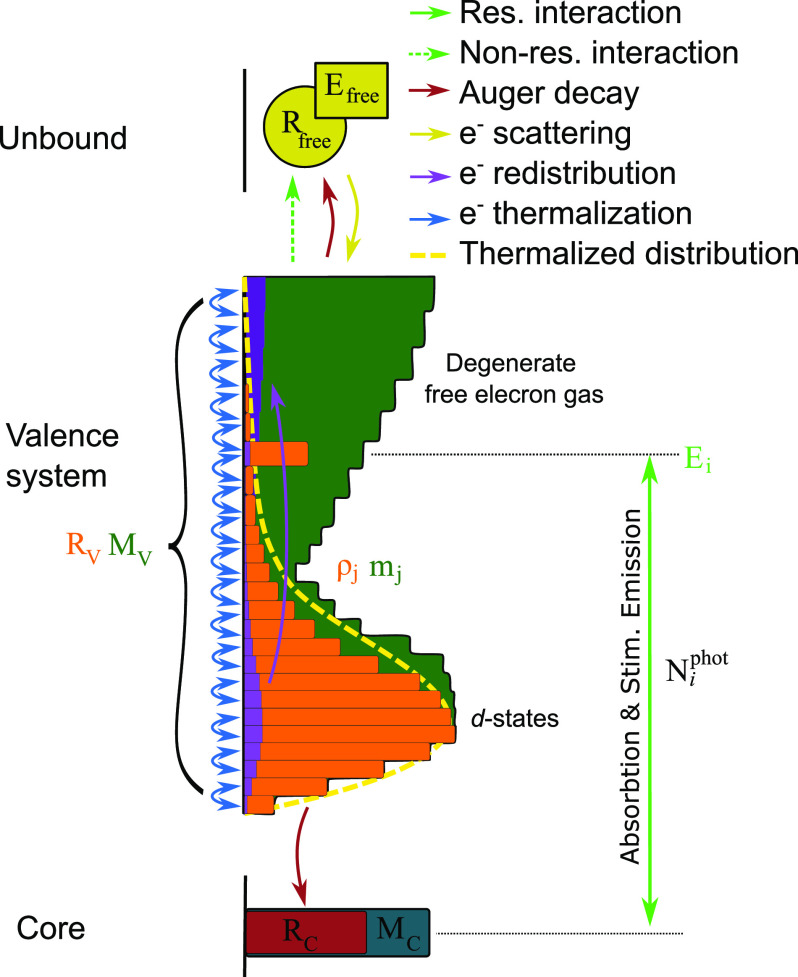
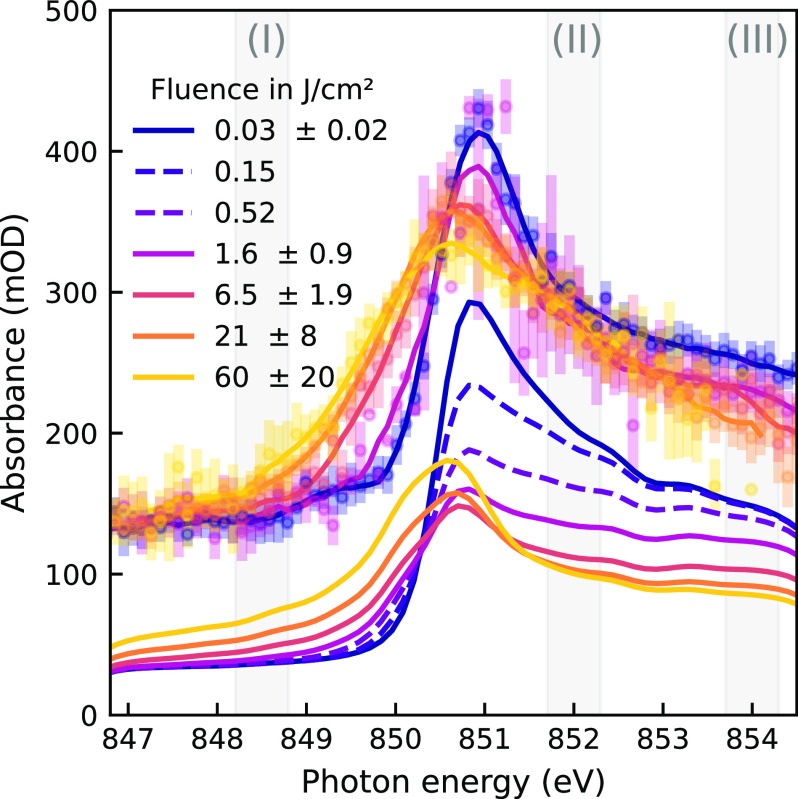
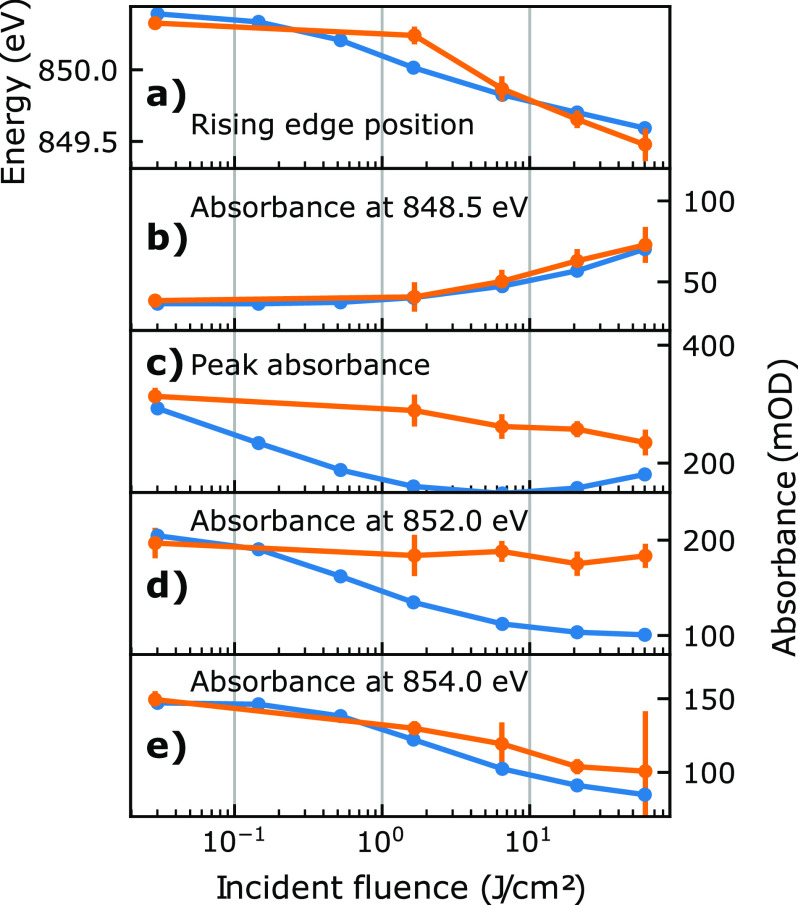
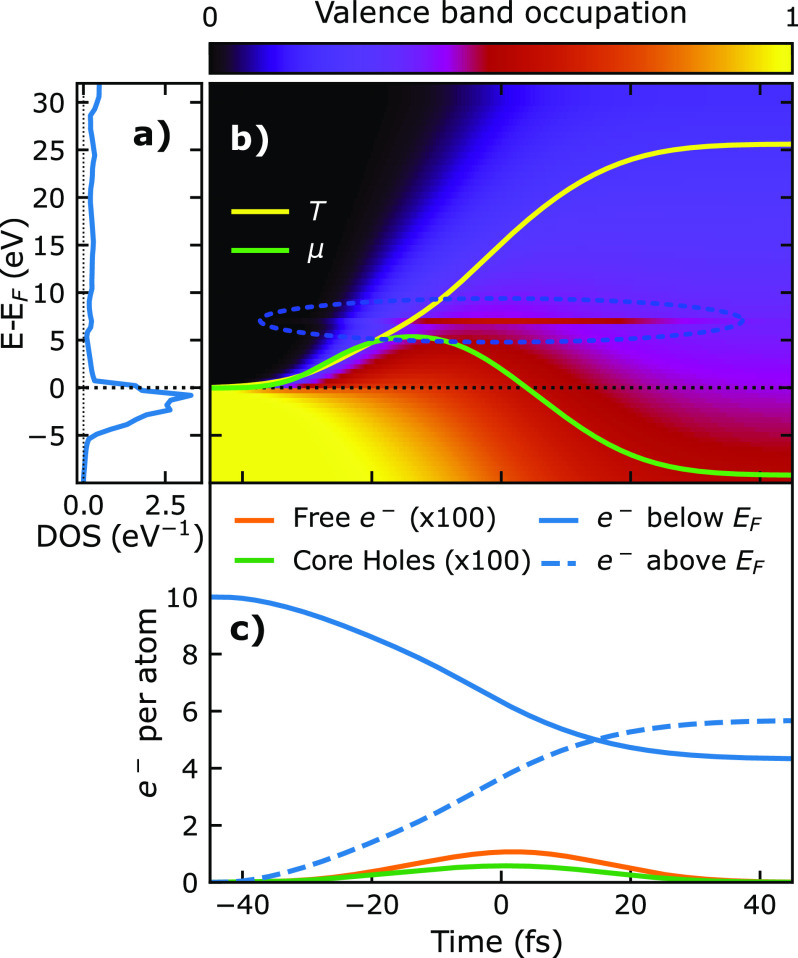
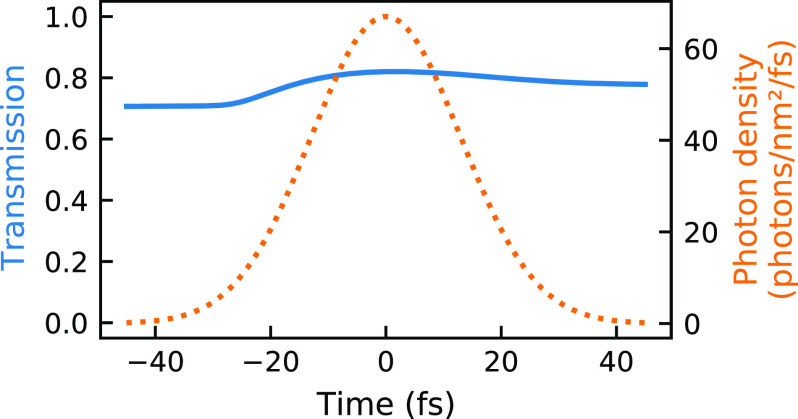
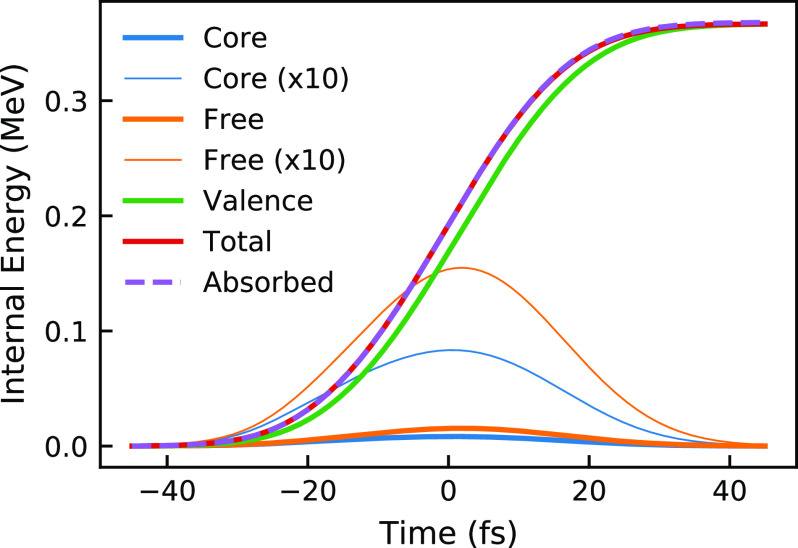
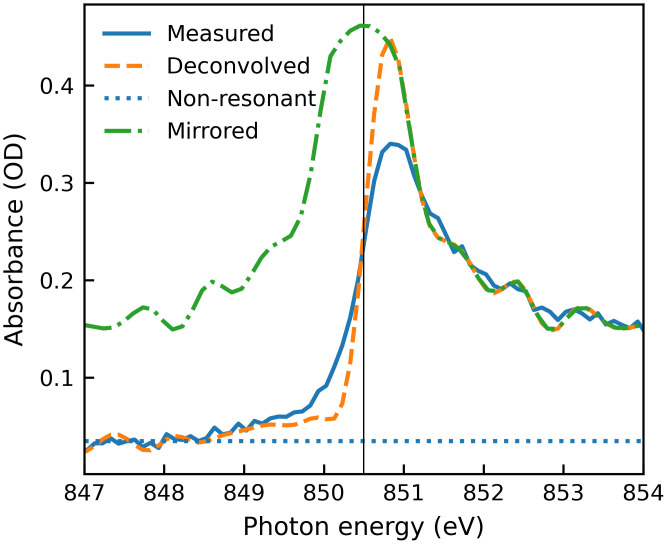
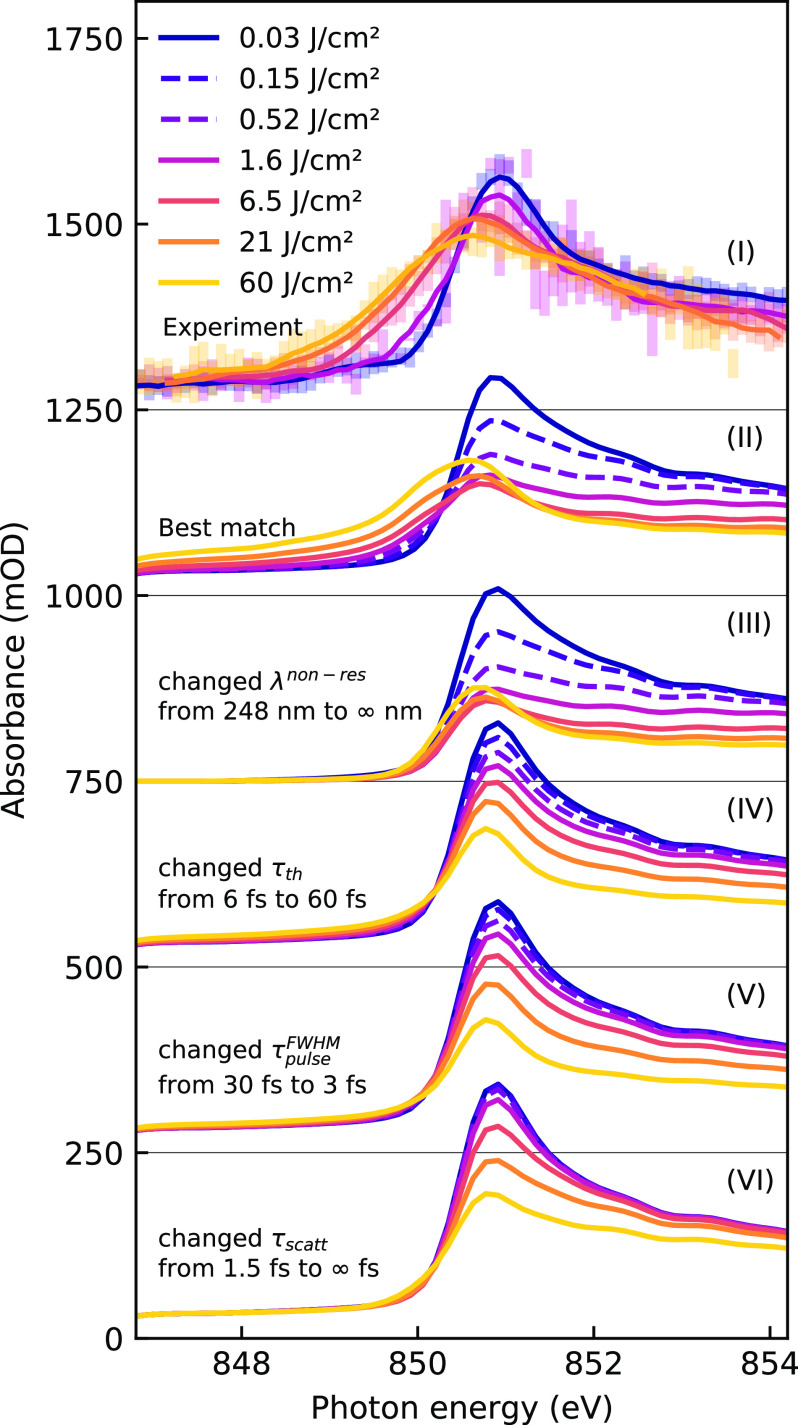
Free-electron lasers provide bright, ultrashort, and monochromatic x-ray pulses, enabling novel spectroscopic measurements not only with femtosecond temporal resolution: The high fluence of their x-ray pulses can also easily enter the regime of the non-linear x-ray-matter interaction. Entering this regime necessitates a rigorous analysis and reliable prediction of the relevant non-linear processes for future experiment designs. Here, we show non-linear changes in the L3-edge absorption of metallic nickel thin films, measured with fluences up to 60 J/cm2. We present a simple but predictive rate model that quantitatively describes spectral changes based on the evolution of electronic populations within the pulse duration. Despite its simplicity, the model reaches good agreement with experimental results over more than three orders of magnitude in fluence, while providing a straightforward understanding of the interplay of physical processes driving the non-linear changes. Our findings provide important insights for the design and evaluation of future high-fluence free-electron laser experiments and contribute to the understanding of non-linear electron dynamics in x-ray absorption processes in solids at the femtosecond timescale.


Conflict of interest statement

The authors have no conflicts to disclose.

Figures

FIG. 1.
FIG. 1.
(a) Absorption at low fluences. The electronic system remains mostly in the ground state. The left side shows the density of states, red occupied and blue unoccupied, while the right side displays the resulting spectrum. (b) Absorption at high fluence. Later parts of the x-ray pulse probe a hot electronic system and see less unoccupied valence states at the resonant energy (bleaching). Unoccupied states and spectrum are shown in yellow. (c) Setup for non-linear XAS. The split-beam-normalization scheme uses a special zone plate, which generates two adjacent beam foci for transmission through the sample and a reference membrane before the beams impinge on the detector.
FIG. 2.
FIG. 2.
Photon, electron, and energy densities and their interactions. A photon density Niphot drives resonant interactions between the core electrons RC and specific valence electrons ρj. It also drives non-resonant excitations from the entire valence electron system RV=jρj to free electrons Rfree, which have a total energy of Efree. Auger–Meitner decays transfer electrons from the valence system to both core states and free electrons; scattering cascades transfer electrons and energy from the free states to the valence system; thermalization drives the valence system toward a thermalized Fermi–Dirac distribution. MC,MV, and mj represent the number of available states and are pictured as bars to represent the energy bins of the numerical calculation.
FIG. 3.
FIG. 3.
Fluence-dependent Ni L3-edge spectra, measured (top) and simulated (bottom). The fluence of events contributing to each spectrum is given in the legend in terms of mean and standard deviation. Dashed simulated spectra do not have a corresponding measurement. The regions of interest from which absorbance changes shown in panels (b), (d), and (e) of Fig. 4 were quantified are shaded and labeled (I) (II), and (III), respectively. The error bars are shown for the measured spectra and represent the 95% confidence intervals for each bin of 102 meV width; solid lines of the measured spectra are smoothed using a Savitzky–Golay filter using windows of 21 bins and fourth-order polynomials. The experimental spectra are vertically offset by 100 mOD.
FIG. 4.
FIG. 4.
Comparison of spectral effects between simulation (blue lines) and experiment (orange lines with error bars). The shift of the absorption edge in panel (a) represents the photon energy at which the half-maximum of the absorption peak is reached. The absorbance changes in panels (b), (d) and (e) are integrated from the gray shaded regions in Fig. 3, while panel (c) shows the global maximum of the spectrum.
FIG. 5.
FIG. 5.
Evolution of electronic populations (simulation) in a single voxel at the sample surface for a pulse of 858.3 eV, with a pulse energy of 30  J/cm2. Panel (a) shows the total DOS used as an input for the simulation. Panel (b) shows the energy-resolved occupation (between 0 and 1) of the valence band over time, relative to the Fermi energy, and shares the corresponding axes with panels (a) and (c). The population (in electrons/atom/eV) is the product of the DOS and the occupation. The thermalized valence occupation lags a few femtoseconds behind the current chemical potential μ; the temperature T of the valence system rises rapidly, ultimately reaching up to 25 eV. The bleaching of valence states (highlighted with a blue dotted ellipse) is visible as a high non-thermal population at the resonant photon energy around 7 eV above the Fermi level. Panel (c) shows the number of core holes and free electrons over time, as well as the number of electrons in the valence system below and above the Fermi energy.
FIG. 6.
FIG. 6.
Instantaneous transmission (including resonant and non-resonant absorption) over time for a pulse at 857.5 eV with a pulse energy of 30  J/cm2 (blue line, left axis), as well as the temporal profile of the incident photon density (orange dots, right axis).
FIG. 7.
FIG. 7.
Temperature and chemical potential over time for a pulse at 857.5 eV with a pulse energy of 30  J/cm2. The solid line represents the properties at the sample surface and the thin lines represent the deeper layers that are exposed to less x-ray fluence, as indicated by arrows and increasing transparency.
FIG. 8.
FIG. 8.
Energy in the sample system over time for a pulse at 857.5 eV, integrated over the full 20 nm thickness of the sample and a 1 nm2 area illuminated with a fluence of 30  J/cm2. The absorbed energy is calculated from the difference between incident and transmitted photons, while the total energy is a sum of the energy held in the electronic sub-systems of core-holes, free electrons, and valence excitation. Due to the fast process rates in comparison to the pulse duration, the energy held in core excitations and free electrons remains small, which is why a 10 times scaled curve is also shown.
FIG. 9.
FIG. 9.
Derivation of absorption lengths as input parameters, reconstructed from a measured ground-state spectrum (blue line). The non-resonant absorption level (blue dots) was determined from the pre-edge region. The measured resonant absorption length was deconvolved with the experimental resolution (orange dashes) and mirrored around the rising edge to retrieve a symmetric resonant absorption length around the resonance (green dotted-dashed line). See main text for details.
FIG. 10.
FIG. 10.
Fluence-dependent Ni L3-edge spectra, simulated with different parameters and compared to the measurements. For the spectra (III) to (VI), one parameter was varied with respect to the best match (II). Each set of spectra is offset by another 250 mOD as indicated by the horizontal lines. The error bars of the experimental data represent the 95% confidence intervals for each bin of 102 meV width; the solid lines represent smoothed spectra using a Savitzky–Golay filter using windows of 21 bins and fourth-order polynomials. The average fluence of events contributing to each spectrum is given in the legend. Dashed simulated spectra do not have a corresponding measurement.
FIG. 11.
FIG. 11.
Sorting of FEL shots. Gray points represent events which were excluded based on rigid criteria, mainly their correlation coefficient Ccorr. Colored points were analyzed using the iterative Gaussian Mixture Model (GMM) optimization. The colorbar shows the estimated posterior probability Pok that a given shot cleanly probed an unperturbed sample. The green and orange solid lines represent the initial and final average spectrum estimated by the GMM, respectively.
FIG. 12.
FIG. 12.
SEM images of the used samples. The top image shows a stitched overview image of a nickel film window. One can see rows of FEL imprints as well as the tearing of the membrane. The bottom image shows a single FEL imprint in a SiN reference membrane.
FIG. 13.
FIG. 13.
Spot size characterization. (a) Liu's plot to determine the pulse energy damage thresholds. (b) Normalized pulse energy plot to determine the effective area. The legend differentiates the spot groups corresponding to Table IV with colors valid for all three panels. (c) Area of FEL foci, comparing the effective area measurements (dots and error bars) to the ray tracing results (line plots) for two focal distances. For groups (2) and (3) no error estimate could be calculated (see the text).

Similar articles

Cited by

References

    1. Rossbach J., Schneider J. R., and Wurth W., “ 10 years of pioneering x-ray science at the free-electron laser FLASH at DESY,” Phys. Rep. 808, 1–74 (2019). 10.1016/j.physrep.2019.02.002 - DOI
    1. Bostedt C., Boutet S., Fritz D. M., Huang Z., Lee H. J., Lemke H. T., Robert A., Schlotter W. F., Turner J. J., and Williams G. J., “ Linac coherent light source: The first five years,” Rev. Mod. Phys. 88, 015007 (2016). 10.1103/RevModPhys.88.015007 - DOI
    1. Nagler B., Zastrau U., Fäustlin R. R., Vinko S. M., Whitcher T., Nelson A. J., Sobierajski R., Krzywinski J., Chalupsky J., Abreu E., Bajt S., Bornath T., Burian T., Chapman H., Cihelka J., Döppner T., Düsterer S., Dzelzainis T., Fajardo M., Förster E., Fortmann C., Galtier E., Glenzer S. H., Göde S., Gregori G., Hajkova V., Heimann P., Juha L., Jurek M., Khattak F. Y., Khorsand A. R., Klinger D., Kozlova M., Laarmann T., Lee H. J., Lee R. W., Meiwes-Broer K.-H., Mercere P., Murphy W. J., Przystawik A., Redmer R., Reinholz H., Riley D., Röpke G., Rosmej F., Saksl K., Schott R., Thiele R., Tiggesbäumker J., Toleikis S., Tschentscher T., Uschmann I., Vollmer H. J., and Wark J. S., “ Turning solid aluminium transparent by intense soft x-ray photoionization,” Nat. Phys. 5, 693–696 (2009). 10.1038/nphys1341 - DOI
    1. Recoules V. and Mazevet S., “ Temperature and density dependence of XANES spectra in warm dense aluminum plasmas,” Phys. Rev. B 80, 064110 (2009). 10.1103/PhysRevB.80.064110 - DOI
    1. Di Cicco A., Hatada K., Giangrisostomi E., Gunnella R., Bencivenga F., Principi E., Masciovecchio C., and Filipponi A., “ Interplay of electron heating and saturable absorption in ultrafast extreme ultraviolet transmission of condensed matter,” Phys. Rev. B 90, 220303(R) (2014). 10.1103/PhysRevB.90.220303 - DOI