. 2023 Sep 29:10:1242257.
doi: 10.3389/fnut.2023.1242257. eCollection 2023.

Genetic determinants of Vitamin D deficiency in the Middle Eastern Qatari population: a genome-wide association study

Affiliations

Genetic determinants of Vitamin D deficiency in the Middle Eastern Qatari population: a genome-wide association study

Nagham Nafiz Hendi et al. Front Nutr. .

Abstract

Introduction: Epidemiological studies have consistently revealed that Vitamin D deficiency is most prevalent in Middle Eastern countries. However, research on the impact of genetic loci and polygenic models related to Vitamin D has primarily focused on European populations.

Methods: We conducted the first genome-wide association study to identify genetic determinants of Vitamin D levels in Middle Easterners using a whole genome sequencing approach in 6,047 subjects from the Qatar Biobank (QBB) project. We performed a GWAS meta-analysis, combining the QBB cohort with recent European GWAS data from the UK Biobank (involving 345,923 individuals). Additionally, we evaluated the performance of European-derived polygenic risk scores using UK Biobank data in the QBB cohort.

Results: Our study identified an association between a variant in a known locus for the group-specific component gene (GC), specifically rs2298850 (p-value = 1.71 × 10-08, Beta = -0.1285), and Vitamin D levels. Furthermore, our GWAS meta-analysis identified two novel variants at a known locus on chromosome 11, rs67609747 and rs1945603, that reached the GWAS significance threshold. Notably, we observed a moderately high heritability of Vitamin D, estimated at 18%, compared to Europeans. Despite the lower predictive performance of Vitamin D levels in Qataris compared to Europeans, the European-derived polygenic risk scores exhibited significant links to Vitamin D deficiency risk within the QBB cohort.

Conclusion: This novel study reveals the genetic architecture contributing to Vitamin D deficiency in the Qatari population, emphasizing the genetic heterogeneity across different populations.

Keywords: Middle Eastern; Vitamin D deficiency; genetic predispositions; genome-wide association study; polygenic risk score.


Conflict of interest statement

The authors declare that the research was conducted in the absence of any commercial or financial relationships that could be construed as a potential conflict of interest.

Figures

Figure 1
Figure 1
Manhattan and Q-Q Plots illustrating Genome-Wide Association Results for Serum 25(OH)D Levels. (A) Manhattan plot for the GWAS performed using linear mixed models correcting for age, gender, the first four principal components, and relatedness. Chromosomal positions of genetic variants (N = 7,880,618) plotted against the –log10 p value. Genome-wide significance threshold (value of p < 5 × 10−8) is presented as a horizontal red line. (B) Q-Q plot shows the observed –log10 p values and the expected –log10 p values.
Figure 2
Figure 2
Linkage disequilibrium (LD) plot for the top-associated locus. LocusZoom plots of the leading maker of Vitamin D, rs2298850, on chromosome 4 (in purple diamonds). The left vertical axis of the Manhattan plot represents p values as a logarithmic scale, while the right vertical axis shows recombination rates as a blue line, with chromosomal positions being indicated on the horizontal axis. Bottom panel presents gene names and locations. Arrows are utilized to annotate genes within the region, while linkage disequilibrium relationships of each SNP with the lead SNP are depicted in color-coded r2 values.
Figure 3
Figure 3
Comparison of allele frequency and effect size for common variants between QBB and United Kingdom Biobank. (A) Risk allele frequency correlation for overlapped variants in QBB and European study (r = 0.60). (B) Effect weight correlation for overlapped variants in QBB and European study (r = 0.80). The best-fit line from linear regression analysis is presented as a red line. (C) The effect weight (Beta) of SNPs shows replication after correction in the Qatari population (QBB, red bars) compared to the European population (United Kingdom Biobank, gray bars).
Figure 4
Figure 4
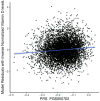
Performance of the European-derived PRS in the Qatari Population. Linear regression of inverse-normalized baseline Vitamin D levels and weighted polygenic risk scores (PRS) derived from a large European dataset (PGS000702: R = 0.098, p value = 4.60 × 10−14). The blue line represents the best fit of linear regression analysis.
Figure 5
Figure 5
Prediction of Vitamin D status using European-derived PRS in the Qatari Population. Receiver Operating Characteristic (ROC) curve of the European-derived PRS on QBB cohort for the prediction of (A) Vitamin D deficiency [25(OH)D < 20 ng/mL], and (B) Vitamin D insufficiency and deficiency [25(OH)D < 30 ng/mL]. Area under the ROC curve (AUC) is reported in the image.

References

    1. Amrein K, Scherkl M, Hoffmann M, Neuwersch-Sommeregger S, Köstenberger M, Tmava Berisha A, et al. Vitamin D deficiency 2.0: an update on the current status worldwide. Eur J Clin Nutr. (2020) 74:1498–513. doi: 10.1038/s41430-020-0558-y, PMID: - DOI - PMC - PubMed
    1. Mitchell BL, Zhu G, Medland SE, Renteria ME, Eyles DW, Grasby KL, et al. Half the genetic variance in vitamin D concentration is shared with skin colour and sun exposure genes. Behav Genet. (2019) 49:386–98. doi: 10.1007/s10519-019-09954-x, PMID: - DOI - PubMed
    1. Mills NT, Wright MJ, Henders AK, Eyles DW, Baune BT, McGrath JJ, et al. Heritability of transforming growth factor-β1 and tumor necrosis factor-receptor type 1 expression and vitamin D levels in healthy adolescent twins. Twin Res Hum Genet. (2015) 18:28–35. doi: 10.1017/thg.2014.70, PMID: - DOI - PubMed
    1. Orton SM, Morris AP, Herrera BM, Ramagopalan SV, Lincoln MR, Chao MJ, et al. Evidence for genetic regulation of vitamin D status in twins with multiple sclerosis. Am J Clin Nutr. (2008) 88:441–7. doi: 10.1093/ajcn/88.2.441, PMID: - DOI - PMC - PubMed
    1. Shea MK, Benjamin EJ, Dupuis J, Massaro JM, Jacques PF, D'Agostino RB, Sr, et al. Genetic and non-genetic correlates of vitamins K and D. Eur J Clin Nutr. (2009) 63:458–64. doi: 10.1038/sj.ejcn.1602959, PMID: - DOI - PMC - PubMed