. 2023 Sep 28:14:1279699.
doi: 10.3389/fpls.2023.1279699. eCollection 2023.

FZL, a dynamin-like protein localized to curved grana edges, is required for efficient photosynthetic electron transfer in Arabidopsis

Affiliations

FZL, a dynamin-like protein localized to curved grana edges, is required for efficient photosynthetic electron transfer in Arabidopsis

Yu Ogawa et al. Front Plant Sci. .

Abstract

Photosynthetic electron transfer and its regulation processes take place on thylakoid membranes, and the thylakoid of vascular plants exhibits particularly intricate structure consisting of stacked grana and flat stroma lamellae. It is known that several membrane remodeling proteins contribute to maintain the thylakoid structure, and one putative example is FUZZY ONION LIKE (FZL). In this study, we re-evaluated the controversial function of FZL in thylakoid membrane remodeling and in photosynthesis. We investigated the sub-membrane localization of FZL and found that it is enriched on curved grana edges of thylakoid membranes, consistent with the previously proposed model that FZL mediates fusion of grana and stroma lamellae at the interfaces. The mature fzl thylakoid morphology characterized with the staggered and less connected grana seems to agree with this model as well. In the photosynthetic analysis, the fzl knockout mutants in Arabidopsis displayed reduced electron flow, likely resulting in higher oxidative levels of Photosystem I (PSI) and smaller proton motive force (pmf). However, nonphotochemical quenching (NPQ) of chlorophyll fluorescence was excessively enhanced considering the pmf levels in fzl, and we found that introducing kea3-1 mutation, lowering pH in thylakoid lumen, synergistically reinforced the photosynthetic disorder in the fzl mutant background. We also showed that state transitions normally occurred in fzl, and that they were not involved in the photosynthetic disorders in fzl. We discuss the possible mechanisms by which the altered thylakoid morphology in fzl leads to the photosynthetic modifications.

Keywords: Arabidopsis; FUZZY ONION LIKE (FZL); chloroplast; photosynthetic electron transfer; thylakoid; thylakoid structure.


Conflict of interest statement

The authors declare that the research was conducted in the absence of any commercial or financial relationships that could be construed as a potential conflict of interest.

Figures

Figure 1
Figure 1
Sub-chloroplast localization of FZL. (A) Subfractionation of chloroplasts and immunodetection of FZL. Isolated WT chloroplasts (Cp) were separated into envelope (En), stroma (St), and thylakoids (Th). Tic110 (envelope), RbcL (stroma), and CF1γ (thylakoids) were detected as markers of chloroplast fractionation. Overexposed data are also shown for detection of FZL and CF1γ. The black arrowhead indicates the FZL signals detected in envelope and stroma fraction in the overexposed immunoblotting. (B) Subfractionation of thylakoids and immunodetection of FZL. Isolated WT thylakoids (Th) were treated with digitonin and separated into grana core (GC), grana margins (GM), curvature fraction (CU) and stroma lamellae (SL). D1 (grana), PsaA (stroma lamellae) and CURT1A (curvature fraction) were detected as markers of thylakoid fractionation. Loading was normalized by equal chlorophyll amount. (C) Confocal micrographs of a thylakoid isolated from plants expressing FZL-GFP. Each of the yellow circles marks individual granum. Bar = 1 μm.
Figure 2
Figure 2
Different fzl mutant alleles used in this study. (A) A diagram showing the T-DNA insertion site in each allele. Exons are indicated by white rectangles and introns by black lines. Bar = 250 bp. (B) A photograph of plants. Bar = 10 mm.
Figure 3
Figure 3
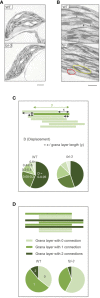
Ultrastructure of WT and fzl-3 thylakoids. (A) Transmission electron microphotographs of WT and fzl-3 chloroplasts. Bar = 1 μm. (B) Transmission electron microphotographs of WT and fzl-3 thylakoids. The yellow circle marks the grana with staggered stacking and the red circle indicates the grana periphery for which interconnected stroma lamellae are not apparent on this section. Bar = 500 nm. (C) Comparison of staggering of grana stacking. It was quantitatively compared by measuring D (Displacement), defined as displacement lengths between grana layers indicated by the green rectangles (x) normalized against the grana layer lengths (y) (top). Distributions of D values are presented as pie charts. Darker greens represent lower D values and smaller displacements between grana layers (below) (n = 1051 to 1765). (D) Comparison of abundance of interconnections between grana and stroma lamellae. It was evaluated by frequencies of grana layers with different numbers of connections to neighboring stroma lamellae. In sectional views of grana, each layer has 0 (isolated from stroma lamellae; light green), 1 (connected to stroma lamellae at one end; green) or 2 (connected to stroma lamellae at both ends; dark green) connections (top). Distributions of grana layers with different connection numbers are presented as pie charts (below) (n = 310 to 515).
Figure 4
Figure 4
Photosynthetic phenotypes of WT and fzl mutants. (A) Separation of thylakoid protein complexes by BN-PAGE in WT and fzl-3. Each band was identified according to Järvi et al. (2011) and is indicated by black arrowheads at right. mc, megacomplex; sc, supercomplex; di, dimer; mono, monomer; tri, trimer. (B) Immunodetection of photosynthetic proteins in WT, fzl-2, fzl-3 and fzl-4. Thylakoid proteins were analyzed, and loading was normalized by equal chlorophyll amount. For WT, dilution series of proteins were loaded. (C) Fv/Fm in WT and fzl-2, fzl-3 and fzl-4 mutants. Each value is the mean ± SD of 3 to 8 independent replicates. Columns with different letters are significantly different by Tukey-Kramer test (P < 0.05). (D) Light intensity dependence of Y(II) in WT and fzl-2, fzl-3 and fzl-4 mutants (n = 3 to 5). (E) Light intensity dependence of NPQ. (F) Light intensity dependence of qL. Each data point represents the mean ± SD. Different letters indicate statistical significance between genotypes at each light intensity by Tukey-Kramer test (P < 0.05). (G) Light intensity dependence of Y(I) in WT and fzl-3 mutant (n = 3 to 5). (H) Light intensity dependence of Y(ND). (I) Light intensity dependence of Y(NA). Each data point represents the mean ± SD. Asterisks indicate statistical significance between genotypes at each light intensity by Student’s t test (P < 0.05). (J) The time course of Y(II) upon illumination at 120 μmol photons m-2 s-1 in WT and fzl-2, fzl-3 and fzl-4 mutants (n = 3 to 8). (K) The time course induction of NPQ. (L) The time course induction of Y(ND). Each data point represents the mean ± SD. Different letters indicate statistical significance between genotypes at each time point by Tukey-Kramer test (P < 0.05).
Figure 5
Figure 5
ECS analysis and immunodetection of PsbS in WT and fzl-3 mutant. (A) The total size of pmf, calculated as ECSt/ECSST. Measurements were performed after 30 s of illumination at 120 μmol photons m-2 s-1. Each value is the mean ± SD of 2 to 7 independent replicates. (B) Proton conductivity of thylakoid membranes ( gH   + ). (C) Proton flux of thylakoid membranes ( vH   + ), calculated as pmf x gH   + . The asterisks indicate statistical significance (*P < 0.05, **P < 0.01) by Student’s t test. (D) Immunodetection of PsbS. Thylakoid proteins were analyzed, and loading was normalized by equal chlorophyll amount. PetC was immunodetected as a loading control. For WT, dilution series of proteins were loaded.
Figure 6
Figure 6
Photosynthetic phenotypes of WT, fzl-3, kea3-1 and fzl-3 kea3-1 mutants. (A) The time course of Y(II) upon illumination at 120 μmol photons m-2 s-1 (n = 3). (B) The time course induction of NPQ. (C) The time course induction of Y(ND). Each data point represents the mean ± SD. Different letters indicate statistical significance between genotypes at each time point by Tukey-Kramer test (P < 0.05).
Figure 7
Figure 7
Photosynthetic phenotypes of WT, fzl-3, stn7 and fzl-3 stn7 mutants. (A) Quenching of chlorophyll fluorescence due to state transitions (qT). qT values were obtained as described in Pribil et al. (2010). Each value is the mean ± SD of 2 to 3 independent replicates. “n.s.” indicates no statistically significant difference by Student’s t test (P < 0.05). (B) The time course of qL upon illumination at 120 μmol photons m-2 s-1 (n = 2 to 5). (C) The time course of Y(II). Each data point represents the mean ± SD. Different letters indicate statistical significance between genotypes at each time point by Tukey-Kramer test (P < 0.05).
Figure 8
Figure 8
Model schemes of WT and fzl thylakoids. (A) Transmission electron microphotographs of thylakoids (top) and schematic descriptions of thylakoid morphologies (below) in WT and fzl-3. In the schematic picture, orderly stacked grana, staggered grana, and stroma lamellae are symbolized as rectangles, parallelograms, and lines, respectively. The less interconnections between grana via stroma lamellae are depicted in fzl than in WT. The putative model of how the fzl thylakoid morphology arises is shown on the right. The “X”s represent the absence of the fusions between grana and stroma lamellae likely mediated by FZL. The question mark indicates that the model is hypothetical and not demonstrated. Bar = 500 nm. (B) Schematic representation of the possible alterations in photosynthetic processes in fzl thylakoids (right) in comparison with those in WT thylakoids (left). In fzl thylakoids, (i) the staggered grana stacking might affect densely packed PSII-LHCII arrays, resulting in disturbed PQ diffusion over grana, (ii) the less frequent interconnections between grana and stroma lamellae might delay lateral diffusion of PQ and PC, and/or (iii) the fewer grana-stroma lamellae junctions could dam pmf flow from grana to stroma lamellae.

Similar articles

Cited by

References

    1. Allen J. F. (2003). Botany. State transitions–a question of balance. Science 299, 1530–1532. doi: 10.1126/science.1082833 - DOI - PubMed
    1. Amann K., Lezhneva L., Wanner G., Herrmann R. G., Meurer J. (2004). ACCUMULATION OF PHOTOSYSTEM ONE1, a member of a novel gene family, is required for accumulation of [4Fe-4S] cluster-containing chloroplast complexes and antenna proteins. Plant Cell 16, 3084–3097. doi: 10.1105/tpc.104.024935 - DOI - PMC - PubMed
    1. Armbruster U., Carrillo L. R., Venema K., Pavlovic L., Schmidtmann E., Kornfeld A., et al. . (2014). Ion antiport accelerates photosynthetic acclimation in fluctuating light environments. Nat. Commun. 5, 5439. doi: 10.1038/ncomms6439 - DOI - PMC - PubMed
    1. Armbruster U., Labs M., Pribil M., Viola S., Xu W., Scharfenberg M., et al. . (2013). Arabidopsis CURVATURE THYLAKOID1 proteins modify thylakoid architecture by inducing membrane curvature. Plant Cell 25, 2661–2678. doi: 10.1105/tpc.113.113118 - DOI - PMC - PubMed
    1. Avenson T. J., Cruz J. A., Kramer D. M. (2004). Modulation of energy-dependent quenching of excitons in antennae of higher plants. Proc. Natl. Acad. Sci. U. S. A. 101, 5530–5535. doi: 10.1073/pnas.0401269101 - DOI - PMC - PubMed

LinkOut - more resources