. 2023 Jul 11;15(7):2927-2955.
doi: 10.5194/essd-15-2927-2023.

Mapping global non-floodplain wetlands

Affiliations

Mapping global non-floodplain wetlands

Charles R Lane et al. Earth Syst Sci Data. .

Abstract

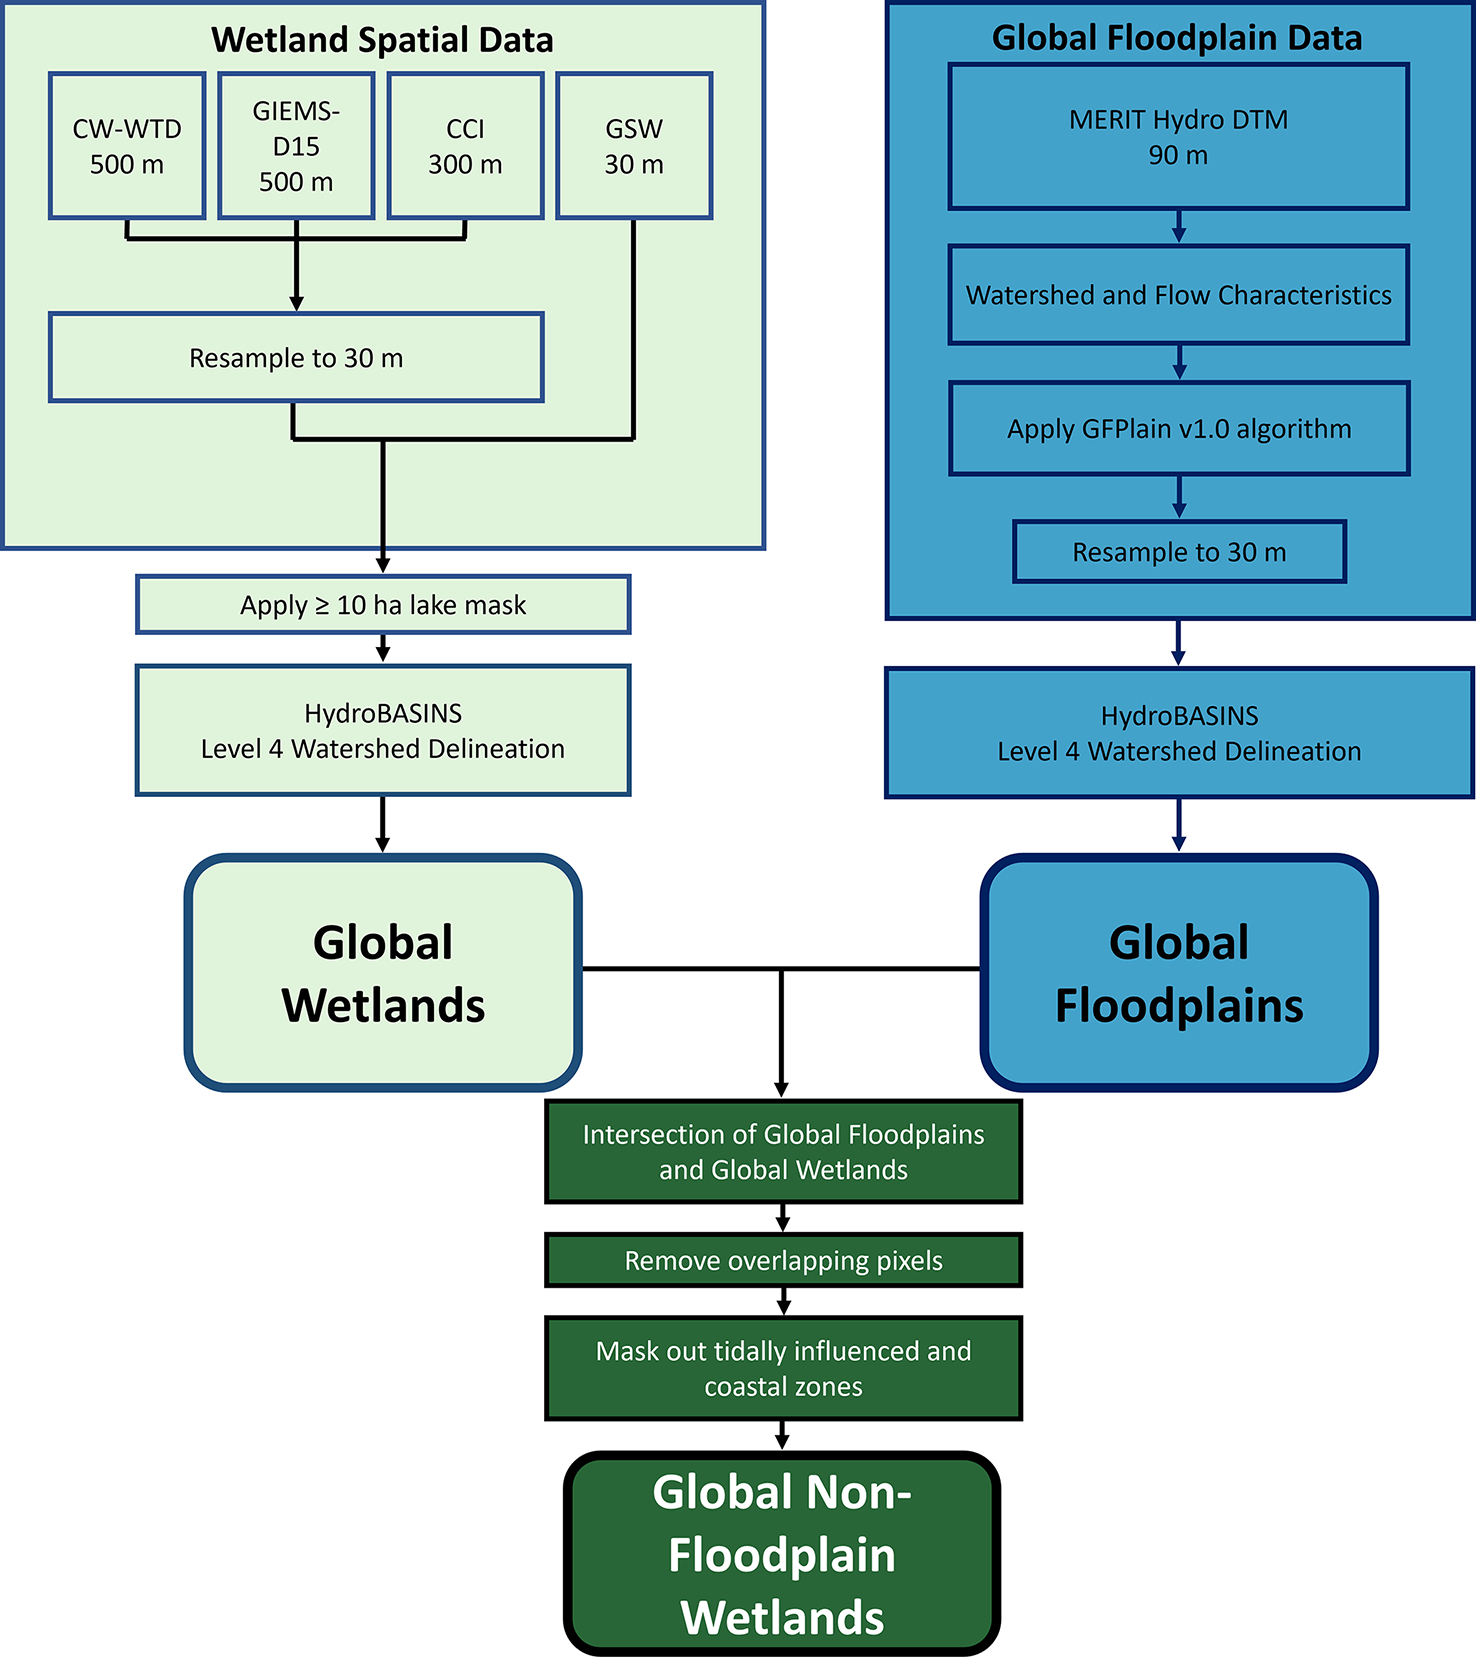
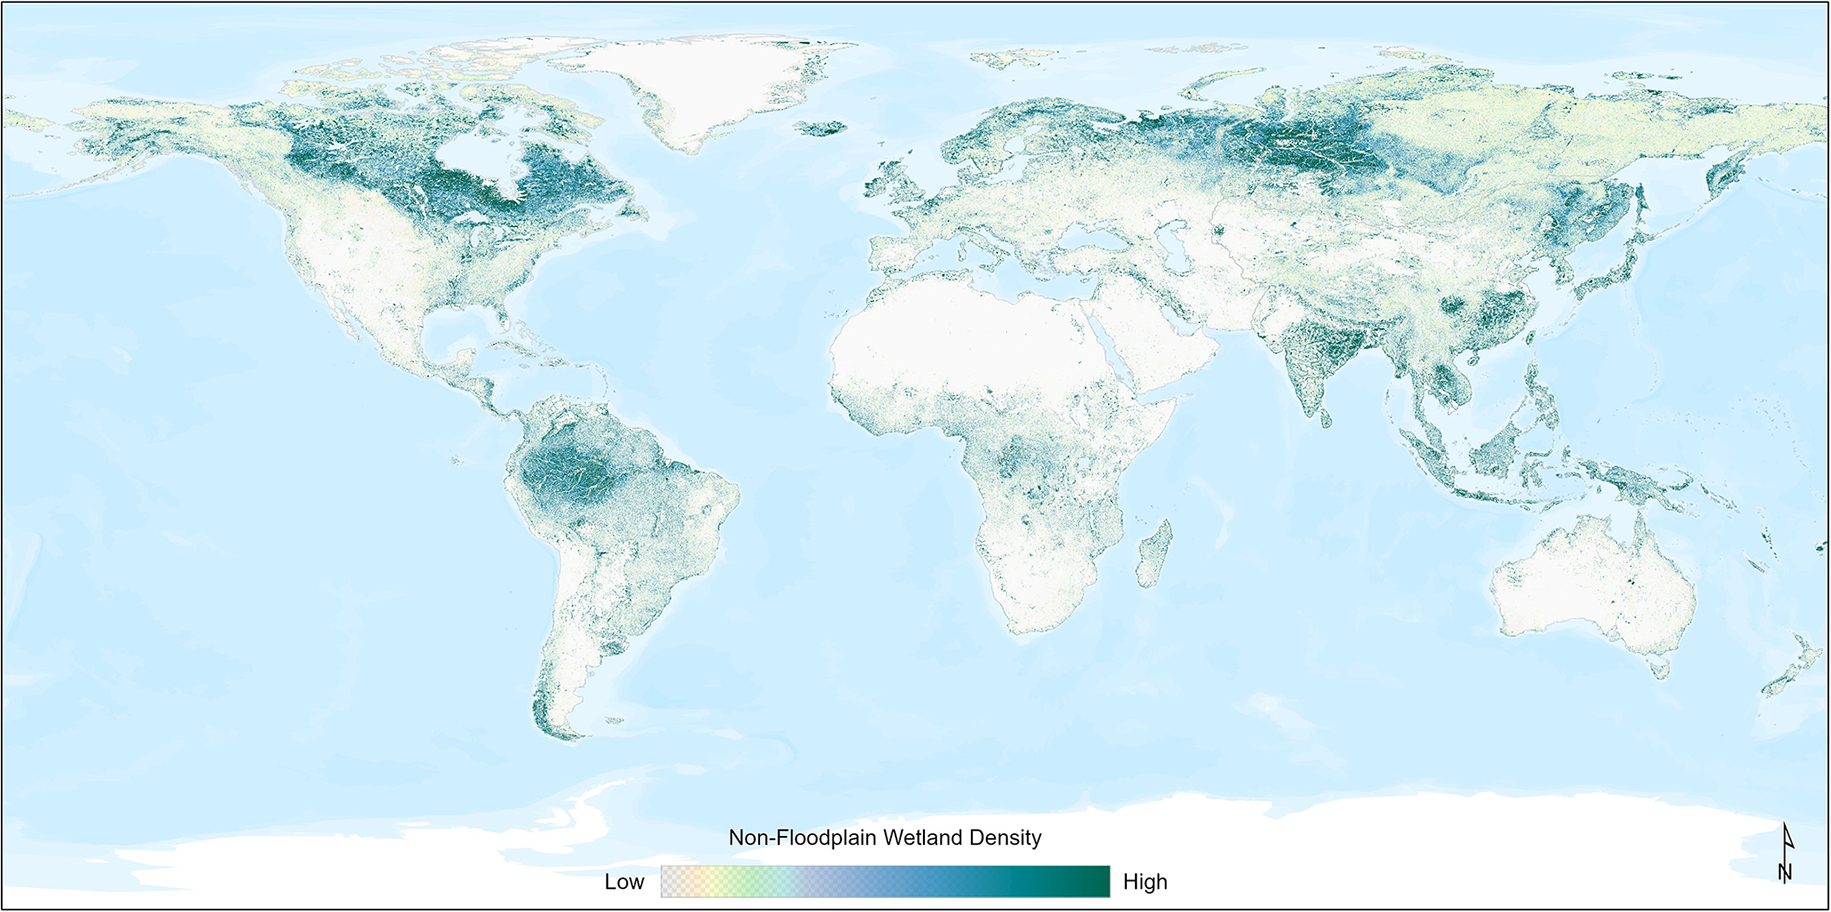
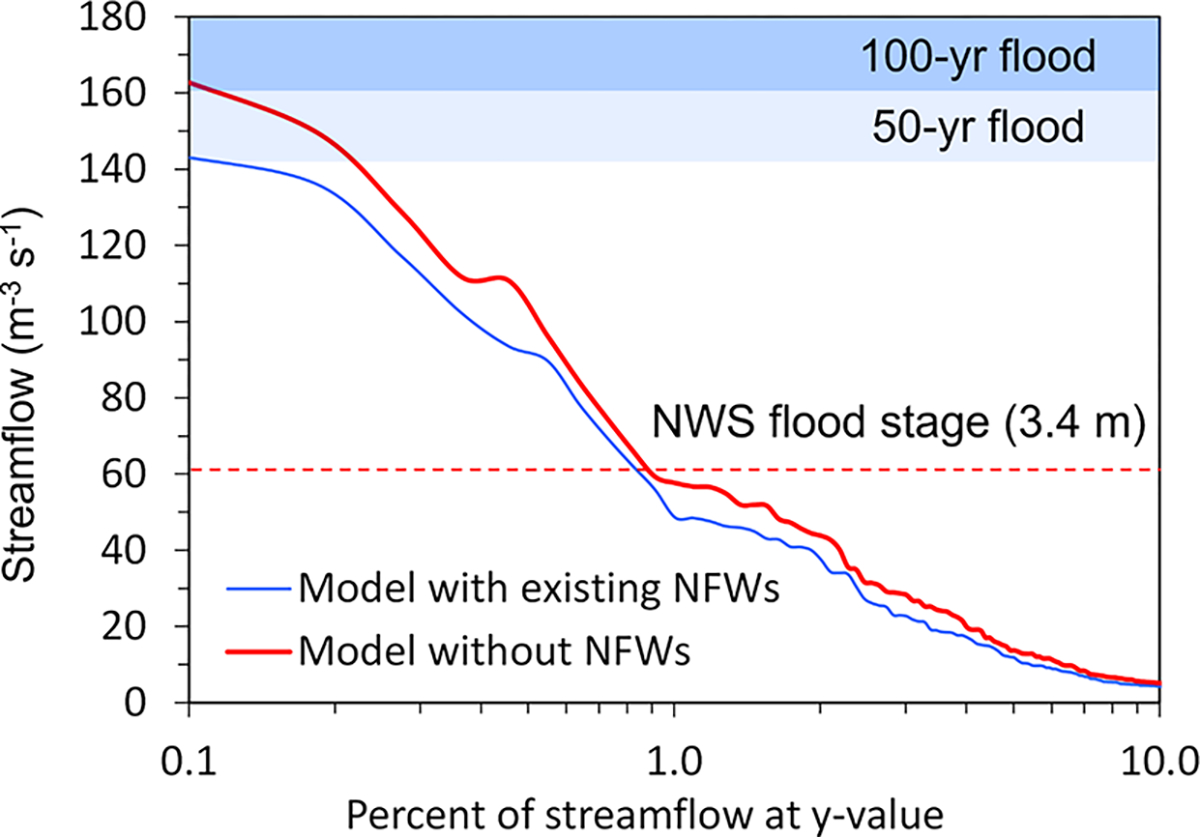
Non-floodplain wetlands - those located outside the floodplains - have emerged as integral components to watershed resilience, contributing hydrologic and biogeochemical functions affecting watershed-scale flooding extent, drought magnitude, and water-quality maintenance. However, the absence of a global dataset of non-floodplain wetlands limits their necessary incorporation into water quality and quantity management decisions and affects wetland-focused wildlife habitat conservation outcomes. We addressed this critical need by developing a publicly available "Global NFW" (Non-Floodplain Wetland) dataset, comprised of a global river-floodplain map at 90 m resolution coupled with a global ensemble wetland map incorporating multiple wetland-focused data layers. The floodplain, wetland, and non-floodplain wetland spatial data developed here were successfully validated within 21 large and heterogenous basins across the conterminous United States. We identified nearly 33 million potential non-floodplain wetlands with an estimated global extent of over 16×106 km2. Non-floodplain wetland pixels comprised 53% of globally identified wetland pixels, meaning the majority of the globe's wetlands likely occur external to river floodplains and coastal habitats. The identified global NFWs were typically small (median 0.039 km2), with a global median size ranging from 0.018-0.138 km2. This novel geospatial Global NFW static dataset advances wetland conservation and resource-management goals while providing a foundation for global non-floodplain wetland functional assessments, facilitating non-floodplain wetland inclusion in hydrological, biogeochemical, and biological model development. The data are freely available through the United States Environmental Protection Agency's Environmental Dataset Gateway (https://gaftp.epa.gov/EPADataCommons/ORD/Global_NonFloodplain_Wetlands/, last access: 24 May 2023) and through https://doi.org/10.23719/1528331 (Lane et al., 2023a).


Figures

Figure 1.
Figure 1.
Data flow chart identifying the main datasets and processes involved in deriving the Global Floodplain and Global Wetland data layers, as well as the intersection of those data to create the Global Non-Floodplain Wetland data product. Curved boxes represent final products, and abbreviations may be found in the text and Appendix A.
Figure 2.
Figure 2.
A total of 21 validation watersheds were selected from across the CONUS to capture the breadth and extent of land use (top, NLCD, 2019) and climate and physiographic regions (bottom) within the CONUS according to the Köppen–Geiger classification (Beck et al., 2018; also summarized in Table B2). The hydrologic unit code (HUC) classifications are sourced from the USGS Watershed Boundary Dataset (2022a).
Figure 3.
Figure 3.
The robust performance of GFPlain90 relative to the benchmark floodplain data from Woznicki et al. (2019) is evident in the two rows, with the top panels (HUC_0304) showing different spatial extents of a coastal watershed spanning North and South Carolina, United States, and the bottom two panels showing different spatial extents of a Midwestern US watershed (HUC_1024). The main stem of the river network appeared wider in the GFPlain90 data in both examples, especially in the lower reaches, though the complete network was represented well (i.e., floodplains were identified to the furthest extent of the stream network’s headwaters). Satellite imagery is sourced from ESRI (2022).
Figure 4.
Figure 4.
Demonstration of the relative accuracy of the Global NFW dataset in identifying non-floodplain wetlands using a Prairie Pothole Region watershed (HUC_1016; see Fig. 2) replete with abundant non-floodplain wetlands. Correctly identified wetlands occur in both wetland sources (magenta color). Omission errors (NLCD non-floodplain wetlands, smaller systems in yellow) and commission errors (Global NFW dataset, green) are evident as a result of the higher resolution of the NLCD validation dataset. Satellite imagery sourced from ESRI (2022). Note the scale increasing from the left panel to the right panel (i.e., the orange box in the first panel is shown in the second panel at a higher resolution, and the box in the second panel is shown in the last panel at an even higher resolution).
Figure 5.
Figure 5.
Floodplain extents derived from GFPlain90 as a proportion of each of the Level 4 HydroBASINS (Lehrner and Grill, 2013). The data range demonstrated that up to ~90% of a given watershed was comprised of floodplain area, as evidenced by HydroBASINS in south central Africa and central South America. The basemap layer is from the ESRI World Terrain Base (2022).
Figure 6.
Figure 6.
Non-floodplain wetlands, global NFWs, are found worldwide, with a greater abundance in formerly glaciated landscapes of northern climates (e.g., northern North America and Siberian Russia) as well as within the Amazon basin (South America). This density map was created using the Focal Statistics tool in ArcGIS Pro 2.9.1. The basemap layer is from the ESRI World Terrain Base (2022).
Figure 7.
Figure 7.
The proportion of non-floodplain wetlands, global NFWs, within a given HydroBASINS watershed (Lehner and Grill, 2013), ranging up to 100%, varied globally. The impacts or effects of non-floodplain wetlands on biological, biogeochemical, and hydrological functions will vary based on their relative abundance, location within the watershed, and hydrologic characteristics (Lane et al., 2018). The basemap layer is from the ESRI World Terrain Base (2022).
Figure 8.
Figure 8.
Non-floodplain wetlands attenuate storm flows and decrease flooding hazards. In this example from Golden et al. (2021, used by permission under Creative Commons Attribution 4.0 License), incorporating the floodwater storage and attenuation functions of non-floodplain wetlands (NFWs, here) resulted in substantive decreases in flood-stage heights (i.e., modeled stream outcomes incorporating non-floodplain wetlands reached neither 50-year nor 100-year flood extents). The data from Golden et al. (2021) are from USGS Pipestem Creek gage 06469400, draining approximately 1800 km2.

References

    1. Adame MF, Arthington AH, Waltham N, Hasan S, Selles A, and Ronan M: Managing threats and restoring wetlands within catchments of the Great Barrier Reef, Australia, Aquat. Conserv., 29, 829–839, 10.1002/aqc.3096, 2019. - DOI
    1. Alfieri L, Salamon P, Bianchi A, Neal J, Bates P, and Feyen L: Advances in pan-European flood hazard mapping, Hydrol. Process., 28, 4067–4077, 10.1002/hyp.9947, 2014. - DOI
    1. Ameli AA and Creed IF: Does Wetland Location Matter When Managing Wetlands for Watershed-Scale Flood and Drought Resilience?, J. Ame. Water Resour. Assoc., 55, 529–542, 10.1111/1752-1688.12737, 2019. - DOI
    1. Aronica G, Bates PD, and Horritt MS: Assessing the uncertainty in distributed model predictions using observed binary pattern information within GLUE, Hydrol. Process., 16, 2001–2016, 10.1002/hyp.398, 2002. - DOI
    1. Badiou P, Page B, and Akinremi W: Phosphorus Retention in Intact and Drained Prairie Wetland Basins: Implications for Nutrient Export, J. Environ. Qual, 47, 902–913, 10.2134/jeq2017.08.0336, 2018. - DOI - PubMed

LinkOut - more resources