

Analysis of global routine immunisation coverage shows disruption and stagnation during the first two-years of the COVID-19 pandemic with tentative recovery in 2022
- PMID: 37841654
- PMCID: PMC10568411
- DOI: 10.1016/j.jvacx.2023.100383
Analysis of global routine immunisation coverage shows disruption and stagnation during the first two-years of the COVID-19 pandemic with tentative recovery in 2022
Abstract
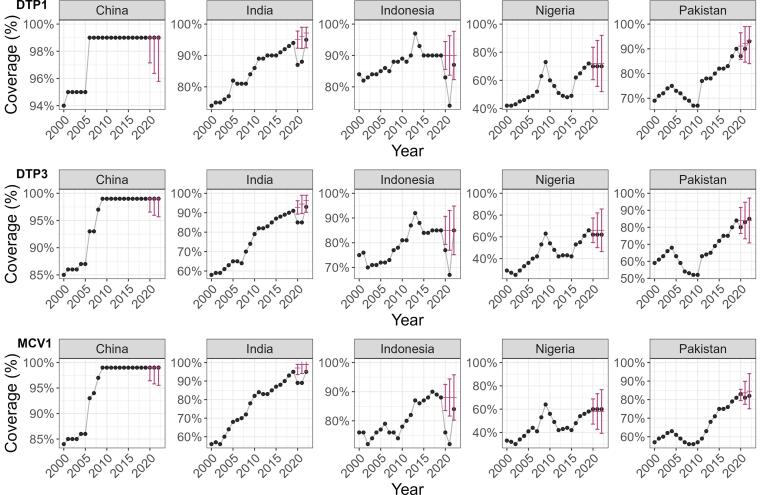
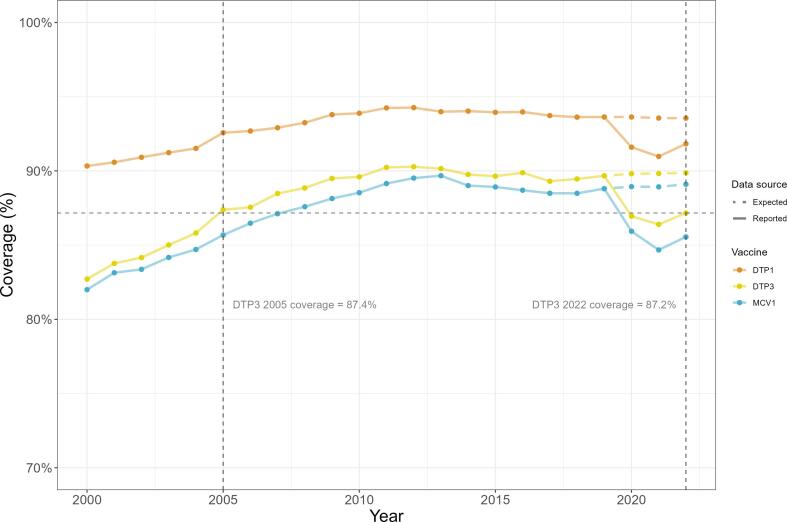
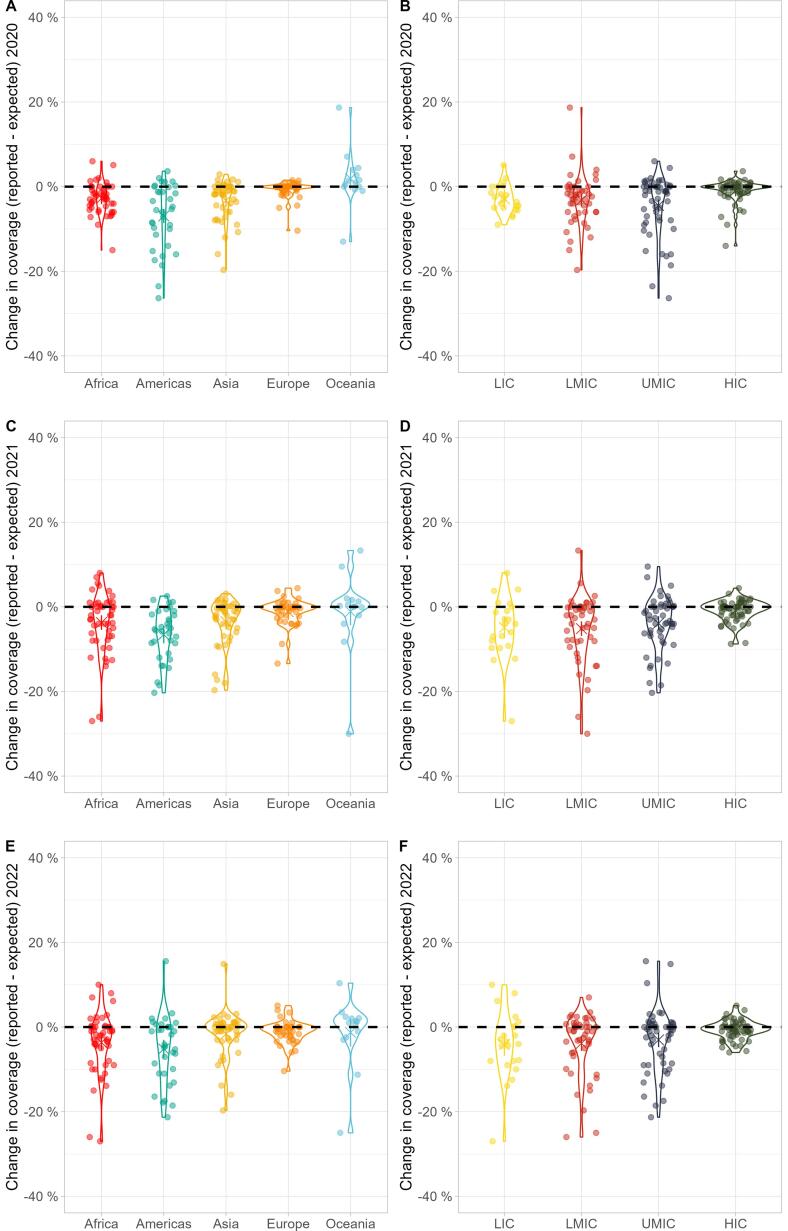
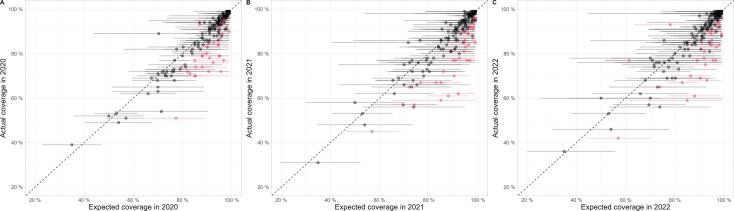
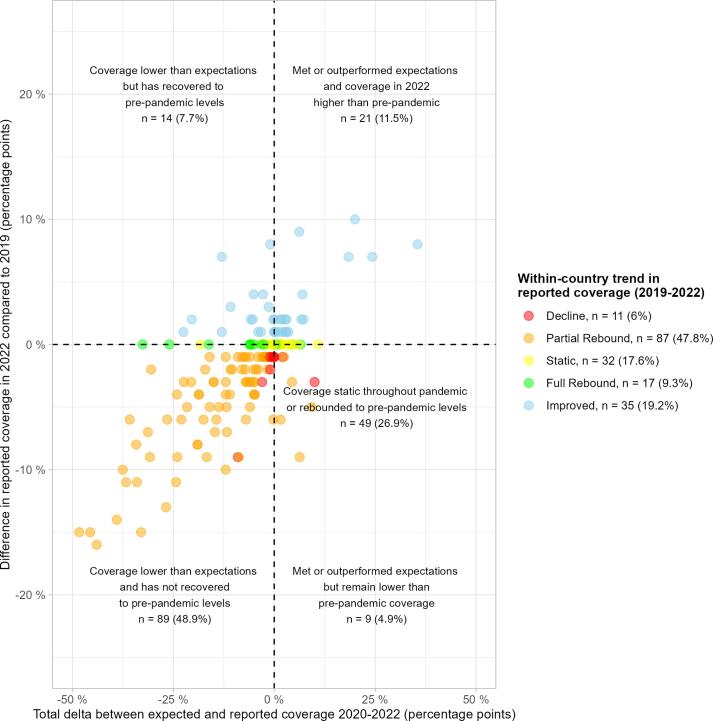
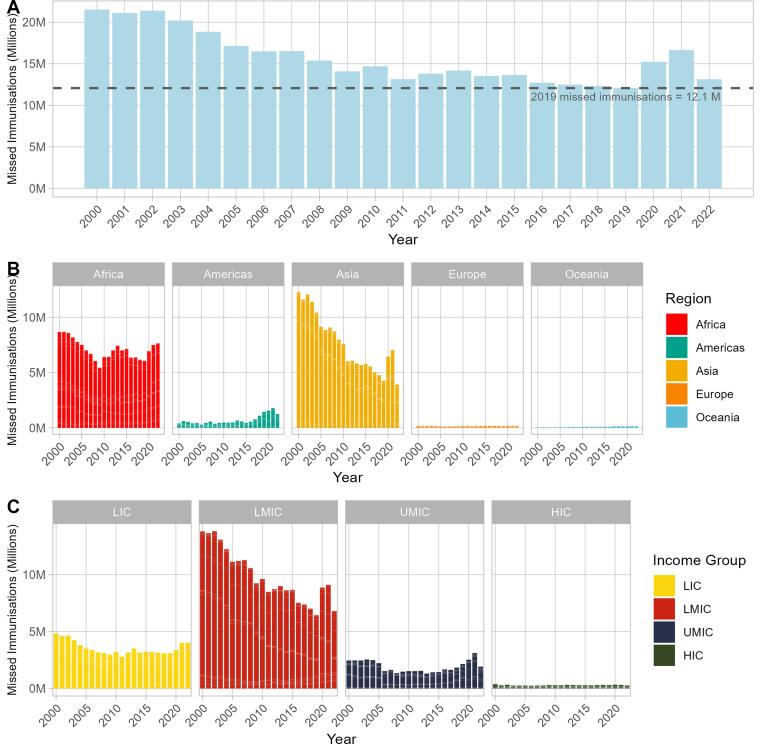
Whilst it is now widely recognised that routine immunisation (RI) was disrupted by the COVID-19 pandemic in 2020, and further so in 2021, the extent of continued interruptions in 2022 and/or rebounds to previous trends remains unclear. We modelled country-specific RI trends using validated estimates of national coverage from the World Health Organisation and United Nation Children's Fund for 182 countries (accounting for > 97% of children globally), to project expected diphtheria, tetanus, and pertussis-containing vaccine first-dose (DTP1), third-dose (DTP3) and measles-containing vaccine first-dose (MCV1) coverage for 2020-2022 based on pre-pandemic trends (from 2000 to 2019). We provide further evidence of peak pandemic immunisation disruption in 2021, followed by tentative recovery in 2022. We report a 3.4% (95 %CI: [2.5%; 4.4%]) decline in global DTP3 coverage in 2021 compared to 2000-2019 trends, from an expected 89.8% to reported 86.4%. This coverage gap reduced to a 2.7% (95 %CI: [1.8%; 3.6%]) decline in 2022, with reported coverage rising to 87.2%. Similar results were seen for DTP1 and MCV1. Whilst partial rebounds are encouraging, global coverage decline translates to a 17-year setback in RI to 2005 levels, and the majority of countries retain coverage at or lower than pre-pandemic levels. The Americas, Africa, and Asia were the most impacted regions; and low- and middle-income countries the most affected income groups. The number of annual Zero Dose (ZD) children - indicating those receiving no immunisations - increased from 12.1 million (M) globally in 2019 to a peak of 16.7 M in 2021, then reduced to 13.1 M in 2022. Overall, we estimate an excess of 8.8 M ZD children cumulatively in 2020-2022 compared to pre-pandemic levels. This work can be used as an objective baseline to inform future interventions to prioritise and target interventions, and facilitate catch-up of growing populations of under- and un-immunised children.
Keywords: COVID-19; Coverage; Decline; Global; Global health; Immunisation; Modelling; Pandemic; Recovery; Routine immunisation; Time series; Vaccine.
© 2023 The Authors.
Conflict of interest statement
The authors declare the following financial interests/personal relationships which may be considered as potential competing interests: It is noted that BE has been employed by the Clinton Health Access Initiative in the Global Vaccines team in the last three years; and is currently employed by Gavi, the Vaccine Alliance. All research contained in this manuscript was conducted during a doctorate qualification, outside and independent of employment. Neither facilities, data, nor any other forms of input from the Clinton Health Access Initiative or Gavi, were used in this study. The research and manuscript are independent of the Clinton Health Access Initiative and Gavi, and the findings have not been discussed, reviewed, or endorsed by the Clinton Health Access Initiative, the Gavi Secretariat, or any Alliance members.
Figures
Similar articles
-
Estimating global and regional disruptions to routine childhood vaccine coverage during the COVID-19 pandemic in 2020: a modelling study.Lancet. 2021 Aug 7;398(10299):522-534. doi: 10.1016/S0140-6736(21)01337-4. Epub 2021 Jul 17. Lancet. 2021. PMID: 34273292 Free PMC article.
-
Worldwide routine immunisation coverage regressed during the first year of the COVID-19 pandemic.Vaccine. 2022 Jun 9;40(26):3531-3535. doi: 10.1016/j.vaccine.2022.01.044. Epub 2022 Jan 26. Vaccine. 2022. PMID: 35177301 Free PMC article.
-
Impact of the SARS-CoV-2 pandemic on routine immunisation services: evidence of disruption and recovery from 170 countries and territories.Lancet Glob Health. 2022 Feb;10(2):e186-e194. doi: 10.1016/S2214-109X(21)00512-X. Epub 2021 Dec 21. Lancet Glob Health. 2022. PMID: 34951973 Free PMC article.
-
The impact of COVID-19 and catch-up strategies on routine childhood vaccine coverage trends in Latin America: A systematic literature review and database analysis.Hum Vaccin Immunother. 2022 Nov 30;18(6):2102353. doi: 10.1080/21645515.2022.2102353. Epub 2022 Sep 9. Hum Vaccin Immunother. 2022. PMID: 36084255 Free PMC article.
-
Impact that the COVID-19 pandemic on routine childhood vaccinations and challenges ahead: A narrative review.Acta Paediatr. 2021 Sep;110(9):2529-2535. doi: 10.1111/apa.15949. Epub 2021 Jun 2. Acta Paediatr. 2021. PMID: 34028088 Free PMC article. Review.
Cited by
-
Socio-demographic disparities in basic under-two immunization coverage: insights from the 2016 Malawi demographic and health survey.BMC Public Health. 2025 Mar 5;25(1):882. doi: 10.1186/s12889-025-22143-2. BMC Public Health. 2025. PMID: 40045276 Free PMC article.
-
Integrating routine immunization into COVID-19 vaccination improve coverage but could create equity issues: evidence from Niger State, Nigeria.BMC Public Health. 2025 Apr 22;25(1):1490. doi: 10.1186/s12889-025-22796-z. BMC Public Health. 2025. PMID: 40264059 Free PMC article.
-
Reflections on 50 years of immunisation programmes in the WHO African region: an impetus to build on the progress and address the unfinished immunisation business.BMJ Glob Health. 2025 May 21;10(5):e017982. doi: 10.1136/bmjgh-2024-017982. BMJ Glob Health. 2025. PMID: 40398892 Free PMC article.
-
The impact of the COVID-19 pandemic on vaccinations in United States primary care practices.PLoS One. 2025 Jun 10;20(6):e0325934. doi: 10.1371/journal.pone.0325934. eCollection 2025. PLoS One. 2025. PMID: 40493658 Free PMC article.
-
Has COVID-19 Affected DTP3 Vaccination in the Americas?Vaccines (Basel). 2024 Feb 25;12(3):238. doi: 10.3390/vaccines12030238. Vaccines (Basel). 2024. PMID: 38543872 Free PMC article.
References
-
- Vaccines and immunization n.d. https://www.who.int/health-topics/vaccines-and-immunization#tab=tab_1 (accessed August 7, 2023).
-
- Dinleyici EC, Borrow R, Safadi MAP, van Damme P, Munoz FM. Vaccines and routine immunization strategies during the COVID-19 pandemic. Https://DoiOrg/101080/2164551520201804776 2020;17:400–7. https://doi.org/10.1080/21645515.2020.1804776. - PMC - PubMed
-
- Basu S, Ashok G, Debroy R, Ramaiah S, Livingstone P, Anbarasu A. Impact of the COVID-19 pandemic on routine vaccine landscape: A global perspective. Hum Vaccin Immunother 2023;19. https://doi.org/10.1080/21645515.2023.2199656. - PMC - PubMed
LinkOut - more resources
Full Text Sources
Miscellaneous
