

Collagen type I-based recombinant peptide promotes bone regeneration in rat critical-size calvarial defects by enhancing osteoclast activity at late stages of healing
- PMID: 37841660
- PMCID: PMC10570703
- DOI: 10.1016/j.reth.2023.09.013
Collagen type I-based recombinant peptide promotes bone regeneration in rat critical-size calvarial defects by enhancing osteoclast activity at late stages of healing
Abstract
Introduction: We recently demonstrated the bone-forming potential of medium-cross-linked recombinant collagen peptide (mRCP) in animal models of bone defects. However, these studies were limited to a 4-week observation period; therefore, in the present study, we aimed to further evaluate mRCP as a suitable bone graft material for the alveolar cleft by analyzing its bone-forming potential, osteogenic-inducing ability, and biodegradation over an extended period of 12 weeks, using a rat critical-size calvarial defect model.
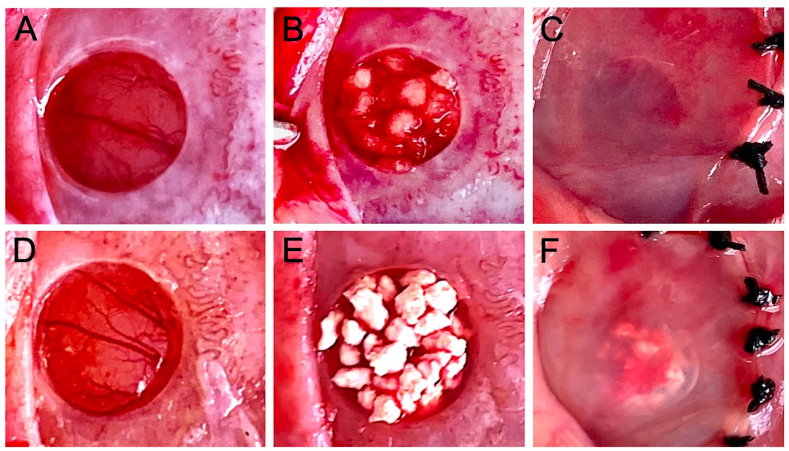
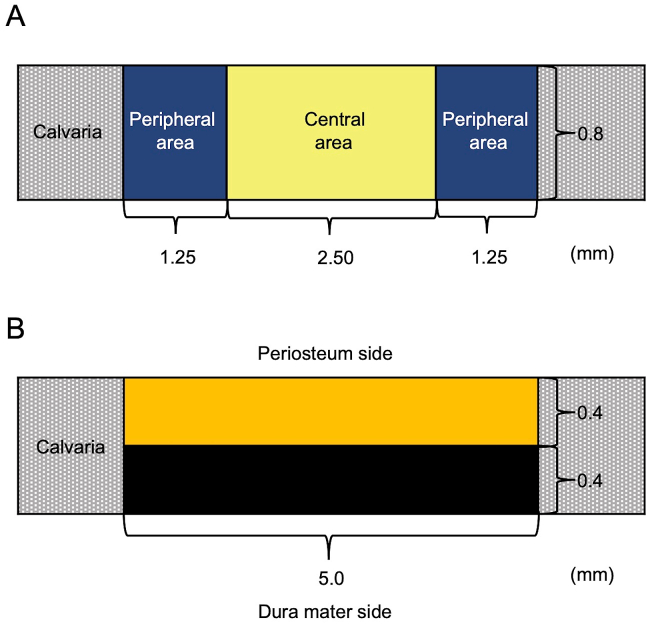
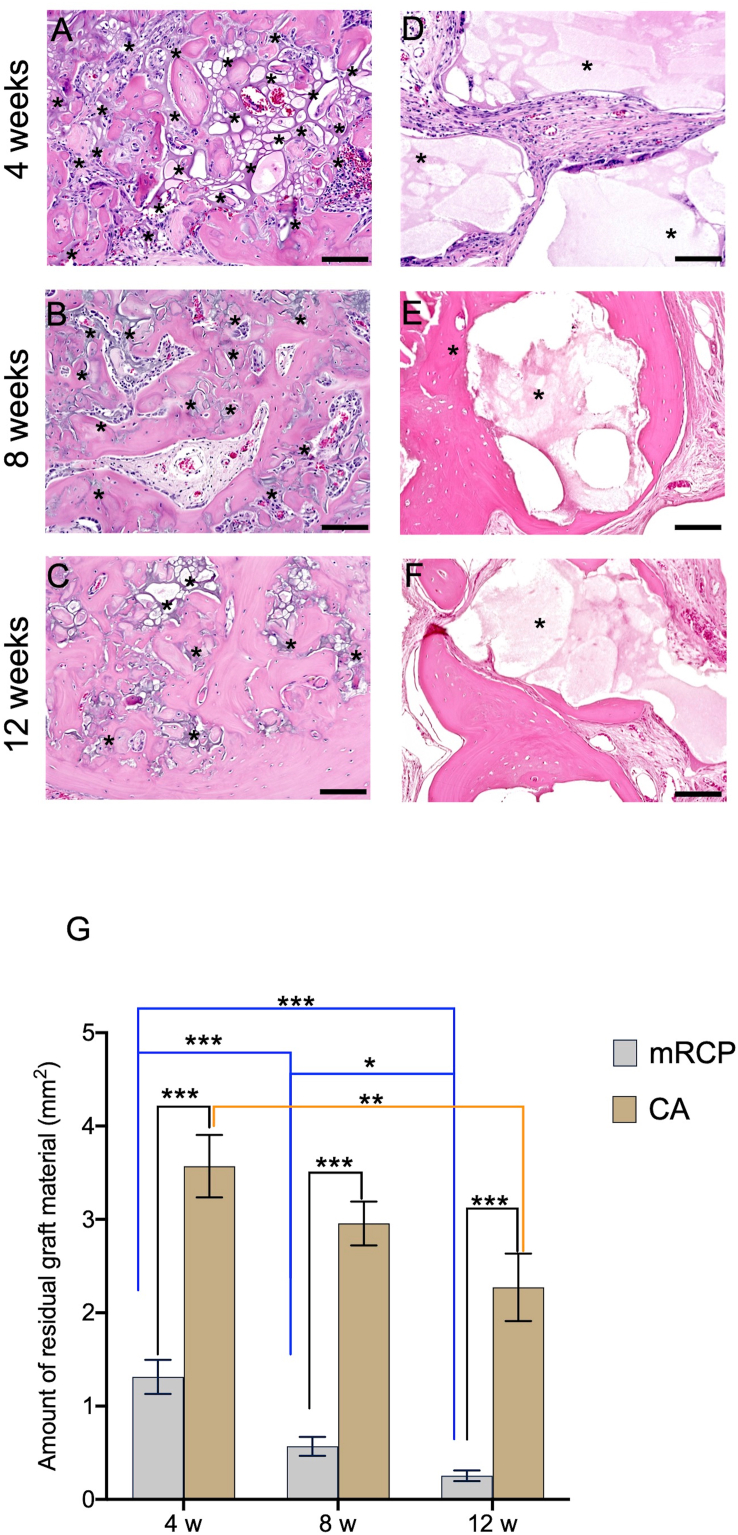
Methods: Using Sprague-Dawley rats, we created critical-size calvarial defects through a surgical procedure. The defects were then filled with 3 mg of mRCP (mRCP group) or 18 mg of Cytrans® (CA) granules, which has a carbonate apatite-based composition resembling natural bone, was used as a reference material (CA group). For negative control, the defects were left untreated. Bone volume, total bone volume (bone volume including CA granules), and bone mineral density (BMD) in the defect were assessed using micro-computed tomography (μ-CT) at 0, 4, 8, and 12 weeks after implantation. Using histomorphometric analyses of hematoxylin and eosin (H&E)-stained sections, we measured the amount of newly formed bone and total newly formed bone (new bone including CA granules) in the entire defect site, as well as the amount of newly formed bone in the central side, two peripheral sides (left and right), periosteal (top) side, and dura mater (bottom) side. In addition, we measured the amount of residual bone graft material in the defect. Osteoclasts and osteoblasts in the newly formed bone were detected using tartrate-resistant acid phosphatase (TRAP) and alkaline phosphatase (ALP) staining, respectively.
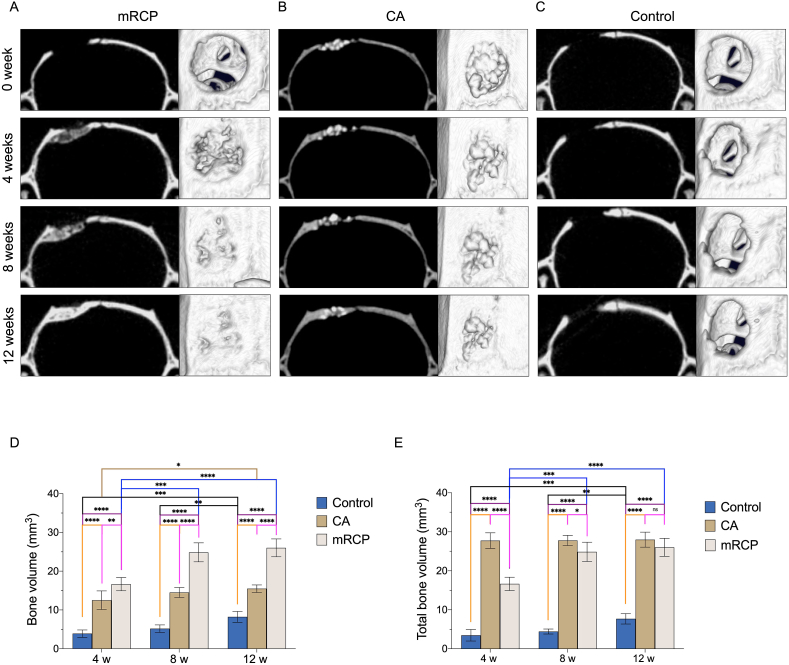
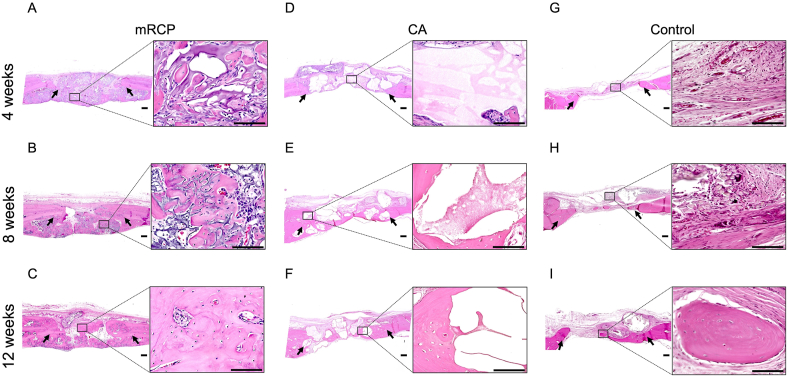
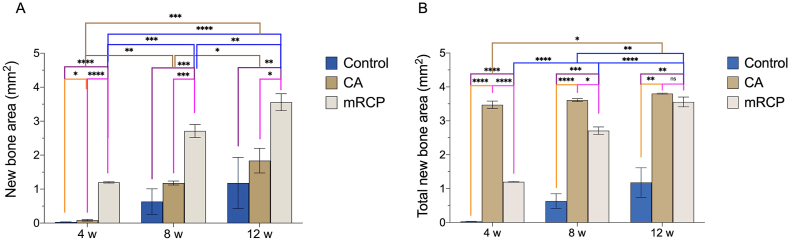
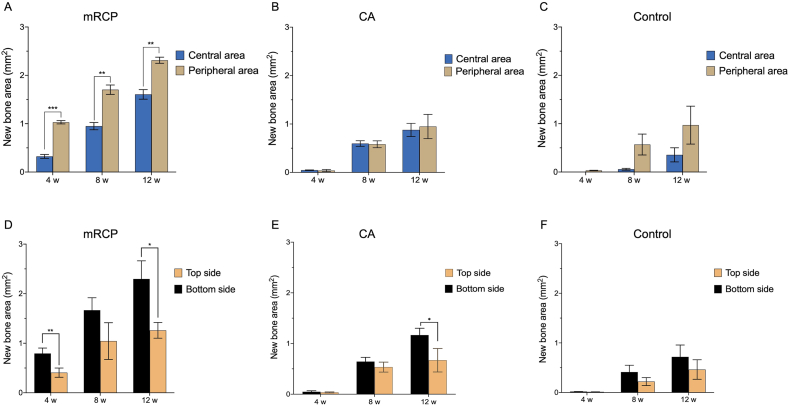
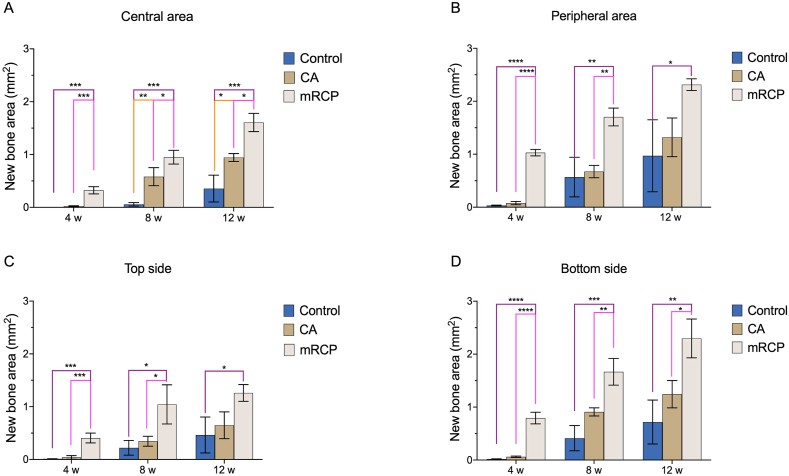
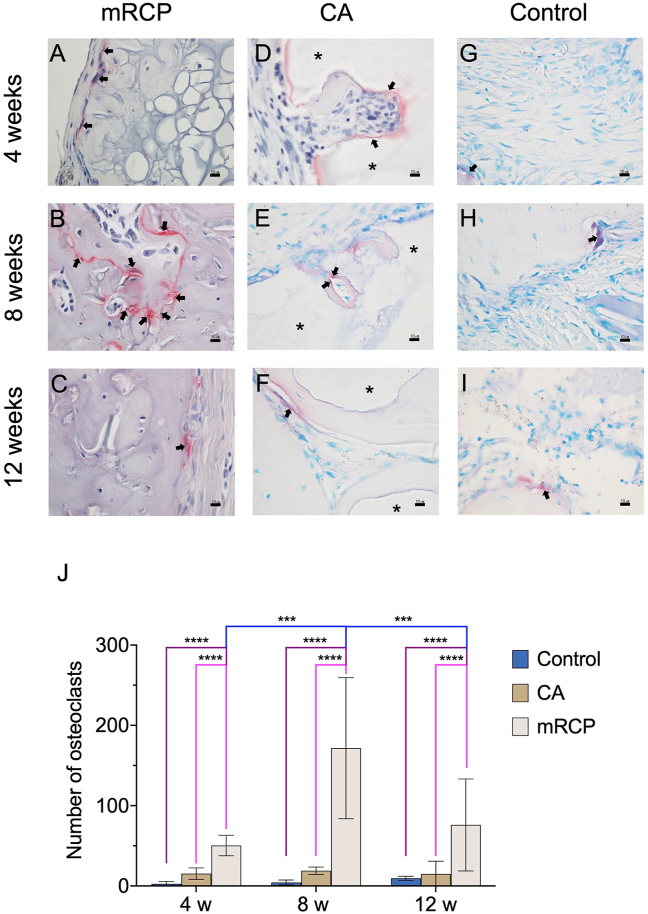
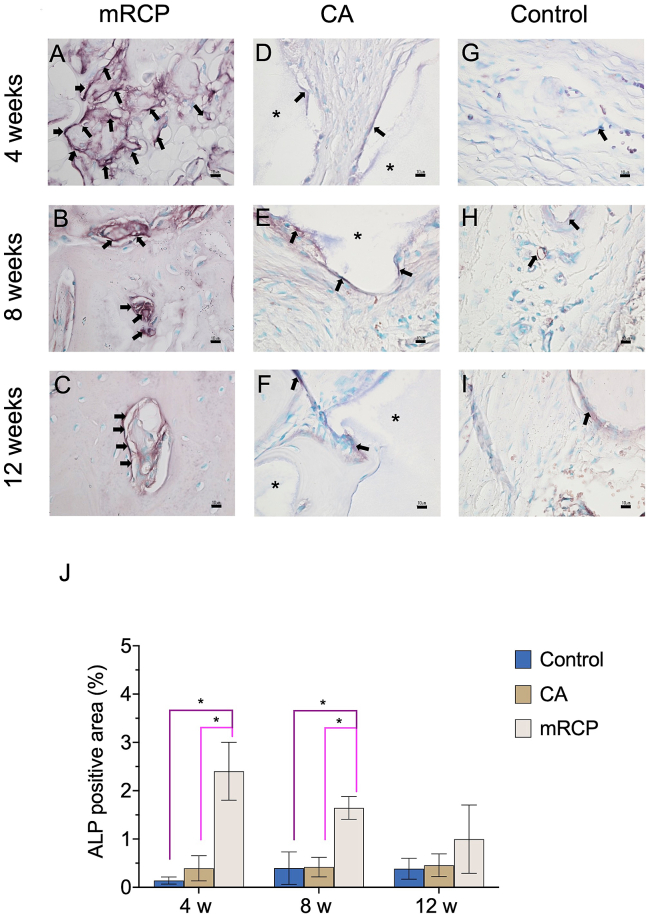
Results: Bone volume in the mRCP group increased over time and was significantly larger at 8 and 12 weeks after surgery than at 4 weeks. The bone volume in the mRCP group was greater than that of the CA and control groups at 4, 8, and 12 weeks after implantation, and while the total bone volume was greater in the CA group after 4 and 8 weeks, the mRCP group had comparable levels of total bone volume to that of the CA group at 12 weeks after implantation. The BMD of the mRCP group reached similar levels to native calvaria bone at the same time point. H&E-stained sections revealed a larger amount of newly formed bone 12 weeks after implantation in the mRCP group compared to that of the CA and control groups. The total newly formed bone at 12 weeks after implantation was on par with that in the CA group. Furthermore, at the defect site, the area of newly formed bone was larger on the peripheral and dura mater sides. Notably, the number of osteoclasts in the mRCP group was higher than in the CA and control groups and peaked 8 weeks after implantation, which coincided with the timing of the greatest resorption of mRCP. Although the ALP-positive area was greater in the mRCP group compared to other groups, we did not detect any significant changes in the number of osteoblasts over time.
Conclusion: This study demonstrated the bone-forming potential of mRCP over an extended period of 12 weeks, suggesting that mRCP sufficiently resists resorption to promote bone formation through induction of osteoclast activation in the late stages of the healing period.
Keywords: Bone graft material; Bone regeneration; Calvaria; Osteoblast; Osteoclast; Recombinant human collagen peptide.
© 2023 The Japanese Society for Regenerative Medicine. Production and hosting by Elsevier B.V.
Conflict of interest statement
This work was supported by the joint research expenses with FUJIFILM Corporation. Taku Wakita and Takahiro Hiratsuka are employees of FUJIFILM Corporation.
Figures
Similar articles
-
Appropriate pore size for bone formation potential of porous collagen type I-based recombinant peptide.Regen Ther. 2022 Aug 29;21:294-306. doi: 10.1016/j.reth.2022.08.001. eCollection 2022 Dec. Regen Ther. 2022. PMID: 36110974 Free PMC article.
-
Bone formation potential of collagen type I-based recombinant peptide particles in rat calvaria defects.Regen Ther. 2020 Dec 24;16:12-22. doi: 10.1016/j.reth.2020.12.001. eCollection 2021 Mar. Regen Ther. 2020. PMID: 33426238 Free PMC article.
-
Octacalcium Phosphate/Gelatin Composite (OCP/Gel) Enhances Bone Repair in a Critical-sized Transcortical Femoral Defect Rat Model.Clin Orthop Relat Res. 2022 Oct 1;480(10):2043-2055. doi: 10.1097/CORR.0000000000002257. Epub 2022 May 30. Clin Orthop Relat Res. 2022. PMID: 35638896 Free PMC article.
-
Octacalcium phosphate collagen composite stimulates the expression and activity of osteogenic factors to promote bone regeneration.J Tissue Eng Regen Med. 2020 Jan;14(1):99-107. doi: 10.1002/term.2969. Epub 2019 Nov 12. J Tissue Eng Regen Med. 2020. PMID: 31721475 Free PMC article.
-
Construction of biomimetic cell-sheet-engineered periosteum with a double cell sheet to repair calvarial defects of rats.J Orthop Translat. 2022 Oct 14;38:1-11. doi: 10.1016/j.jot.2022.09.005. eCollection 2023 Jan. J Orthop Translat. 2022. PMID: 36313975 Free PMC article.
Cited by
-
Comparative evaluation of multi-fold rib and structural iliac bone grafts in single-segment thoracic and thoracolumbar spinal tuberculosis: clinical and radiological outcomes.J Orthop Surg Res. 2023 Dec 1;18(1):917. doi: 10.1186/s13018-023-04416-x. J Orthop Surg Res. 2023. PMID: 38041140 Free PMC article.
-
Biomaterial Cues for Regulation of Osteoclast Differentiation and Function in Bone Regeneration.Adv Ther (Weinh). 2025 Jan;8(1):2400296. doi: 10.1002/adtp.202400296. Epub 2024 Nov 15. Adv Ther (Weinh). 2025. PMID: 39867107
References
LinkOut - more resources
Full Text Sources
Research Materials
