

A rapid workflow for neuron counting in combined light sheet microscopy and magnetic resonance histology
- PMID: 37841684
- PMCID: PMC10569694
- DOI: 10.3389/fnins.2023.1223226
A rapid workflow for neuron counting in combined light sheet microscopy and magnetic resonance histology
Abstract
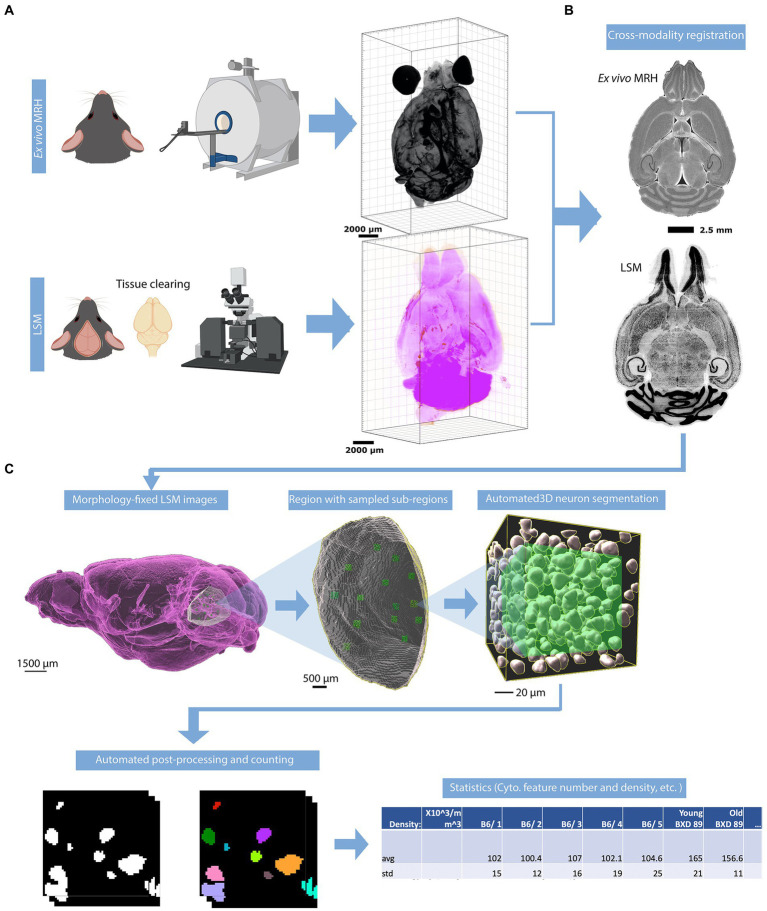
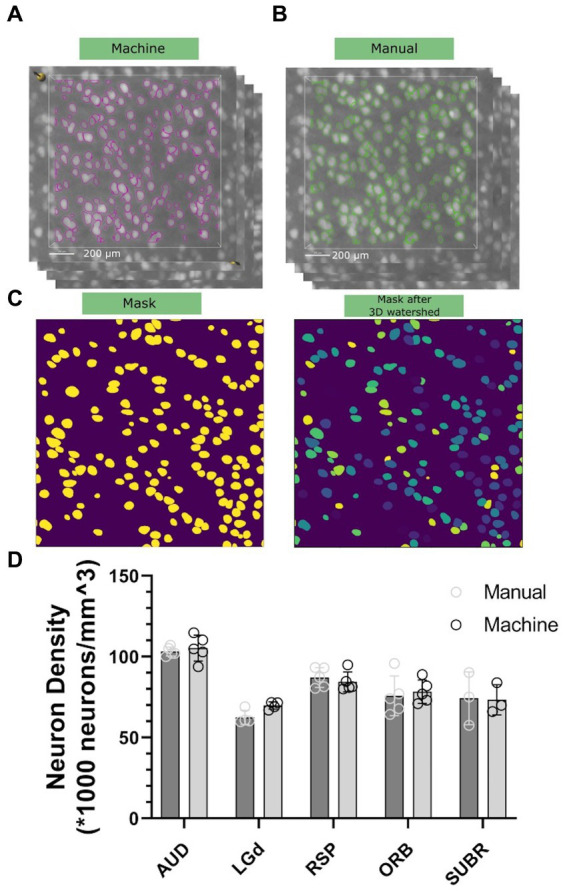
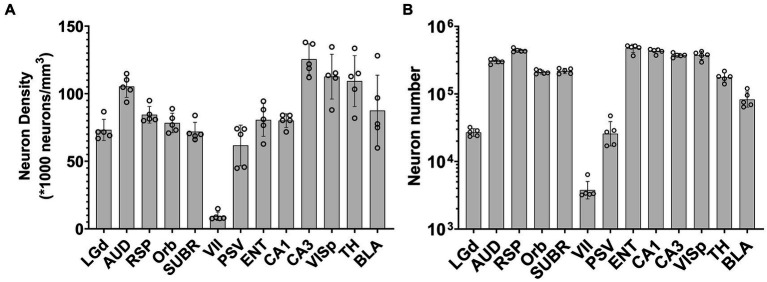
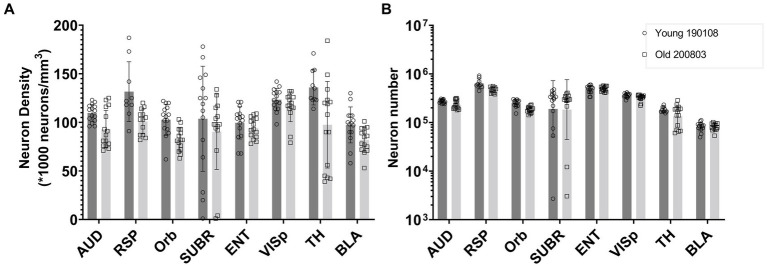
Information on regional variation in cell numbers and densities in the CNS provides critical insight into structure, function, and the progression of CNS diseases. However, variability can be real or a consequence of methods that do not account for technical biases, including morphologic deformations, errors in the application of cell type labels and boundaries of regions, errors of counting rules and sampling sites. We address these issues in a mouse model by introducing a workflow that consists of the following steps: 1. Magnetic resonance histology (MRH) to establish the size, shape, and regional morphology of the mouse brain in situ. 2. Light-sheet microscopy (LSM) to selectively label neurons or other cells in the entire brain without sectioning artifacts. 3. Register LSM volumes to MRH volumes to correct for dissection errors and both global and regional deformations. 4. Implement stereological protocols for automated sampling and counting of cells in 3D LSM volumes. This workflow can analyze the cell densities of one brain region in less than 1 min and is highly replicable in cortical and subcortical gray matter regions and structures throughout the brain. This method demonstrates the advantage of not requiring an extensive amount of training data, achieving a F1 score of approximately 0.9 with just 20 training nuclei. We report deformation-corrected neuron (NeuN) counts and neuronal density in 13 representative regions in 5 C57BL/6J cases and 2 BXD strains. The data represent the variability among specimens for the same brain region and across regions within the specimen. Neuronal densities estimated with our workflow are within the range of values in previous classical stereological studies. We demonstrate the application of our workflow to a mouse model of aging. This workflow improves the accuracy of neuron counting and the assessment of neuronal density on a region-by-region basis, with broad applications for studies of how genetics, environment, and development across the lifespan impact cell numbers in the CNS.
Keywords: light sheet microscopy; mouse brain; neurologic image analysis; neuron counting method; neuron density.
Copyright © 2023 Tian, Johnson, Williams and White.
Conflict of interest statement
The authors declare that the research was conducted in the absence of any commercial or financial relationships that could be construed as a potential conflict of interest.
Figures
Update of
-
A rapid workflow for neuron counting in combined light sheet microscopy and magnetic resonance histology.bioRxiv [Preprint]. 2023 May 17:2023.05.17.540884. doi: 10.1101/2023.05.17.540884. bioRxiv. 2023. Update in: Front Neurosci. 2023 Sep 27;17:1223226. doi: 10.3389/fnins.2023.1223226. PMID: 37292796 Free PMC article. Updated. Preprint.
Similar articles
-
A rapid workflow for neuron counting in combined light sheet microscopy and magnetic resonance histology.bioRxiv [Preprint]. 2023 May 17:2023.05.17.540884. doi: 10.1101/2023.05.17.540884. bioRxiv. 2023. Update in: Front Neurosci. 2023 Sep 27;17:1223226. doi: 10.3389/fnins.2023.1223226. PMID: 37292796 Free PMC article. Updated. Preprint.
-
Restoring morphology of light sheet microscopy data based on magnetic resonance histology.Front Neurosci. 2023 Jan 4;16:1011895. doi: 10.3389/fnins.2022.1011895. eCollection 2022. Front Neurosci. 2023. PMID: 36685227 Free PMC article.
-
Quantification of neuronal density across cortical depth using automated 3D analysis of confocal image stacks.Brain Struct Funct. 2017 Sep;222(7):3333-3353. doi: 10.1007/s00429-017-1382-6. Epub 2017 Feb 27. Brain Struct Funct. 2017. PMID: 28243763 Free PMC article.
-
Variability in neuron densities across the cortical sheet in primates.Brain Behav Evol. 2011;78(1):37-50. doi: 10.1159/000327319. Epub 2011 Jun 17. Brain Behav Evol. 2011. PMID: 21691046 Review.
-
Stereological quantitation of human brains from normal and schizophrenic individuals.Acta Neurol Scand Suppl. 1992;137:20-33. doi: 10.1111/j.1600-0404.1992.tb05034.x. Acta Neurol Scand Suppl. 1992. PMID: 1414258 Review.
Cited by
-
An Agent-Based Model to Reproduce the Boolean Logic Behaviour of Neuronal Self-Organised Communities through Pulse Delay Modulation and Generation of Logic Gates.Biomimetics (Basel). 2024 Feb 9;9(2):101. doi: 10.3390/biomimetics9020101. Biomimetics (Basel). 2024. PMID: 38392147 Free PMC article.
-
The Duke Mouse Brain Atlas: MRI and light sheet microscopy stereotaxic atlas of the mouse brain.Sci Adv. 2025 May 2;11(18):eadq8089. doi: 10.1126/sciadv.adq8089. Epub 2025 Apr 30. Sci Adv. 2025. PMID: 40305623 Free PMC article.
References
-
- Arzt M., Jr D., Schmied C., Pietzsch T., Schmidt D., Tomancak P., et al. . (2022). LABKIT: labeling and segmentation toolkit for big image data. Front. Comput. Sci 4:4. doi: 10.3389/fcomp.2022.777728 - DOI
LinkOut - more resources
Full Text Sources