[Preprint]. 2023 Sep 25:rs.3.rs-3307809.
doi: 10.21203/rs.3.rs-3307809/v1.

Vaccine-induced antigen archiving enhances local memory CD8+ T cell responses following an unrelated viral infection

Affiliations

Vaccine-induced antigen archiving enhances local memory CD8+ T cell responses following an unrelated viral infection

Beth Tamburini et al. Res Sq. .

Update in

Abstract

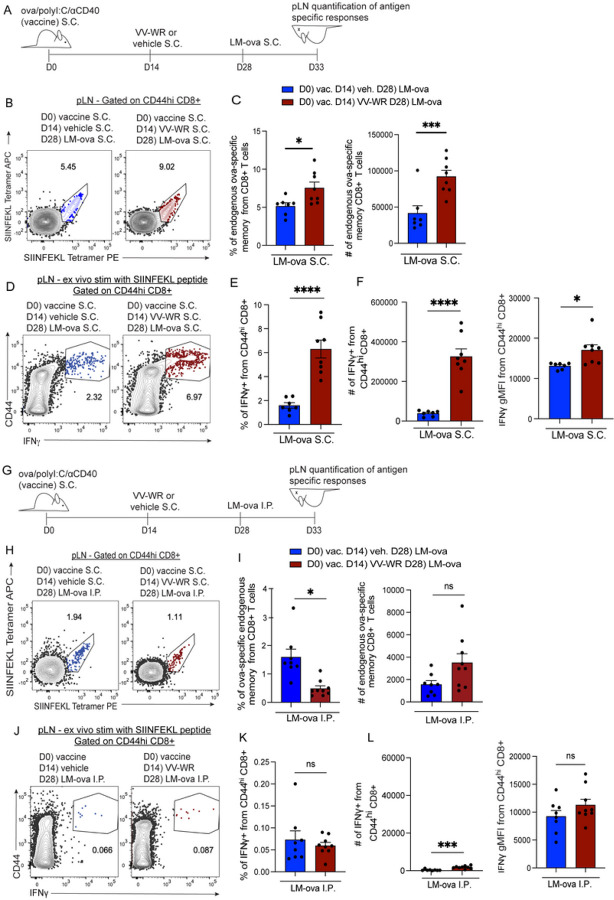
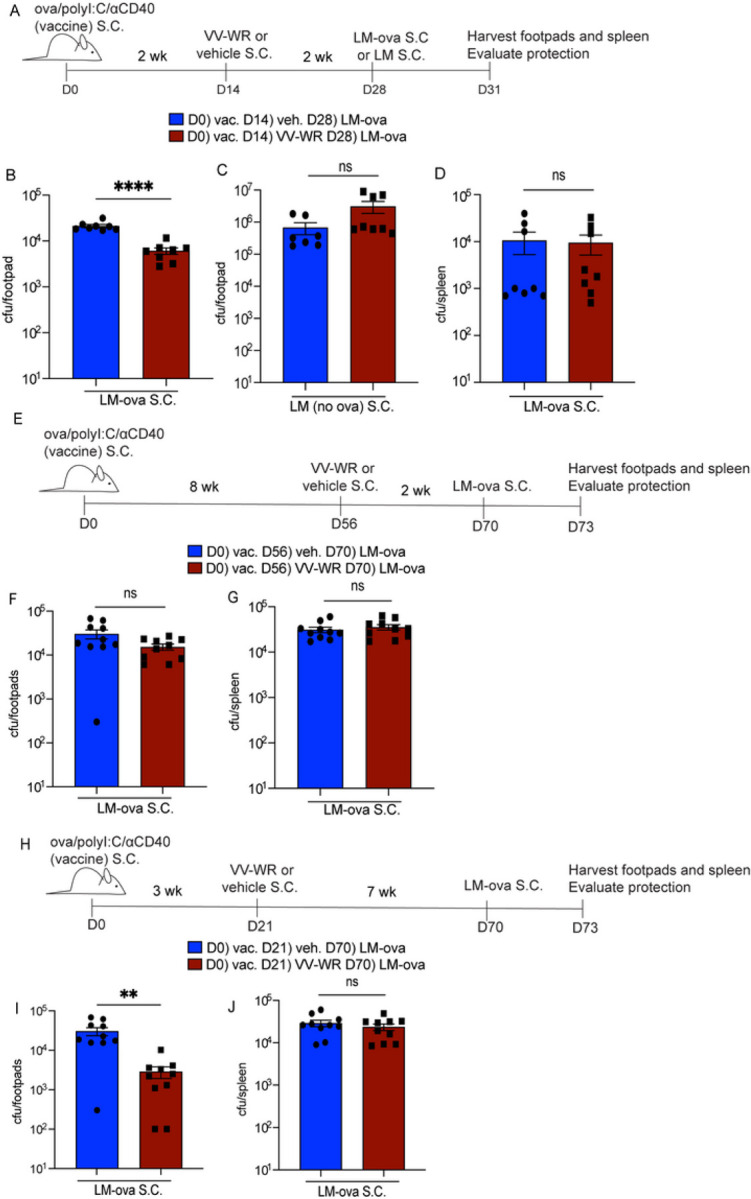
Viral and vaccine antigens persist or are archived in lymph node stromal cells (LNSC) such as lymphatic endothelial cells (LEC) and fibroblastic reticular cells (FRC). Here, we find that, during the time frame of antigen archiving, LEC apoptosis caused by a second, but unrelated, innate immune stimulus such as vaccina viral infection or CpG DNA administration boosted memory CD8+ T cells specific to the archived antigen. In contrast to "bystander" activation associated with unrelated infections, the memory CD8+ T cells specific to the vaccine archived antigen were significantly higher than memory CD8+ T cells of a different antigen specificity. Finally, the boosted memory CD8+ T cells resulted in increased protection against Listeria monocytogenes expressing the vaccine antigen, but only for the duration that the vaccine antigen was archived. These findings outline a novel mechanism by which LNSC archived antigens, in addition to bystander activation, can augment memory CD8+ T cell responses during repeated inflammatory insults.

Keywords: CD8 T cell; antigen archiving; bystander activation; lymph node; lymph node stromal cell; protection.


Conflict of interest statement

CONFLICT OF INTEREST We declare no competing interest.

Figures

Figure 1
Figure 1. Lymphatic endothelial cells archive antigens following vaccination.
(A) Experimental schematic for B-E. C57/BI6 mice were vaccinated subcutaneously in the footpad and/or flank with the indicated antigens and adjuvants. (B) Cells were stained with CD45, PDPN, CD31 and PD-L1. Gating strategies for lymph node stromal cells (LNSC). Cells were gated on CD45-PDPN+. To differentiate LEC and FRC cells were gated on CD31. Shown are LEC and FRC antigen-positive cells based on PD-L1 expression (floor, MARCO LEC). Blood endothelial cells (BEC) were gated as CD45-CD31+PDPN- (gating of BEC can be found in supplemental Figure 1). The amount of fluorescent antigen for different LNSC was determined in D and F. (C) Representative flow cytometric plots of ova-AF488+ LEC and FRC in mice 2–3 weeks after immunization with ova conjugated to Alexa-Fluor 488 (AF488) and polyI:C and aCD40 as in A. (D) Quantification of the frequency of LEC, BEC, and FRC that are positive for the indicated antigens in the popliteal LN (pLN). (E) Same as C, except for mice immunized SARS-CoV2-RBD-AF488, polyI:C, and aCD40. (F) Same as in D, except for SARS-CoV2-RBD and CHIKV-E2. CHIKV-E2 was repeated for 9–14 days post-vaccine (~2 weeks). (G) Experimental schematic for H. (H) Mice were immunized with the subunit vaccine containing ova, polyI:C, and aCD40. Two weeks later, mice were infected with vaccinia virus (VV-WR) or vehicle (PBS). Three days pre-harvest, OT1 T cells labeled with VPD or gBT T cells labeled with CFSE were transferred into previously immunized mice. The percentage of transferred OT1 or gBT T cells in each division was quantified for each specific time point for each mouse. Statistical analysis was done using an unpaired t-test where the p-value between naïve and indicated antigen is <0.0001. In each experiment, at least n=2–3 mice per group were evaluated and the experiment was repeated n=2–5 times for C-E and repeated n=2 times for G. Shown is the representative data from one of the experiments.
Figure 2
Figure 2. Endogenous antigen-specific memory CD8+ T cells accumulate following vaccinia infection.
(A) Experimental schematic for B-E. Mice were immunized subcutaneously in the footpad with a subunit vaccine containing ova, polyI:C, and aCD40. Two weeks later, mice were infected with VV-WR or vehicle (PBS). Popliteal LNs (pLN) were harvested at respective time points post-VV-WR infection. Half the cells were used to evaluate endogenous CD8+ T cells and the other half were used for ex vivo stimulation with SIINFEKL peptide. (B) Representative flow cytometric plots of endogenous ova-specific H2-Kb SIINFEKL tetramer+ CD8+ T cells were evaluated using SIINFEKL-tetramer PE and SIINFEKL-tetramer APC. Prior to tetramer, cells were gated as B220-/CD8+/CD44hi. Blue represents mice that were injected subcutaneously with vehicle at D14 and red represents mice that were infected with VV-WR at D14. (C) Quantification of frequency and number of ova-specific endogenous memory CD8+ T cells in the draining popliteal LN. (D) Cells at respective time points were stimulated ex vivo with SIINFEKL peptide for 4–6 hrs to evaluate cytokine production. Respective flow cytometric plots show IFNg production of B220-/CD8+/CD44hi cells. (E) Quantification of frequency and number of IFNg -producing B220-CD44hi CD8+T cells from the draining pLN. Statistical analysis was done using an unpaired t-test where the p-value between vaccine + vehicle (blue bar) and vaccine + VV-WR (red bar) is <0.0001. Errors bars are mean ± standard error of the mean. In each experiment, n=3–4 mice per group were evaluated and the experiment was repeated n=3 times. Shown is the representative data from one of the experiments.
Figure 3
Figure 3. Non-archived antigen-specific memory CD8+ T cells are stimulated in the absence of antigen after vaccinia infection to a lesser degree than archived antigen-specific memory CD8+ T cells.
(A) Experimental schematic for B-C. Mice were immunized and infected with VV-WR as in Figure 2. One day prior to VV-WR infection congenically different memory OT1 and memory p14 CD8+ T cells were isolated and transferred intravenously into WT mice. To establish memory, naïve OT1 or p14 cells were transferred into naïve WT mice and immunized with their cognate antigen (ovalbumin or gp33 peptide) and isolated by CD8 negative selection 2–6 weeks later as described in materials and methods. Memory OT1 and memory p14 were also transferred into naïve WT host to calculate fold expansion over OT1/p14 “take”. Popliteal LNs (pLN) were harvested and processed at indicated time points. (B) Representative flow cytometric plots of co-transferred memory p14 and memory OT1 fold expansion transferred at 1:1 ratio. (C) Memory OT1 (CD45.1/1) and p14 (CD45.1/2) were co-transferred into immunized mice (CD45.2/2) 1 day before VV-WR. The fold expansion was calculated as the total number of memory OT1 or memory p14 in antigen-bearing mice over the total number of memory OT1 or memory p14 in the naïve WT host (to accommodate for differences in ratio and “take”) at each respective time point. Statistical analysis was done using a paired t-test where the p-value between memory OT1 and memory p14 is <0.0001. In each experiment, at least n=3 mice per group were evaluated and the experiment was repeated n=2 times. In each case, a different congenic marker was used for transferred cells (e.g. OT1 was CD45.1/1 and p14 was CD45.1/2 and hosts were CD45.2/2 or OT1 was CD45.1/2 and p14 was CD45.1/1 and host was CD45.2/2). Results were similar across congenic marker combinations used. In Figure 3B, representative flow plots from one experiment are shown as an example (in the other experiment, OT1 were CD45.1/2 and p14 were CD45.1/1). Shown in Figure 3C is the combined data from both experiments. A third replicate was not performed as our experiments were adequately powered to provide statistical significance in accordance with our IACUC policies regarding animal experiments with consistent data points.
Figure 4
Figure 4. CD8+ T cells activated during vaccinia infection have increased immunogenicity following re-challenge of previously archived antigen.
(A) Experimental schematic for B-F. Mice were immunized with ova/polyI:C/aCD40 vaccine and infected with VV-WR 2 weeks later. Two weeks after VV-WR, mice were challenged LM-ova subcutaneously (S.C.) Five days post-LM-ova, popliteal LN (pLN) were harvested to assess endogenous archived-antigen (ova)-specific memory CD8+ T cells in the draining pLN. (B) Representative flow plots of mice given LM-ova S.C. Blue represents mice that were injected subcutaneously with vehicle at D14 and red represents mice that were infected with VV-WR at D14. Cells were evaluated using SIINFEKL-tetramer PE and SIINFEKL-tetramer APC. Previous gates were B220-/CD8+/CD44hi (C) Quantification of frequency and the total number of ova-specific endogenous memory CD8+ T cells in the popliteal LN. (D) Representative flow cytometric plots of mice given LM-ova S.C. The cells were stimulated ex vivo with SIINFEKL peptide for 4–6 hrs to evaluate cytokine production. Respective flow cytometric plots show IFNg production of cells gated previously on B220-/CD8+/CD44hi. (E) Quantification of frequency IFNg -producing from CD44hi CD8+ T cells in the draining popliteal LN from the shown gate. (F) Quantification of the total number and geometric mean fluorescence intensity (gMFI) of IFNg -producing from CD44hi CD8+T cells in the draining pLN from the shown gate. (G) Experimental schematic for H-L. Mice were challenged with LM-ova intraperitoneally (I.P.) (H) Same as B, except for the mice were challenged with LM-ova I.P. (I), Same as C, except for the mice were challenged with LM-ova I.P. (J) Same as D, except for the mice were challenged with LM-ova I.P. (K) Same as E, except for the mice were challenged with LM-ova I.P. (L), Same as F, except mice were challenged with LM-ova I.P. Statistical analysis was done using an unpaired t-test where the p-value between vaccine + vehicle + LM-ova (blue bar) and vaccine + VV-WR + LM-ova (red bar) is <0.0001. Errors bars are mean ± standard error of the mean. In each experiment, n=3–5 mice per group were evaluated and the experiment was repeated n=2 times. Shown is the combined data from both experiments. A third replicate was not performed as our experiments were adequately powered to provide statistical significance in accordance with our IACUC policies regarding animal experiments with consistent data points.
Figure 5
Figure 5. Vaccinia infection during the timeframe of antigen archiving induces robust and durable protective immunity.
(A) Experimental schematic for B-D. Mice were immunized with ova/polyI:C/aCD40, infected with VV-WR, and challenged with LM-ova or LM at indicated time points. Foot and ankle skin or spleen were harvested. (B-D) Respective tissues were processed as described in the methods section. Homogenized tissues were plated on BHI + erythromycin (LM-ova) or streptomycin (LM) plates and colonies were counted after 3 days of growth. (E) Experimental schematic for F, G. Mice were immunized, infected with VV-WR, and challenged with LM-ova at indicated time points. (F, G) Same as B-D. (H) Experimental schematic for I, J. Mice were immunized, infected with VV-WR, and rechallenged with LM-ova at indicated time points. (I, J) Same as B-D. Statistical analysis was done using unpaired t-test where the p-value between vaccine + vehicle (blue bar) and vaccine + VV-WR (red bar) is <0.0001. Errors bars are mean ± standard error of the mean. In each experiment, at least n=3–5 mice per group were evaluated and the experiment was repeated n=2 times. Shown are all data points from both experiments. A third replicate was not performed as our experiments were adequately powered to provide statistical significance in accordance with our IACUC policies regarding animal experiments with consistent data points.

Similar articles

References

    1. Welsh R.M., Che J.W., Brehm M.A. & Selin L.K. Heterologous immunity between viruses. Immunol Rev 235, 244–266 (2010). - PMC - PubMed
    1. Wilson D.B. et al. Specificity and degeneracy of T cells. Mol Immunol 40, 1047–1055 (2004). - PubMed
    1. Nikolich-Zugich J., Slifka M.K. & Messaoudi I. The many important facets of T-cell repertoire diversity. Nat Rev Immunol 4, 123–132 (2004). - PubMed
    1. Long Q.X. et al. Clinical and immunological assessment of asymptomatic SARS-CoV-2 infections. Nat Med 26, 1200–1204 (2020). - PubMed
    1. Ibarrondo F.J. et al. Rapid Decay of Anti-SARS-CoV-2 Antibodies in Persons with Mild Covid-19. N Engl J Med 383, 1085–1087 (2020). - PMC - PubMed

Publication types