[Preprint]. 2023 Sep 26:rs.3.rs-3385749.
doi: 10.21203/rs.3.rs-3385749/v1.

Prophylactic and long-lasting efficacy of senolytic CAR T cells against age-related metabolic dysfunction

Affiliations

Prophylactic and long-lasting efficacy of senolytic CAR T cells against age-related metabolic dysfunction

Corina Amor et al. Res Sq. .

Update in

Abstract

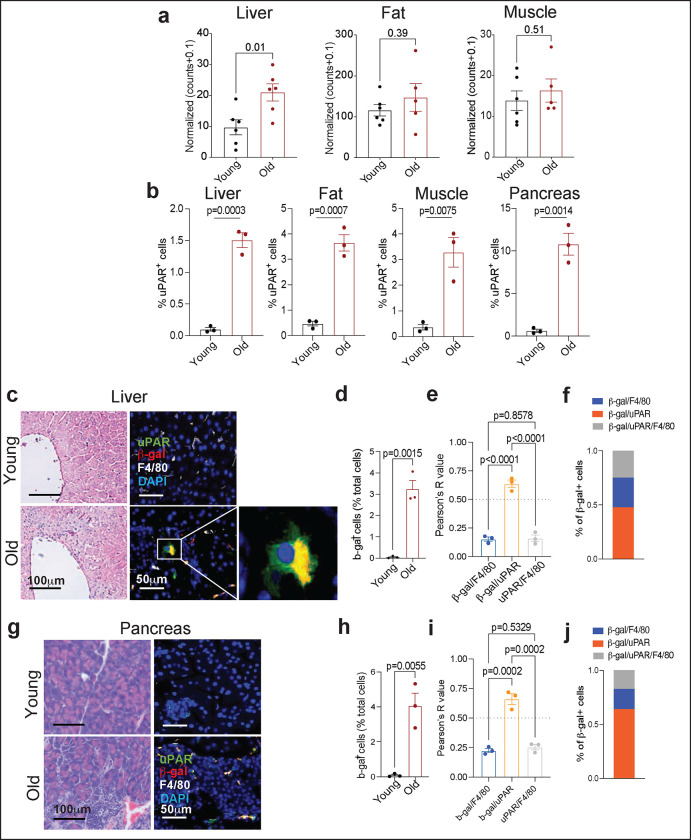
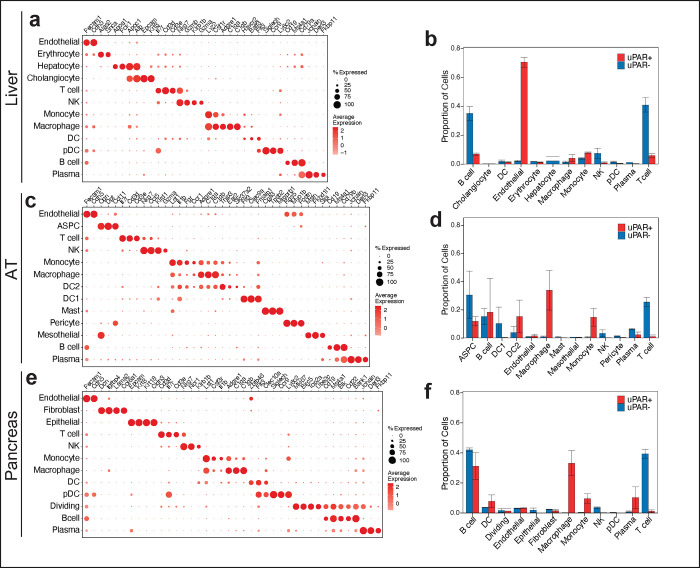
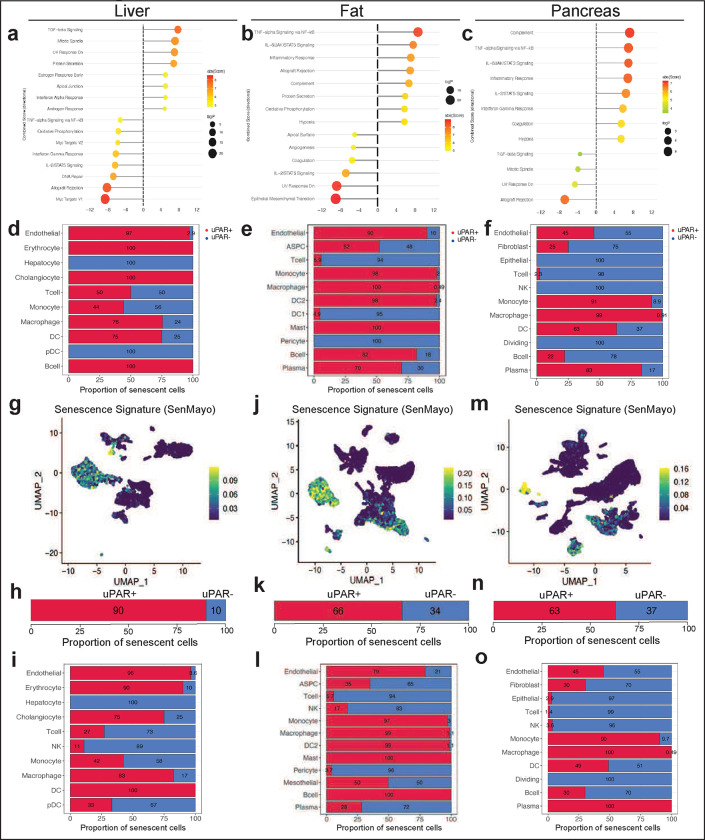
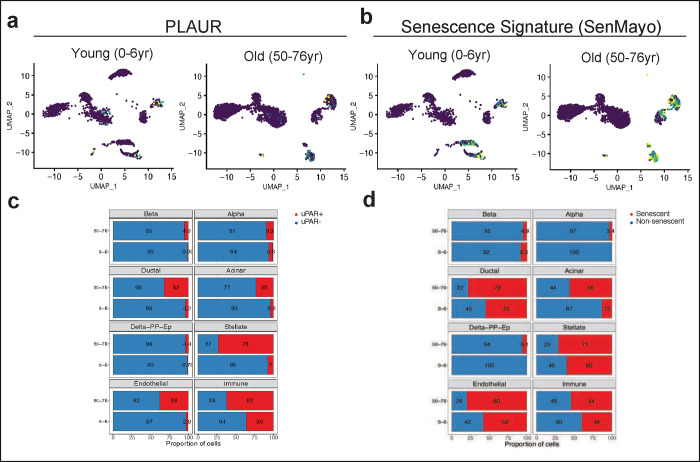
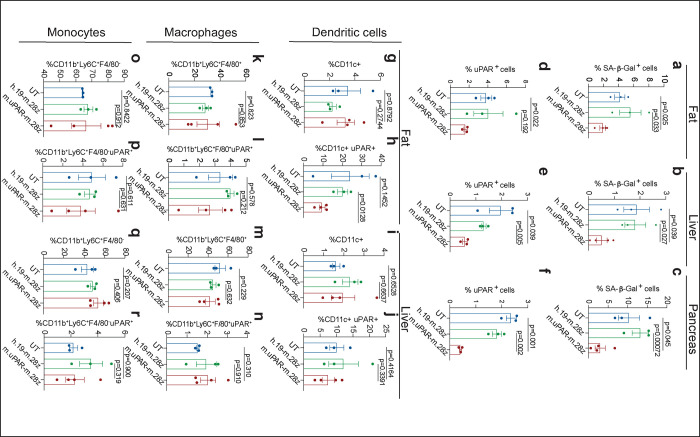
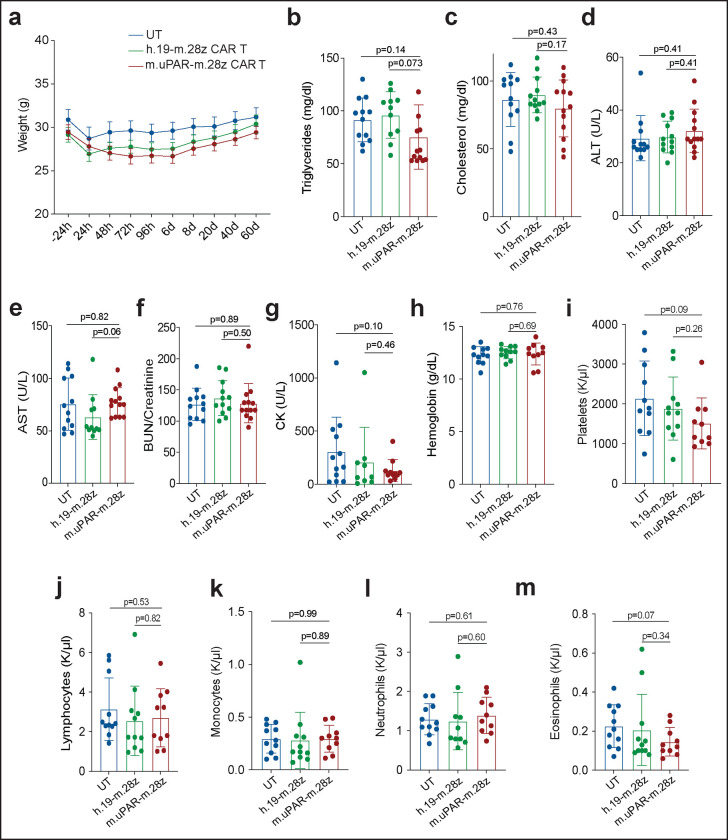
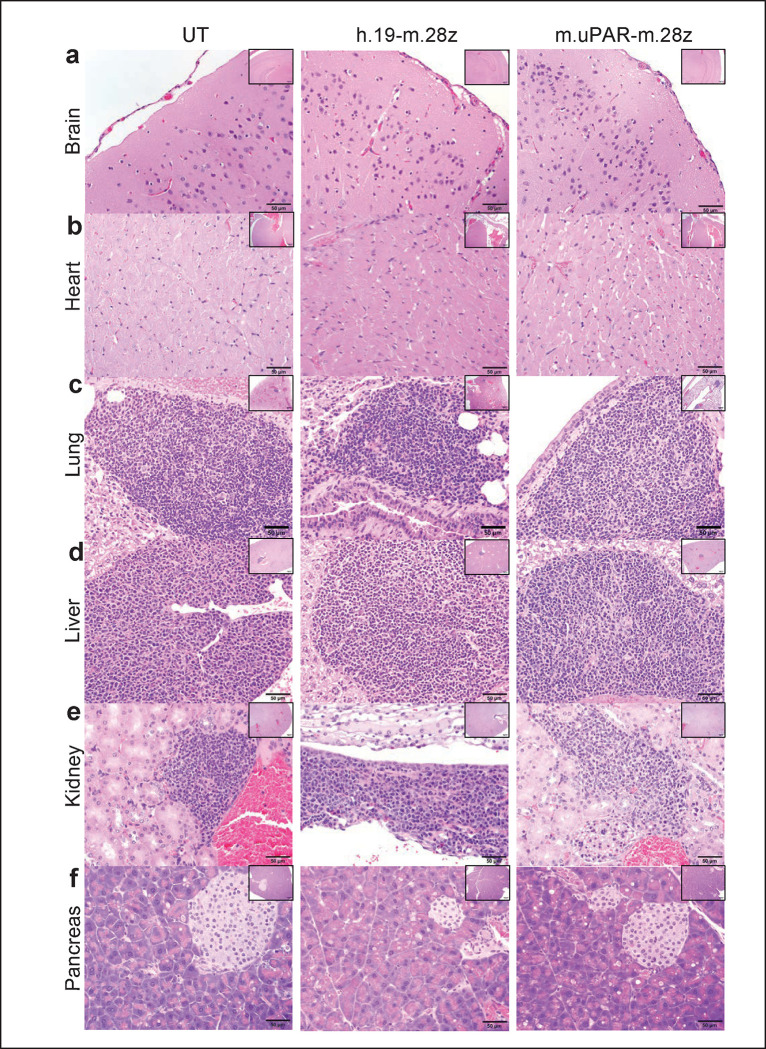
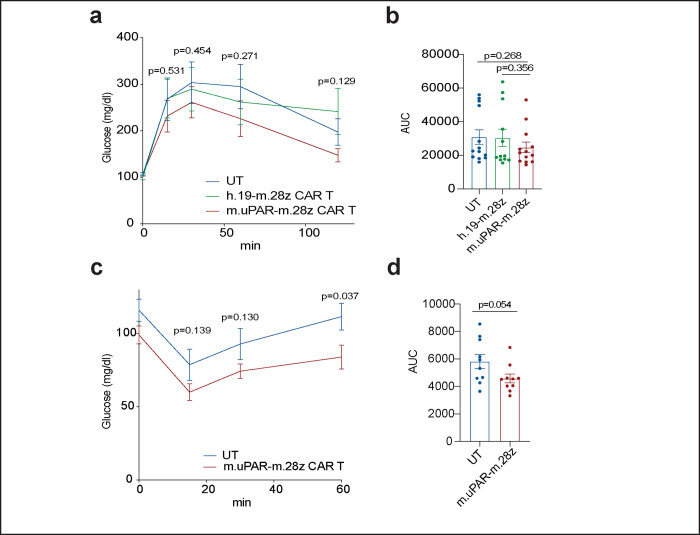
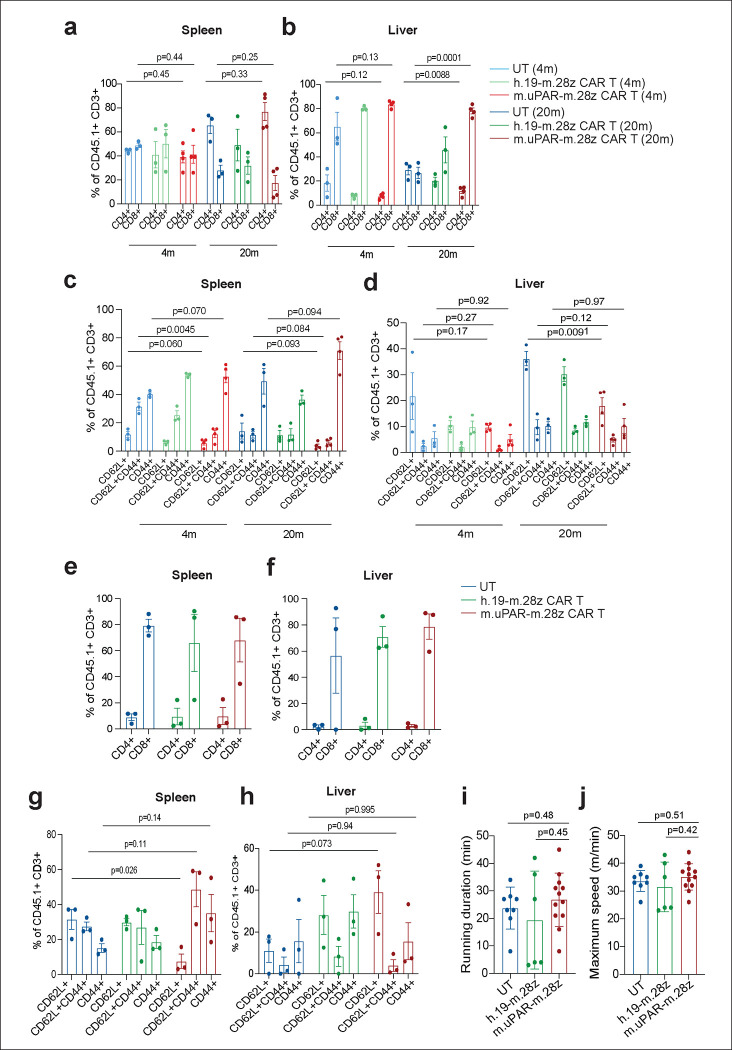
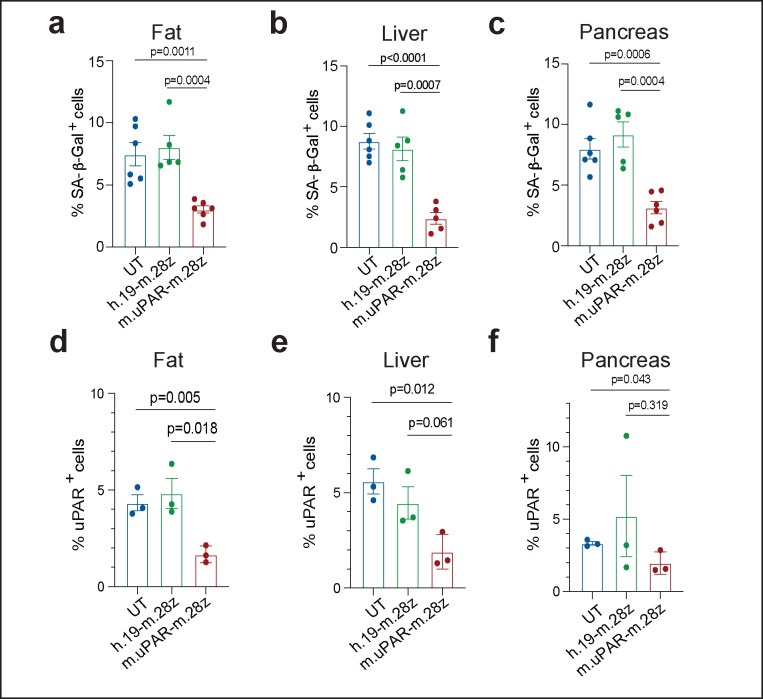
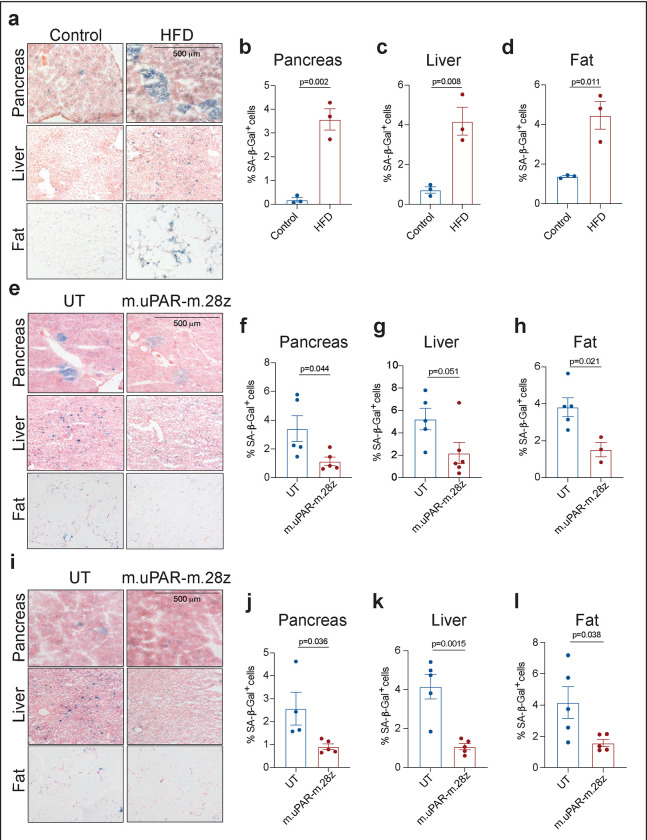
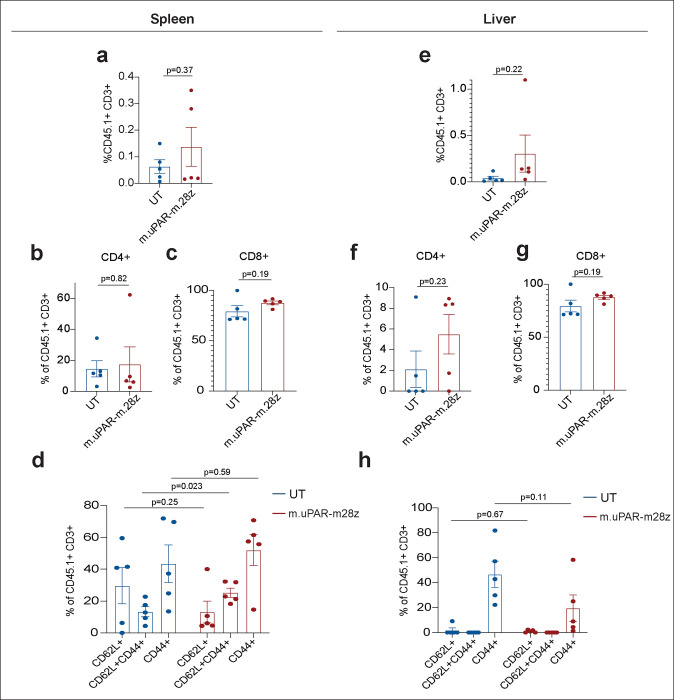
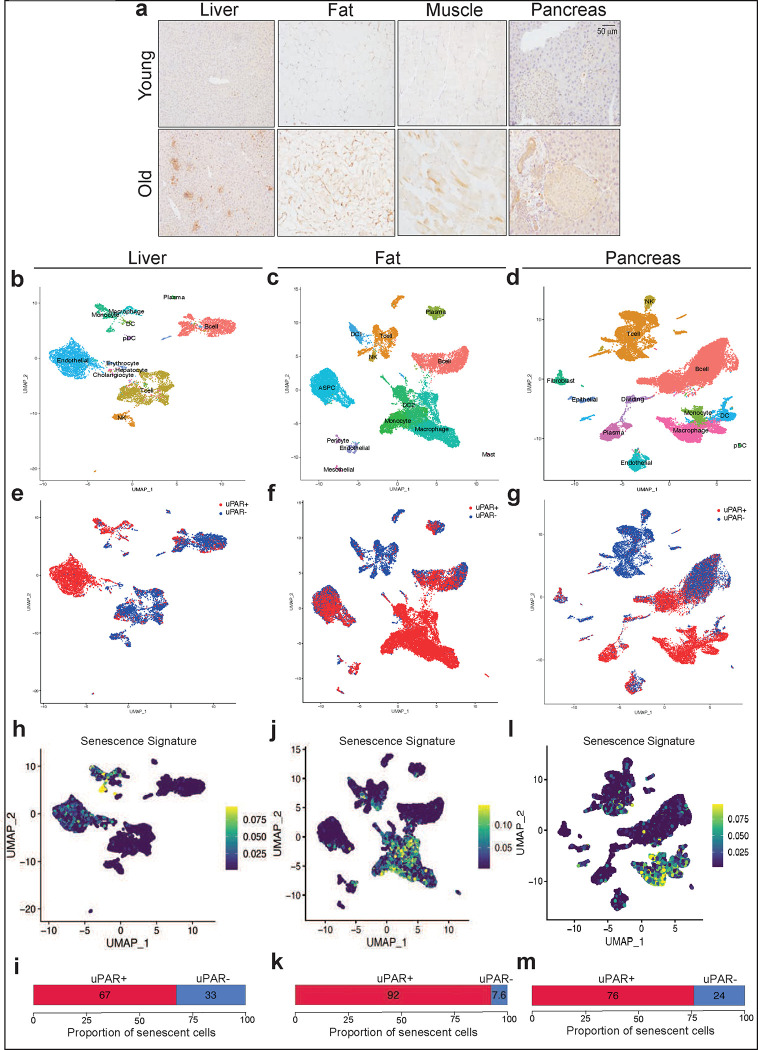
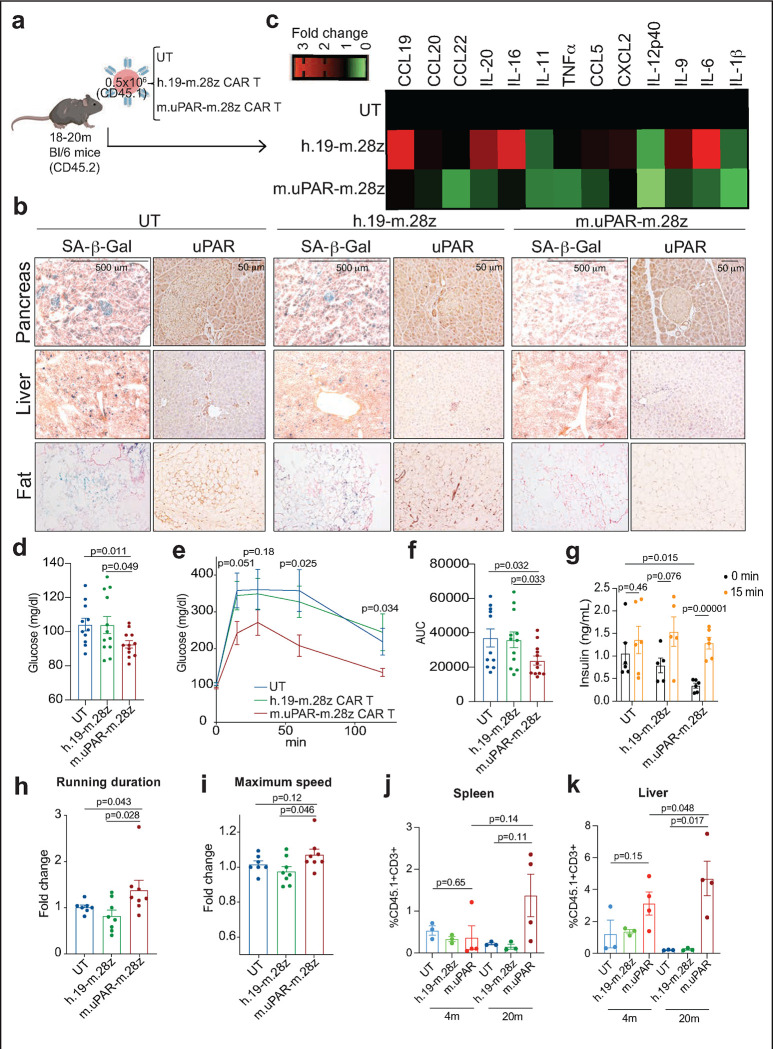
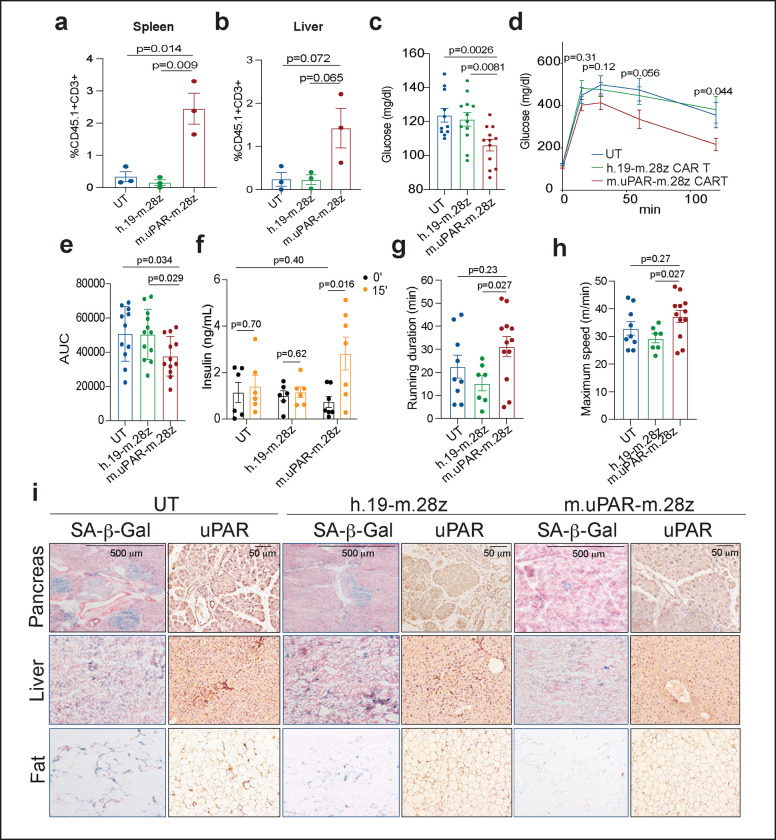
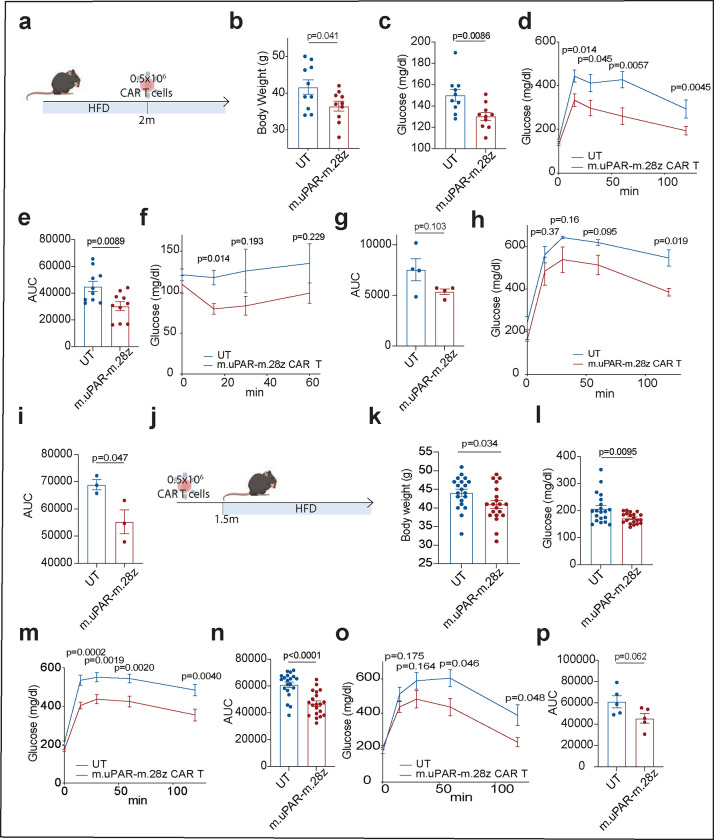
Senescent cells accumulate in organisms over time because of tissue damage and impaired immune surveillance and contribute to age-related tissue decline1,2. In agreement, genetic ablation studies reveal that elimination of senescent cells from aged tissues can ameliorate various age-related pathologies, including metabolic dysfunction and decreased physical fitness3-7. While small-molecule drugs capable of eliminating senescent cells (known as 'senolytics') partially replicate these phenotypes, many have undefined mechanisms of action and all require continuous administration to be effective. As an alternative approach, we have developed a cell-based senolytic therapy based on chimeric antigen receptor (CAR) T cells targeting uPAR, a cell-surface protein upregulated on senescent cells, and previously showed these can safely and efficiently eliminate senescent cells in young animals and reverse liver fibrosis8. We now show that uPAR-positive senescent cells accumulate during physiological aging and that they can be safely targeted with senolytic CAR T cells. Treatment with anti uPAR CAR T cells ameliorates metabolic dysfunction by improving glucose tolerance and exercise capacity in physiological aging as well as in a model of metabolic syndrome. Importantly, a single administration of a low dose of these senolytic CAR T cells is sufficient to achieve long-term therapeutic and preventive effects.


Conflict of interest statement

Competing Interests C.A., J.F., M.S. and S.W.L. are listed as the inventors of several patent applications (62/800,188; 63/174,277; 63/209,941; 63/209,940; 63/209,915; 63/209,924; 17/426,728; 3,128,368; 20748891.7; 2020216486) related to senolytic CAR T cells. C.A., M.S. and S.W.L. are advisors for Fate Therapeutics. S.W.L. also has provided consultancy for and had equity in Oric Pharmaceuticals, Blueprint Medicines, Mirimus Inc, Senecea Therapeutics, Faeth Therapeutics, and PMV Pharmaceuticals. D.A.T. is a member of the Scientific Advisory Board and receives stock options from Leap Therapeutics, Dunad Therapeutics, Cygnal Therapeutics and Mestag Therapeutics outside the submitted work. D.A.T. is scientific co-founder of Mestag Therapeutics. D.A.T. has received research grant support from Fibrogen, Mestag, and ONO Therapeutics. D.A.T. receives grant funding from the Lustgarten Foundation, the NIH, and the Thompson Foundation. None of this work is related to the publication. No other disclosures were reported. R.L.L. is on the supervisory board of Qiagen and is a scientific advisor to Imago, Mission Bio, Zentalis, Ajax, Auron, Prelude, C4 Therapeutics and Isoplexis. R.L.L. receives research support from Ajax, Zentalis and Abbvie and has consulted for Incyte, Janssen and Astra Zeneca and has received honoraria from Astra Zeneca for invited lectures. L.W.J owns stock in Pacyclex, Inc., and Illuminosonics, Inc. M.S. holds other unrelated patents on CAR technologies. S.W.L is an advisor for and has equity in the following biotechnology companies: ORIC Pharmaceuticals, Faeth Therapeutics, Blueprint Medicines, Geras Bio, Mirimus Inc., PMV Pharmaceuticals and Constellation Pharmaceuticals.

Figures

Extended Data Figure 1 |
Extended Data Figure 1 |. Characterization of uPAR-positive cells in aging.
a, RNA expression of Plaur in liver, adipose tissue (fat) and muscle of young (3 months) or old (21 months) mice. Data obtained from the Tabula Muris Senis project. b, Quantification of immunohistochemical staining of mouse uPAR in liver, adipose tissue, muscle and pancreas from young (age 3 months) or old (age 20 months) mice (n=3 per age). c, Hematoxylin and eosin staining and immunofluorescence staining of young (age 3 months n=3 mice) or old (age 18–20 months n=3 mice) livers. uPAR (green), β-gal (red), F4/80 (white), DAPI (blue). d) Percentage of SA-b-gal positive cells in young and aged livers in c. e) Correlation (Pearson’s R value) of β-gal and F4/80 co-staining, β-gal and uPAR co-staining or uPAR and F4/80 co-staining in aged livers. f) Percentage of β-gal positive cells that costain for F4/80, uPAR or uPAR and F4/80 in aged livers. g) Hematoxylin and eosin staining and immunofluorescence staining of young (age 3 months n=3 mice) or old (age 18–20 months n=3 mice) pancreas. uPAR (green), β-gal (red), F4/80 (white), DAPI (blue). h) Percentage of SA-b-gal positive cells in young and aged livers in g. i) Correlation (Pearson’s R value) of β-gal and F4/80 co-staining, β-gal and uPAR co-staining or uPAR and F4/80 co-staining in aged pancreas. j) Percentage of β-gal positive cells that costain for F4/80, uPAR or uPAR and F4/80 in aged pancreas. Data are mean ± s.e.m (a,b,d,e,h,i); values are derived from two-tailed unpaired Student’s t-tests (a,b,d,h) one-way ANOVA with multiple comparisons (e,i). Results are from 1 independent experiment (a-j).
Extended Data Figure 2 |
Extended Data Figure 2 |. Single cell profile of aged tissues.
a, Dot plot showing expression of 34 signature genes across the 12 lineages of the liver. The size of the dots represents the proportion of cells expressing a particular marker, and the color scale indicates the mean expression levels of the markers (z-score transformed). b, Fractions of uPAR-positive and uPAR-negative cells in the various lineages in liver (n=4 mice per group). Error bars represent s.d. c, Dot plot showing expression of 40 signature gene expressions across the 13 lineages of the adipose tissue. The size of the dots represents the proportion of cells expressing a particular marker, and the color scale indicates the mean expression levels of the markers (z-score transformed). d, Fractions of uPAR-positive and uPAR-negative cells in the various lineages in adipose tissue (n=4 mice per group). Error bars represent s.d. e, Dot plot showing expression of 40 genes across the 12 lineages of the pancreas. The size of the dots represents the proportion of cells expressing a particular marker, and the color scale indicates the mean expression levels of the markers (z-score transformed). f, Fractions of uPAR-positive and uPAR-negative cells in the various lineages in pancreas (n=4 mice per group). Error bars represent s.d. Data are mean ± s.d.; p values are derived from two-tailed unpaired Student’s t-tests (b,d,f). Results are from 1 independent experiment (a-f).
Extended Data Figure 3 |
Extended Data Figure 3 |. Characteristics of senescent uPAR-positive cells in aged tissues.
a-c, Molecular Signature Database Hallmark 2020 signatures that are significantly enriched in uPAR positive cells vs uPAR negative cells of liver (a), adipose tissue (b) and pancreas (c). d-f, quantification of the proportion of uPAR positive and negative cells by cell type contributing to the respective senescence signature in Fig.1h (d), Fig.1j (e) and Fig.1l (f). g-o, UMAP visualizations with senescence signature scores in each cell indicated by the color scale. Below: quantification of the proportion of uPAR positive and negative cells contributing to the respective senescence signature in total (h,k,n) and by cell type (I,l,o). g,h,I, liver; j,k,l, adipose tissue; m,n,o; pancreas. Results are from 1 independent experiment (a-m).
Extended Data Figure 4|
Extended Data Figure 4|. Upregulation of uPAR and senescence signatures in aged human pancreas.
Single-cell RNAsequencing data of human pancreas of different ages from was analyzed. a, Uniform manifold approximation and projection (UMAP) visualization of Plaur expression across pancreas cell types in young humans (0–6 years old) and old humans (50–76 years old).b, UMAP visualization of senescence signature expression across pancreas cell types in young humans (0–6 years old) and old humans (50–76 years old). c, Quantification of the proportion of uPAR positive and negative cells by cell type and age. d, Quantification of the proportion of senescent signature expressing or non-expressing cells cells by cell type and age.
Extended Data Figure 5 |
Extended Data Figure 5 |. Effect of uPAR CAR T cells on aged tissues.
a-c, Quantification of SA-β-Gal–positive cells in adipose tissue, liver and pancreas 20 days after cell infusion (n=3 for UT; n=3 for h.19-m.28z; n=4 for m.uPAR-m.28z). d-f, Quantification of uPAR-positive cells in adipose tissue, liver and pancreas 20 days after cell infusion (n=3 per group). g-j, Percentage of dendritic cells and uPAR+ dendritic cells in the adipose tissue (g,h) or liver (i,j) 20 days after cell infusion (n=3 for UT; n=3 for h.19-m.28z; n=4 for m.uPAR-m.28z). k-n, Percentage of macrophages and uPAR+ macrophages in the adipose tissue (k,l,) or liver (m,n) 20 days after cell infusion (n=3 for UT; n=3 for h.19-m.28z; n=4 for m.uPAR-m.28z). o-r, Percentage of monocytes and uPAR+ monocytes in the adipose tissue (o,p) or liver (q,r) 20 days after cell infusion (n=3 for UT; n=3 for h.19-m.28z; n=4 for m.uPAR-m.28z). Results of 1 independent experiment (a-r). Data are mean ± s.e.m.; p values from two-tailed unpaired Student’s t-test (a-r).
Extended Data Figure 6 |
Extended Data Figure 6 |. Safety of uPAR CAR T cells in aged mice.
Mice received cell infusions at 18–20 months. a, Weight of mice 24h before and at different time points after cell infusion (n=12 mice for untransduced T cells [UT]; n=11 for h.19-m.28z; n=12 for m.uPAR-m.28z). b, Levels of triglycerides 20 days after cell infusion (n=12 mice for UT; n=11 for h.19-m.28z; n=13 for m.uPAR-m.28z). c, Levels of cholesterol 20 days after cell infusion (n=12 for UT and for h.19-m.28z; n=13 for m.uPAR-m.28z). d, Levels of ALT 20 days after cell infusion (sample sizes as in c). e, Levels of AST 20 days after cell infusion (n=12 for UT; n=11 for h.19-m.28z; n=13 for m.uPAR-m.28z). f, BUN/creatinine ratio 20 days after cell infusion (sample sizes as in c). g, Creatine kinase (CK) 20 days after cell infusion (n=12 for UT; n=9 for h.19-m.28z; n=11 for m.uPAR-m.28z). h, Levels of hemoglobin 20 days after cell infusion (n=11 for UT; n=11 for h.19-m.28z; n=10 for m.uPAR-m.28z). i, Number of platelets 20 days after cell infusion (n=11 for UT; n=11 for h.19-m.28z; n=10 for m.uPAR-m.28z). j, Number of lymphocytes 20 days after cell infusion (n=11 for UT; n=11 for h.19-m.28z; n=10 for m.uPAR-m.28z). k, Number of monocytes 20 days after cell infusion (n=11 for UT; n=11 for h.19-m.28z; n=10 for m.uPAR-m.28z). l, Number of neutrophils 20 days after cell infusion (n=11 for UT; n=10 for h.19-m.28z; n=10 for m.uPAR-m.28z). m, Number of eosinophils 20 days after cell infusion (n=11 for UT; n=11 for h.19-m.28z; n=10 for m.uPAR-m.28z). Results for all panels are from 2 independent experiments. Data are mean ± s.e.m.; p values from two-tailed unpaired Student’s t-test (b-m).
Extended Data Figure 7 |
Extended Data Figure 7 |. uPAR CAR T cells are not associated with signs of tissue damage in aged tissues and do not exacerbate spontaneous age-related histological changes in lung, liver and kidneys.
Mice received cell infusions at 18–20 months and were sacrificed 20 days after infusion of the indicated T cells. Sections were stained with hematoxylin and eosin. Aged mice showed mononuclear leukocytic aggregates composed predominantly of lymphocytes and plasma cells in tissues in an age dependent manner. These leukocytic aggregates were more frequently observed in tissues from uPAR-m.28z CAR T- treated aged mice than tissues from control aged mice and were not associated with necrosis and/or degeneration in tissues from both experimental and control aged mice. These lymphocytic and plasmocytic aggregates in tissues are often observed in naïve aged mice and are considered spontaneous background findings in longitudinal aging studies in mice,. a, Representative sections of normal cerebral cortex and meninges at the level of the posterior hypothalamus (inset: hippocampus). b. Histology of normal cardiomyocytes and interstitium in myocardium (inset: ventricles and interventricular septum). c. Representative histology of normal lungs showed dense aggregates of lymphocytes and fewer plasma cells and macrophages around bronchioles or vasculature (inset: pulmonary lobes). d. The liver from aged mice showed accumulation of lymphocytic and histiocytic aggregates in portal to periportal regions (Inset: hepatic lobe). e. Histology of the kidneys showed accumulation of lymphocytes and plasma cells in the renal interstitium (n & o) and around blood vessels (inset: renal cortex, medulla and pelvis). f. Representative sections of normal pancreatic acini (exocrine pancreas) and islets of Langerhans (endocrine pancreas; inset: pancreatic lobule). Images were captured at 4x (insets) and 40x magnifications.
Extended Data Figure 8 |
Extended Data Figure 8 |. Effect of uPAR CAR T cells in young and old tissues.
a-b, Mice received cell infusion at 3 months old. a, Levels of glucose before (0 min) and after intraperitoneal administration of glucose (2 g/kg) 2.5 months after cell infusion (n=13 for untransduced T cells; n=12 for h.19-m.28z and n=13 for m.uPAR-m.28z). b, Area under the curve (AUC) representing the results from a. Each point represents a single mouse. c-d, Mice received cell infusion at 18–20 months old. c, Levels of glucose before (0 min) and after intraperitoneal administration of insulin (0.5 units/kg body weight) 2.5 months after cell infusion (n=10 for untransduced T cells and n=10 for m.uPAR-m.28z). d, Area under the curve (AUC) representing the results from c. Each point represents a single mouse. Results of 2 independent experiments (a,b) or 1 independent experiment (c,d). Data are mean ± s.e.m.; p values from two-tailed unpaired Student’s t-test (a-d).
Extended Data Figure 9 |
Extended Data Figure 9 |. Profile of uPAR CAR T cells in aging.
a,b, Percentage of CD4+ or CD8+ cells among CD45.1+ T cells from the spleen (a) or liver (b) of 4-month-old or 20-month-old mice 20 days after cell infusion (n=3 mice per age group for untransduced T cells [UT] and for h.19-m.28z; n=4 for m.uPAR-m.28z). c,d, Percentage of CD45.1+ T cells expressing differentiation markers CD62L and CD44 in the spleen (c) or liver (d) of 4-month-old or 20-month-old mice 20 days after cell infusion (sample sizes as in a). e,f, Percentage of CD4+ or CD8+ cells among CD45.1+ T cells in the spleen (e) or liver (f) of 15-month-old mice 12 months after cell infusion (n=3 mice per group). g,h, Percentage of CD45.1+ T cells expressing differentiation markers CD62L and CD44 on CD45.1+ T cells in the spleen (g) or liver (h) of 15-month-old mice 12 months after cell infusion (n=3 mice per group). i, Time to exhaustion in exercise capacity testing 12 months after cell infusion (n=8 for untransduced T cells; n=6 for h.19-m.28z; n=12 for m.uPAR-m.28z). j, Maximum speed (m/min) in capacity testing 12 months after cell infusion (sample sizes as in i). Results of 1 independent experiment (a-h) or 2 independent experiments (i,j). Data are mean ± s.e.m.; p values are from two-tailed unpaired Student’s t-test (a-h) or Mann Whitney test (i,j).
Extended Data Figure 10 |
Extended Data Figure 10 |. Long-term effect of uPAR CAR T cells on aged tissues.
Quantification of SA-β-Gal–positive cells 12 months after cell infusion in (a) adipose tissue (n=6 for UT; n=5 for h.19-m.28z; n=6 for m.uPAR-m.28z); (b) liver (n=6 for UT; n=5 for h.19-m.28z; n=5 for m.uPAR-m.28z) and (c) pancreas (n=6 for UT; n=5 for h.19-m.28z; n=6 for m.uPAR-m.28z). d-f, Quantification of uPAR-positive cells in (d) adipose tissue, (e) liver and (f) pancreas 20 days after cell infusion (n=3 per group). Results of 2 independent experiments (a-c) and 1 independent experiment (d-f). Data are mean ± s.e.m.; p values from two-tailed unpaired Student’s t-test (a-f).
Extended Data Figure 11 |
Extended Data Figure 11 |. uPAR CAR T cells decrease senescent cell burden in therapeutic and preventive settings in high fat diet.
a, Representative staining of SA-β-Gal after two months of high fat diet or normal chow diet. b-d; Quantification of SA-β-Gal–positive cells in pancreas, liver and adipose tissue after two months of high fat diet or normal chow diet (n=3 for chow; n=3 HFD). e, Representative staining of SA-β-Gal 1 month after cell infusion in the experimental scheme depicted in Fig. 4a. f-h; Quantification of SA-β-Gal–positive cells in pancreas, liver and adipose tissue 1 month after cell infusion (n=5 for UT; for m.uPAR-m.28z n=5 in pancreas, n=6 in liver and n=3 in adipose tissue). UT, untransduced T cells. i, Representative staining of SA-β-Gal 3.5 months after cell infusion in the experimental scheme depicted in Fig. 4j. j-l, Quantification of SA-β-Gal–positive cells in pancreas, liver and adipose tissue 3.5 months after cell infusion (UT n=4 in pancreas, n=5 in liver and adipose tissue; for m.uPAR-m.28z n=5). Each panel shows results from 1 experiment. Data are mean ± s.e.m.; p values from two-tailed unpaired Student’s t-test (b-d; f-h; j-l).
Extended Data Figure 12 |
Extended Data Figure 12 |. Profile and persistence of uPAR CAR T cells in metabolic syndrome.
T cells were assessed in spleen (a-d) and liver (e-h) 3.5 months after cell infusion in the experimental scheme depicted in Fig. 4j. a, Percentage of CD45.1+ T cells in the spleen. b, Percentage of CD4+ cells among CD45.1+ T cells in the spleen. c, Percentage of CD8+ cells among CD45.1+ T cells in the spleen. d, Percentage of CD45.1+ T cells from the spleen expressing differentiation markers CD62L and CD44. e, Percentage of CD45.1+ T cells in the liver. f, Percentage of CD4+ cells among CD45.1+ T cells in the liver. g, Percentage of CD8+ cells among CD45.1+ T cells in the liver. h, Percentage of CD45.1+ T cells in the liver expressing differentiation markers CD62L and CD44. Results in each panel are from 1 experiment (n=5 mice per group). Data are mean ± s.e.m.; p values from two-tailed unpaired Student’s t-test.
Extended Data Figure 13 |
Extended Data Figure 13 |. Gating strategies.
a,b, Representative flow cytometry staining of m.uPAR-m.28z (a) or untransduced T cells (b) obtained from the spleens of mice 20 days after cell infusion as depicted in Fig. 2l. Shown are results of 1 independent experiment (n=3 mice for untransduced T cells; n=4 mice for m.uPAR-m.28z).
Figure 1 |
Figure 1 |. uPAR is upregulated on senescent cells in physiological aging.
a, Immunohistochemical staining of mouse uPAR in liver, adipose tissue, muscle and pancreas from young (age 3 months) or old (age 20 months) mice (n=3 per age). b-m, Single-cell analysis of uPAR expression and senescence. uPAR-positive and uPAR-negative cells were sorted from the liver, adipose tissue and pancreas of 20-month-old mice and subjected to single-cell RNAsequencing by 10X chromium protocol (n=4 mice). b, Uniform manifold approximation and projection (UMAP) visualization of liver cell types. c, UMAP visualization of adipose tissue cell types. d, UMAP visualization of pancreas cell types. e, UMAP visualization of hepatic uPAR negative and uPAR positive cell types. f, UMAP visualization of adipose uPAR negative and uPAR positive cell types. g, UMAP visualization of pancreatic uPAR negative and uPAR positive cell types.h-m, UMAP visualizations with senescence signature scores in each cell indicated by the color scale. Below: quantification of the proportion of uPAR positive and negative cells contributing to the respective senescence signature. h,i, liver; j,k, adipose tissue; l,m; pancreas. Results are from 1 independent experiment (a-m).
Figure 2 |
Figure 2 |. uPAR CAR T cells revert natural age-associated phenotypes.
a, Experimental scheme for Fig. 2b–k. 18- to 20-month-old C57Bl/6N mice were injected with 0.5×10⁶ m.uPAR-m.28z CAR T cells, h.19-m.28z CAR T cells, or untransduced T (UT) cells generated from CD45.1 mice 16h after administration of cyclophosphamide (200 mg/kg). Mice were monitored over time and/or harvested 20 days after cell infusion. Schematic was created with BioRender.com. b, Representative staining of SA-β-Gal and uPAR 20 days after cell infusion. c, Heatmap depicting fold change in the levels of SASP cytokines compared to UT treated mice (n=3 for untransduced T cells; n=3 for h.19-m.28z; n=4 for m.uPAR-m.28z). d, Levels of basal glucose (mg/ml) after starvation 2.5 months after cell infusion (n=11 mice for untransduced T cells; n=12 for h.19-m.28z and for m.uPAR-m.28z). e, Levels of glucose before (0 min) and after intraperitoneal administration of glucose (2 g/kg) 2.5 months after cell infusion (samples sizes as in d). f, Area under the curve (AUC) representing the results from e. Each point represents a single mouse. g, Levels of insulin before and 15 minutes after intraperitoneal glucose administration (2 g/kg) 2.5 months after cell infusion (n=6 for untransduced T cells; n=5 for h.19-m.28z; n=6 for m.uPAR-m.28z). h, Fold change in time to exhaustion in exercise capacity testing before cell infusion and 2.5 months after it (n=7 for untransduced T cells; n=8 for h.19-m.28z and n= 8 for m.uPAR-m.28z). i, Fold change in maximum speed in capacity testing before cell infusion and 2.5 months after it (sample sizes as in h). j,k, Percentage of CD45.1+ T cells in the spleen (j) or liver (k) of 4-month-old or 20-month-old mice 20 days after cell infusion (n=3 mice per age group for untransduced T cells and for h.19-m.28z; n=4 for m.uPAR-m.28z). Results are from 2 independent experiments (d-f; h-i) or 1 experiment (b-c; g; j-k). Data are mean ± s.e.m.; p values from two-tailed unpaired Student’s t-test (d-g;j-k) or. Mann Whitney test (h,i).
Figure 3 |
Figure 3 |. uPAR CAR T cells prevent natural age-associated phenotypes.
3–4-month-old C57Bl/6N mice were injected with 0.5×10⁶ m.uPAR-m.28z CAR T cells, h.19-m.28z CAR T cells, or untransduced T cells generated from CD45.1 mice 16h after administration of cyclophosphamide (200 mg/kg). Mice were monitored over time and/or harvested at 15 months of age. a,b, Percentage of CD45.1+ T cells in the spleen (a) or liver (b) of 15-month-old mice 12 months after cell infusion (n=3 mice per group). c, Levels of basal glucose after starvation 15–18 months after cell infusion (n=11 mice for untransduced T cells; n=12 for h.19-m.28z and for m.uPAR-m.28z). d, Levels of glucose before (0 min) and after intraperitoneal administration of glucose (2 g/kg) 15–18 months after cell infusion (sample sizes as in c). e, Area under the curve (AUC) representing the results from d. Each point represents a single mouse. f, Levels of insulin (ng/ml) before and 15 minutes after intraperitoneal glucose (2 g/kg) 15 months after cell infusion (n=6 for untransduced T cells; n=6 for h.19-m.28z; n=7 for m.uPAR-m.28z). g, Time to exhaustion in exercise capacity testing 6 months after cell infusion (n=9 for untransduced T cells; n=7 for h.19-m.28z; n=12 for m.uPAR-m.28z). h, Maximum speed (m/min) in capacity testing 6 months after cell infusion (sample sizes as in g). i, Representative staining of SA-β-Gal and uPAR 15 months after cell infusion. Results are from 1 independent experiment (a-b; f; i) or 2 independent experiments (c-e; g-h). Data are mean ± s.e.m.; p values from two-tailed unpaired Student’s t-test (a-f) or Mann Whitney test (g,h).
Figure 4 |
Figure 4 |. uPAR CAR T cells are therapeutic and preventive in metabolic syndrome.
a, Experimental scheme for Fig. 4b–i. 3-month-old C57BL/6N mice were treated with high fat diet (HFD) for 2 months followed by intravenous infusion with 0.5×10⁶ m.uPAR-m.28z or untransduced T cells 16h after administration of cyclophosphamide (200 mg/kg). Mice were monitored over time or euthanized 1 month after cell infusion. b, body weight 1 month after cell infusion (n=10 mice per group). c, Levels of basal glucose after starvation at 1 month after cell infusion (n=10 mice per group). d, Levels of glucose before (0 min) and after intraperitoneal administration of glucose (1 g/kg) 1 month after cell infusion (n=10 mice per group). e, Area under the curve (AUC) representing the results from d. f, Levels of glucose before (0 min) and after intraperitoneal administration of insulin (0.5 units/kg body weight) 1 month after cell infusion (n=4 per group). g, AUC representing the results from f. Each point represents a single mouse. h, Levels of glucose before (0 min) and after intraperitoneal glucose administration (1 g/kg) 2.5 months after cell infusion (n=3 mice per group). i, AUC representing the results from h. Each point represents a single mouse. j, Experimental scheme for Fig. 4k–p. 3-month-old C57BL/6N mice were intravenously infused with 0.5×10⁶ m.uPAR-m.28z or untransduced T cells 16h after administration of cyclophosphamide (200 mg/kg). 1.5 months after infusion, mice were placed on a high fat diet, then monitored over time or euthanized 2 months after the start of the high fat diet. k, body weight 3.5 months after cell infusion (n=20 mice per group. l, Levels of basal glucose after starvation 3.5 months after cell infusion (n=20 mice per group). m, Levels of glucose before (0 min) and after intraperitoneal administration of glucose (1 g/kg) 1 month after cell infusion (n=20 mice per group). n, AUC representing the results from m. o, Levels of glucose before (0 min) and after intraperitoneal glucose administration (1 g/kg) 5.5 months after cell infusion (n=5 mice per group). p, AUC representing the results from o. Each point represents a single mouse. (a-p). Results are from 2 independent experiments (b-e;k-n) or 1 independent experiment (f-i; o-p). Data are mean ± s.e.m.; p values derived from two-tailed unpaired Student’s t-test (b-i; k-p). Schematics were created with BioRender.com.

References

    1. Ovadya Y. et al. Impaired immune surveillance accelerates accumulation of senescent cells and aging. Nat Commun 9, 5435, doi:10.1038/s41467-018-07825-3 (2018). - DOI - PMC - PubMed
    1. Lopez-Otin C., Blasco M. A., Partridge L., Serrano M. & Kroemer G. The hallmarks of aging. Cell 153, 1194–1217, doi:10.1016/j.cell.2013.05.039 (2013). - DOI - PMC - PubMed
    1. Baker D. J. et al. Naturally occurring p16(Ink4a)-positive cells shorten healthy lifespan. Nature 530, 184–189, doi:10.1038/nature16932 (2016). - DOI - PMC - PubMed
    1. Baker D. J. et al. Clearance of p16Ink4a-positive senescent cells delays ageing-associated disorders. Nature 479, 232–236, doi:10.1038/nature10600 (2011). - DOI - PMC - PubMed
    1. Bussian T. J. et al. Clearance of senescent glial cells prevents tau-dependent pathology and cognitive decline. Nature 562, 578–582, doi:10.1038/s41586-018-0543-y (2018). - DOI - PMC - PubMed

Publication types