[Preprint]. 2023 Sep 27:rs.3.rs-3314138.
doi: 10.21203/rs.3.rs-3314138/v1.

Dual blockade of BRD4 and ATR/WEE1 pathways exploits ARID1A loss in clear cell ovarian cancer

Affiliations

Dual blockade of BRD4 and ATR/WEE1 pathways exploits ARID1A loss in clear cell ovarian cancer

Yasuto Kinose et al. Res Sq. .

Abstract

ARID1A, an epigenetic tumor suppressor, is the most common gene mutation in clear-cell ovarian cancers (CCOCs). CCOCs are often resistant to standard chemotherapy and lack effective therapies. We hypothesized that ARID1A loss would increase CCOC cell dependency on chromatin remodeling and DNA repair pathways for survival. We demonstrate that combining BRD4 inhibitor (BRD4i) with DNA damage response inhibitors (ATR or WEE1 inhibitors; e.g. BRD4i-ATRi) was synergistic at low doses leading to decreased survival, and colony formation in CCOC in an ARID1A dependent manner. BRD4i-ATRi caused significant tumor regression and increased overall survival in ARID1AMUT but not ARID1AWT patient-derived xenografts. Combination BRD4i-ATRi significantly increased γH2AX, and decreased RAD51 foci and BRCA1 expression, suggesting decreased ability to repair DNA double-strand-breaks (DSBs) by homologous-recombination in ARID1AMUT cells, and these effects were greater than monotherapies. These studies demonstrate BRD4i-ATRi is an effective treatment strategy that capitalizes on synthetic lethality with ARID1A loss in CCOC.

Keywords: ARID1A; ATR; BRD4; DNA damage response; WEE1; clear cell ovarian cancer.


Conflict of interest statement

Conflict of Interest F.S. serves on scientific advisory boards for AstraZeneca, GSK and Zentalis Pharmaceuticals. She has received institutional research funding from AstraZeneca, Repare Therapeutics, Instill Bio and Sierra Oncology. G.B.M. receives support or acts as a consultant for Amphista, Astex, AstraZeneca, BlueDot, Chrysallis Biotechnology, Ellipses Pharma, GSK, ImmunoMET, Infinity, Ionis, Leapfrog Bio, Lilly, Medacorp, Nanostring, Nuvectis, PDX Pharmaceuticals, Qureator, Roche, Rybodyne, Signalchem Lifesciences, Tarveda, Turbine, and Zentalis Pharmaceuticals has stock options with Bluedot, Biodyne, Catena Pharmaceuticals, ImmunoMet, Nuvectis, RyboDyne, SignalChem, Tarveda, and Turbine, has transferred technology to Myriad and Nanostring and receives sponsored research support from AstraZeneca Nanostring and Zentalis. E.J.B. serves on the scientific advisory board of Atrin Pharmaceuticals and has been an advisor for Sierra Oncology. R.D. serves on the scientific advisory board of Repare Therapeutics and Siamab Therapeutics and advises Mersana Therapeutics and nVision Medical.

Figures

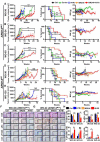
Figure 1.
Figure 1.. Combination inhibition of BRD4 and DNA damage response are synergistic in inhibiting ovarian cancer depending on ARID1A mutation status.
(A) Western blot detection of ARID1A expression in gynecologic cancer lines. (B-C) Cell viability detection of BRD4i-ATRi combination at the indicated doses in ARID1AMUT (B) and ARID1AWT (C) cell lines. Cells were treated with monotherapy or drugs combination for 5 days (n = 3–6; mean ± SD). The dosage combination with best synergy (BRD4i: 0.1µM, ATRi 1µM) was highlighted in Red. (D) Comparison of BRD4i-ATRi synergy in ARID1AMUT and ARID1AWT cells by plotting coefficient of drug interaction (CDI) and cell fraction affected (FA) at the dosage of BRD4i: 0.1µM and ATRi 1µM. ARID1AMUT cells were circled in blue. CDI<1 indicates synergy and CDI<0.7 indicates significant synergy. (E-F) Cell viability detection of BETi-WEE1i combination at the indicated doses in ARID1AMUT (E) and ARID1AWT (F) cell lines (n = 3–6; mean ± SD) 5 days post treatment. (G) CDI and FA were plotted for BRD4i-WEE1i combination. ARID1AMUT cells were circled in blue. (H) Colony formation analysis of BRD4i-ATRi combination (left) and BRD4i-WEE1i combination (right) after 14 days drugs treatment. TOV21G, JHOC-9, OVISE, ES-2, OVKATE, and OVCAR-8 cells: ATRi (Ai) 0.1 μM + BRD4i 0.05 μM or WEE1i (Wi) 0.1 μM + BRD4i (Bi) 0.05 μM; OVMANA and OVTOKO: ATRi 0.1 μM + BRD4i 0.01 μM or WEE1i 0.1 μM + BRD4i 0.01 μM; WO-24: ATRi 0.1 μM + BRD4i 0.005 μM or WEE1i 0.1 μM + BRD4i 0.005 μM. (I) Quantification of CFA with ImageJ and the mean value were used to calculate CDI and FA.
Figure 2.
Figure 2.. Loss of ARID1A sensitizes BRD4i-DDRi combinations and ARID1A restoration decreases the sensitivity.
(A) Cell viability detection of BRD4i-ATRi and BRD4i-WEE1i combinations or monotherapy in OVKATE cells with/without ARID1A knockdown. OVKATE cells were transfected with Negative control siRNA (siNeg) or ARID1A siRNA for 24 hours and then treated with drugs for 5 days, WEE1i (0.25 µM), ATRi (0.5 µM), BRD4i (0.5 µM) monotherapy or combinations (n=3, mean+SEM). ARID1A knocking down efficacy were measured 24hours post siRNAs transfection by Western blot. (B) Cell viability detection of drugs combination in HCT116 WT and paired ARID1AKO cells. Cells were treated with WEE1i (0.25 µM), ATRi (0.5 µM), BRD4i (0.1 µM) monotherapy or combination for 5 days (n=3, mean+SEM). ARID1A protein expression was measured by western blot in both cells. (C) Inhibitory efficacy of BRD4i-ATRi was tested in OVCA429 and paired OVCA429 ARID1AKO cells. The cells were treated with ATRi (0.5 µM), BRD4i (0.1 µM) or combination for 5 days. The ARID1A protein was detected by western blot. (D) Colony formation analysis of BRD4i-WEE1i and BRD4i-ATRi combinations in HCT116 WT and paired ARID1AKO cells. WEE1i 0.25 μM, BRD4i 0.1 μM for BRD4i-WEE1i combination or ATRi 0.5 μM, BRD4i 0.05 μM for BRD4i-ATRi combination. (E) Detection of drugs combination by MTT assay in HEC1A ARID1A inducible cells with/without ARID1A induction. Cells with or without 1 µg/ml doxycyclin treatment for 2 days were measured for ARID1A level by western blot. WEE1i (0.1 µM), ATRi (0.1 µM), BRD4i (0.1 µM). (n=3, mean+SEM). (F) Colony formation of HEC1A ARID1A inducible cells with/without ARID1A protein induction after drugs treatments for 10 days. WEE1i 0.2 μM, BRD4i 0.05 μM for BRD4i-WEE1i, ATRi 0.2 μM, BRD4i 0.02 μM for BRD4i-ATRi.
Figure 3.
Figure 3.. Characterization of clear cell ovarian cancer PDX models.
(A) Clinical and genomic profile of clear cell ovarian cancer patient tumor tissues and PDX models. (B) Immunohistochemistry analysis of primary patient tumors, PDXs at different mouse passages (MP) were stained with anti-PAX8, anti-ARID1A, anti-NapsinA, or anti-Racemase antibody. H&E as presented to show tumor cells morphology. Images with 200X amplification and 400X (inlay) were shown.
Figure 4.
Figure 4.. BRD4i-ATRi combination therapy is more effective than monotherapy alone in ARID1A mutated PDX models, but not in an ARID1A wild type models.
(A-E) Tumor growth rate and survival curve were presented to compare BRD4i-ATRi combination with monotherapy in ARID1AWT CCOC WO-38 (A), WO-24 (B), WO-93 (C) and ARID1AMUT CCOC WO-30 (D), WO-120 (E). Mice were randomized to eight treatment groups once tumor volume reached 60 to 100 mm3. For treatment dosages: Control (vehicle), carboplatin (20 mg/kg for WO-38, WO-30, WO-120 and 30 mg/kg for WO-24, WO-93, weekly by intraperitoneal injection), ATRi (AZD6738 40 mg/kg, 5 days per week by oral gavage), BRD4i (AZD5153 1.0–1.5 mg/kg × 5 days per week by oral gavage except WO-24 and WO-93 for 7 days per week), ATRi + BRD4i (AZD5153 1.0–1.5 mg/kg × 5 days per week by oral gavage except WO-24 and WO-93 for 7 days per week; AZD6738 40 mg/kg × 5 days per week except WO-30 for 30 mg/kg). (F-H) H&E staining and immunohistochemistry detection of Ki67, p-Rb, gH2AX, and cleaved caspase 3 in WO-38 (F) and WO-24 (G) PDX tissues. The percentage of positive cells were quantification by image J (H).
Figure 5.
Figure 5.. BRD4i-ATRi combination induced G1 cell cycle arrest in cells with ARID1A loss.
(A) Analysis of pathways impacted by BRD4i-ATRi treatment in HCT116 WT and HCT116 ARID1AKO cells. HCT116 WT and HCT116 ARID1AKO cells were treated with BRD4i 0.1 µM, ATRi 0.1 µM or combination for 12 hours and the transcriptome was detected by RNA sequence. Data was analyzed and heatmap was generated in R software. (B) Analysis of cell cycle phases related genes expression alteration by BRD4i-ATRi treatment. (C) Analysis of the genes involved in cell cycle checkpoints affected by BRD4i-ATRi treatment. Red arrow points at the p27, which is upregulated by BRD4i-ATRi in HCT116 ARID1AKO cells. (D) Proteomic analysis of HCT116 WT and HCT116 ARID1AKO cells by RPPA. The cells are treated with Control, ATRi 0.1 µM (Ai), BRD4i 0.1 µM (Bi), or combination for 6, 24, 48 hours. In the RPPA analysis, the samples were probed with 445 antibodies to show the relative expression level of the proteins. The quantified data was normalized by each Control, and Ai+Bi/Ai and Ai+Bi/Bi are calculated by each time point. The ratios of HCT116 WT/HCT116 ARID1AKO are made and the data are sorted by Ai+Bi/Ai for 24 hours. Heatmap is created by Closter 3.0 and TreeView3 software. The heatmaps show change in cell cycle-related genes. Black arrow points to pRB expression, which is significantly decreased by BRD4i-ATRi combination in HCT116 ARID1AKO cells comparing to HCT116 WT cells. (E) Cell cycle analysis of drugs effect in TOV21G (ARID1AMUT), OVKATE (ARID1AWT), HCT116 ARID1AKO, and HCT116 WT cells. Cells were treated with Control, ATRi 0.1 µM, BRD4i 0.1 µM or combination for 8 or 16 hours. Cells were pretreated with BrdU (10 µM) treatment for 2 hours before collection. % G0/G1 cells (Upper) at 8 or 16 hours and Cell cycle distribution (Lower) at 16 hours post treatment were presented. Data was shown as mean+SEM. (F) Detection of p27 (Upper), p-Rb (middle), and p-Cdc6 (Bottom) in indicated cells by western blot. Cells were treated with ATRi 0.1 µM (Ai), BRD4i 0.1 µM (Bi) or combination for 24 hours in samples for p27 and p-Rb detection. For p-Cdc6 detection, cells were treated with Control, ATRi 0.5 µM (Ai), BRD4i 0.5 µM (Bi), or ATRi 0.5 µM + BRD4i 0.5 µM (Ai+Bi) for 24 hours. β-actin was used as internal control. Total Rb protein and total Cdc6 protein were included as control.
Figure 6.
Figure 6.. BRD4i-ATRi combination therapy reduced homologous recombination, induced DNA damage, and led to cell apoptosis in ARID1A mutant CCOC.
(A) Measurement of Homologous recombination by detecting RAD51 foci formation. HCT116 WT and HCT116 ARID1AKO cells were treated with 0.1 µM BRD4i and 1 µM ATRi for 6 hours. Zeocin was added during 6 hours drug treatment. Immunofluorescence staining of RAD51 and Gemini was performed. RAD51 foci number in Gemini positive cells were counted and plotted. Individual data points and median ± SEM were shown. (B) Detection of gH2AX positive cells by flow cytometry. TOV21G (ARID1AMUT), OVKATE (ARID1AWT), HCT116 ARID1AKO, or HCT116 WT cells were treated with Control, ATRi (0.25 µM), BRD4i (0.25 µM) or combination for 24 hours before gH2AX (Ser139) staining. Data are shown as mean+SEM. (C) Detection of cell apoptosis in ARID1A mutant (TOV21G and OVMANA), ARID1A WT (ES-2 and OVKATE) and HCT116 ARID1AKO, HCT116 WT cells. TOV21G and OVMANA, ES-2 and OVKATE cells were treated with 0.1 µM ATRi, 0.1 µM BRD4i or combination for 5 days. HCT116 ARID1AKO and HCT116 WT were treated with ATRi (0.5 µM), BRD4i (0.1 µM) or combination for 5 days. Graph bars show mean+SEM. (D) Western blot detection of apoptotic protein markers in ARID1A mutant and WT cells. The cells were treated with ATRi (Ai, 0.5 µM), BRD4i (Bi, 0.5 µM) or combination for 24 hours.
Figure 7.
Figure 7.. Schematical diagram of BRD4i-ATRi mechanism of function.
(A) In ARID1A wild type CCOC cells, BRD4i has minimal effect in decreasing BRCA1 expression and RAD51 loading, ATRi has limited effect in inducing replication stress. These lead to minimal effect of BRD4i-ATRi combination in inducing cell apoptosis. (B) In ARID1A mutant CCOC, inhibition of BRD4 decreases BRCA1 transcription, prevents RAD51 loading, leading to lack of homologous recombination and increasing DNA double strand (DS) break. ATRi inhibits CHK1 and activates CDK1 activation, resulting in loss of G2/M checkpoint, and also ATRi increased replication stress and DS break. Combination of BRD4i-ATRi significantly induced DNA damage and cell apoptosis.

References

    1. Karst A. M. & Drapkin R. Ovarian cancer pathogenesis: a model in evolution. J Oncol 2010, 932371, doi: 10.1155/2010/932371 (2010). - DOI - PMC - PubMed
    1. Fujiwara K., Shintani D. & Nishikawa T. Clear-cell carcinoma of the ovary. Ann Oncol 27 Suppl 1, i50–i52, doi: 10.1093/annonc/mdw086 (2016). - DOI - PubMed
    1. Oliver K. E. et al. An evaluation of progression free survival and overall survival of ovarian cancer patients with clear cell carcinoma versus serous carcinoma treated with platinum therapy: An NRG Oncology/Gynecologic Oncology Group experience. Gynecol Oncol 147, 243–249, doi: 10.1016/j.ygyno.2017.08.004 (2017). - DOI - PMC - PubMed
    1. Chan J. K. et al. Do clear cell ovarian carcinomas have poorer prognosis compared to other epithelial cell types? A study of 1411 clear cell ovarian cancers. Gynecol Oncol 109, 370–376, doi: 10.1016/j.ygyno.2008.02.006 (2008). - DOI - PubMed
    1. Sugiyama T. et al. Clinical characteristics of clear cell carcinoma of the ovary: a distinct histologic type with poor prognosis and resistance to platinum-based chemotherapy. Cancer 88, 2584–2589 (2000). - PubMed

Publication types