

Envelope method with ignorable missing data
- PMID: 37842008
- PMCID: PMC10571183
- DOI: 10.1214/21-ejs1881
Envelope method with ignorable missing data
Abstract
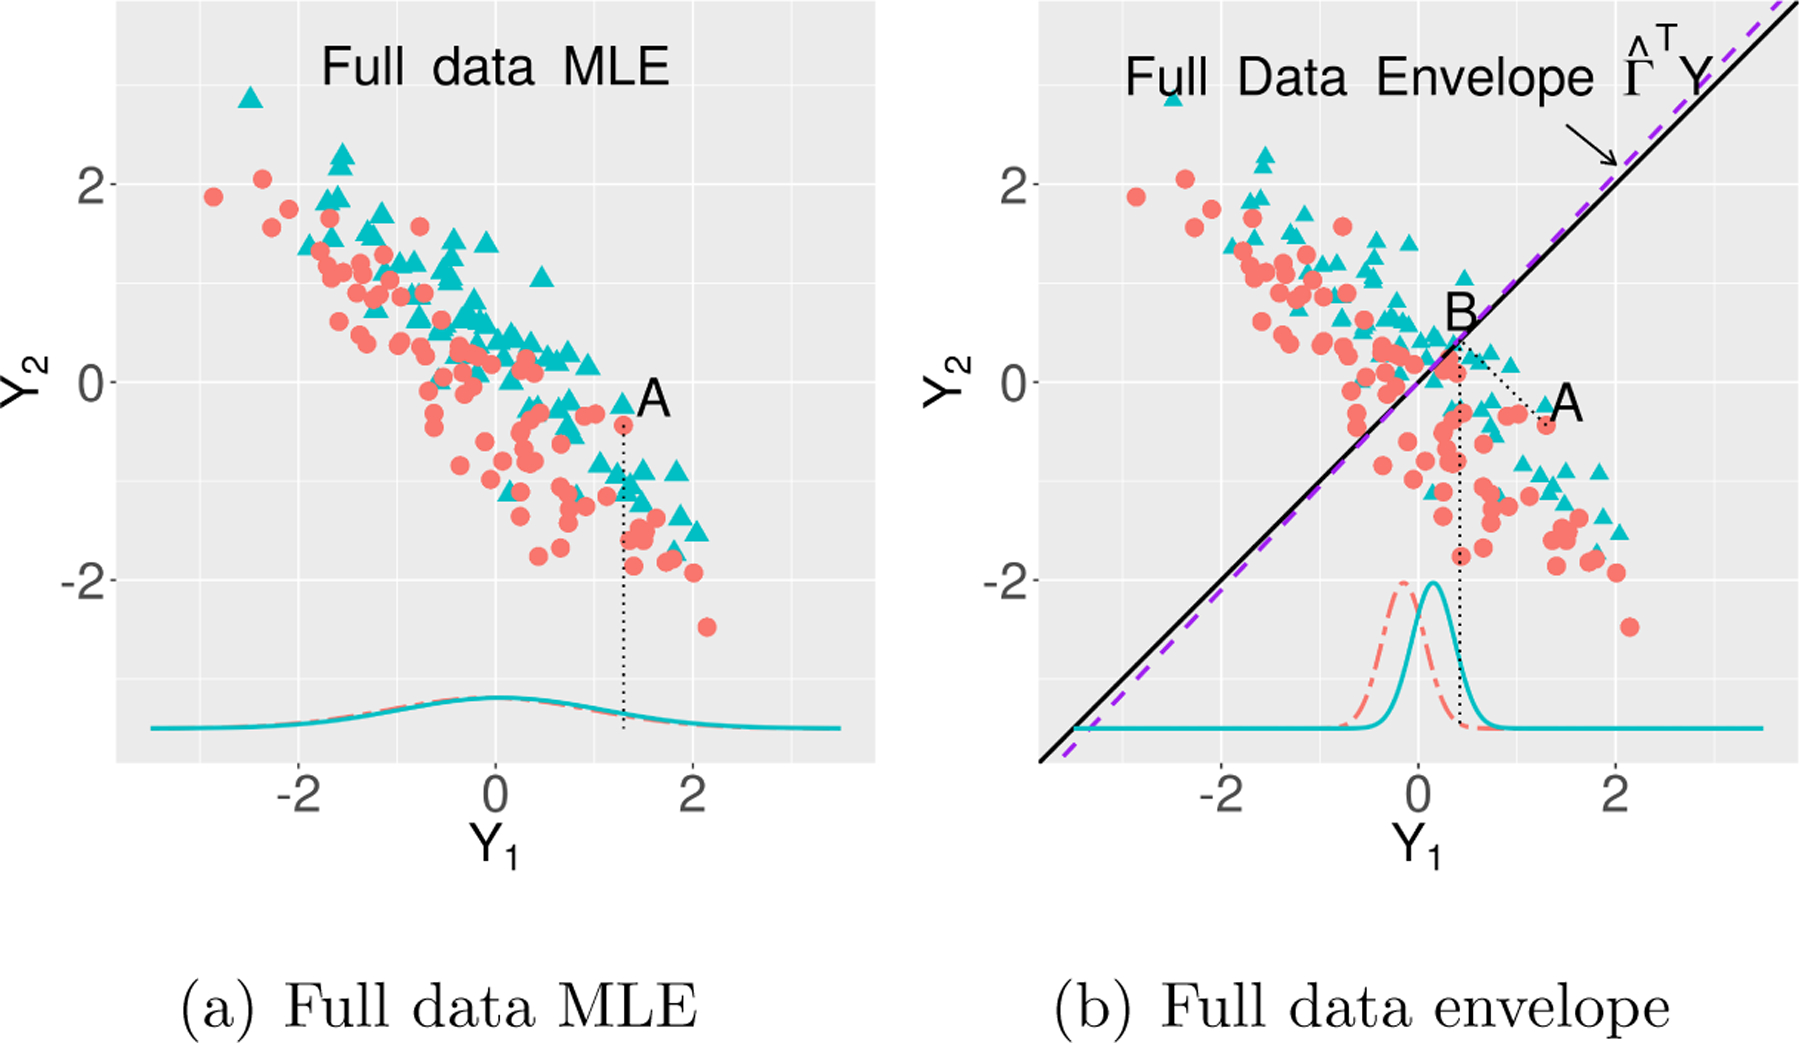
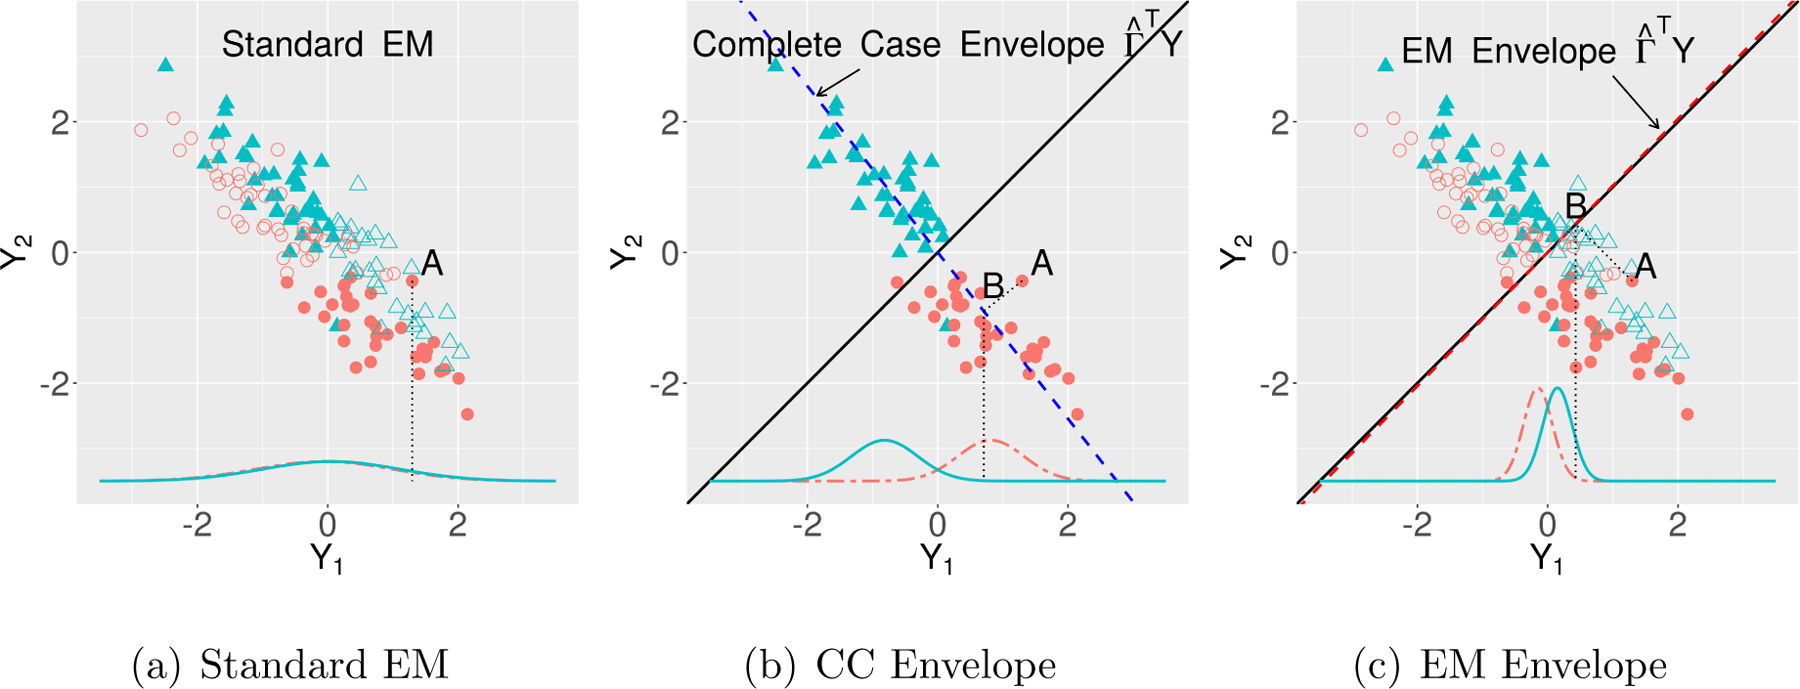
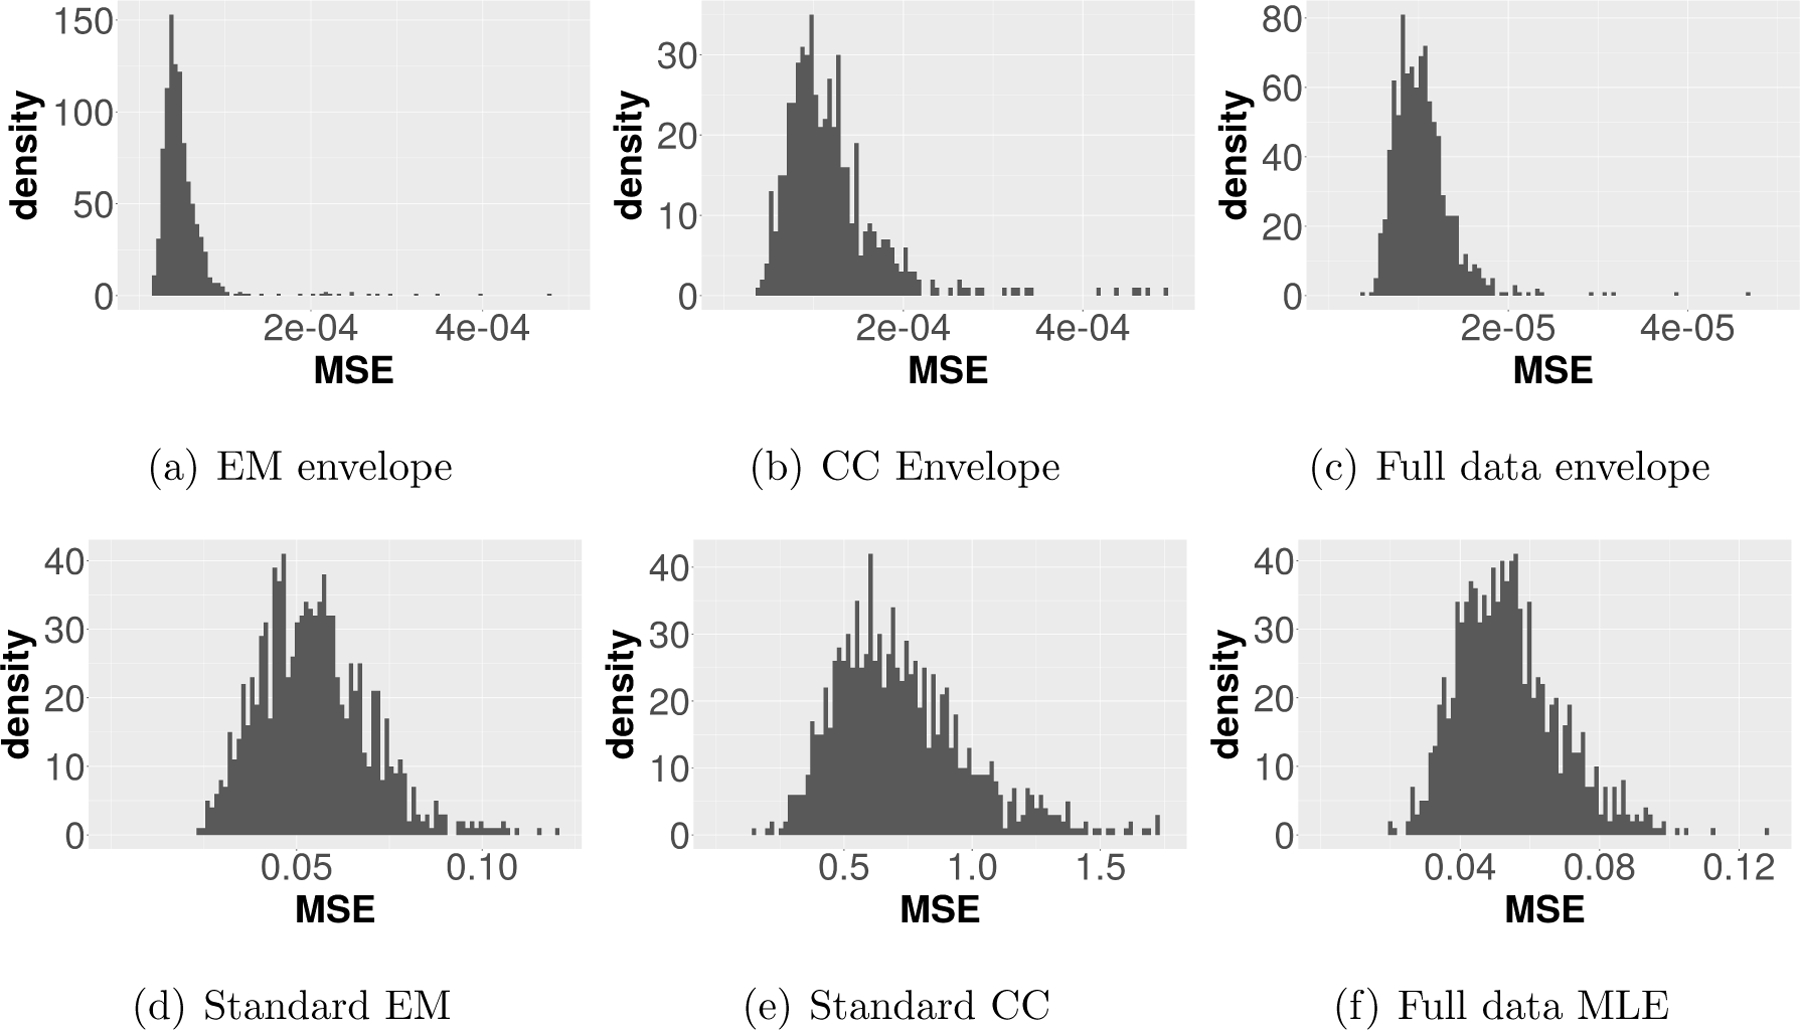
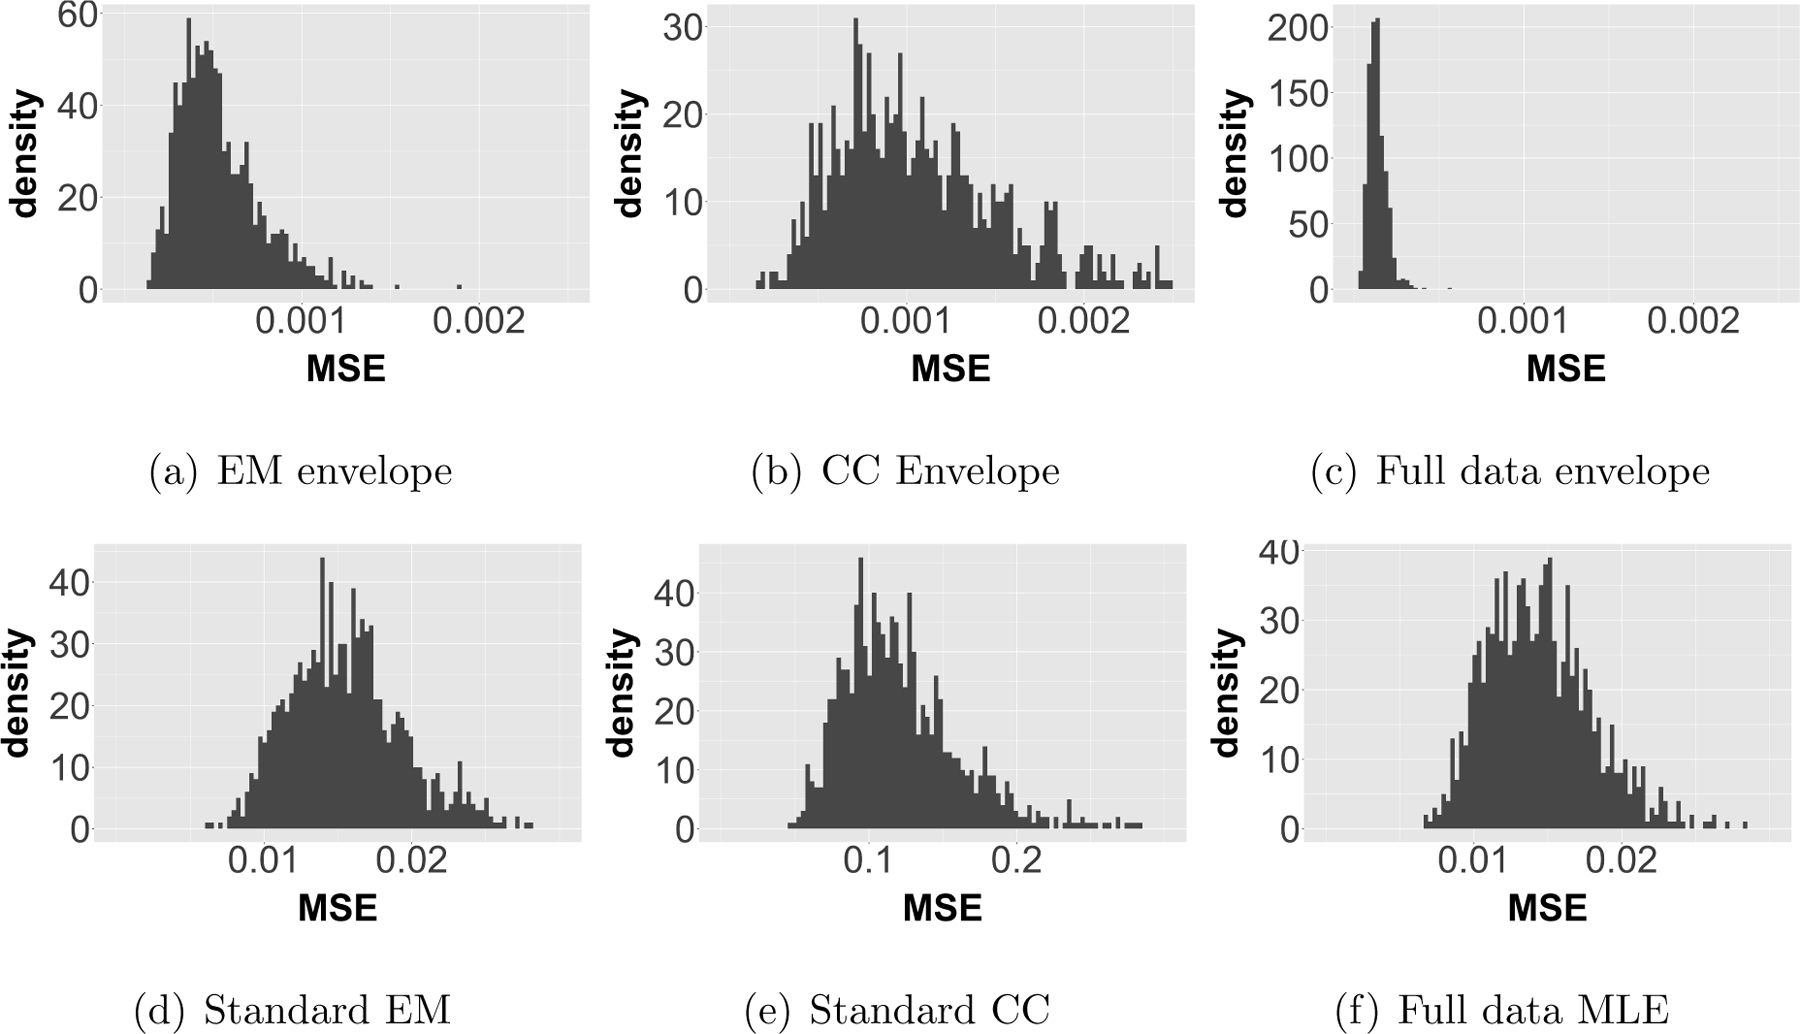
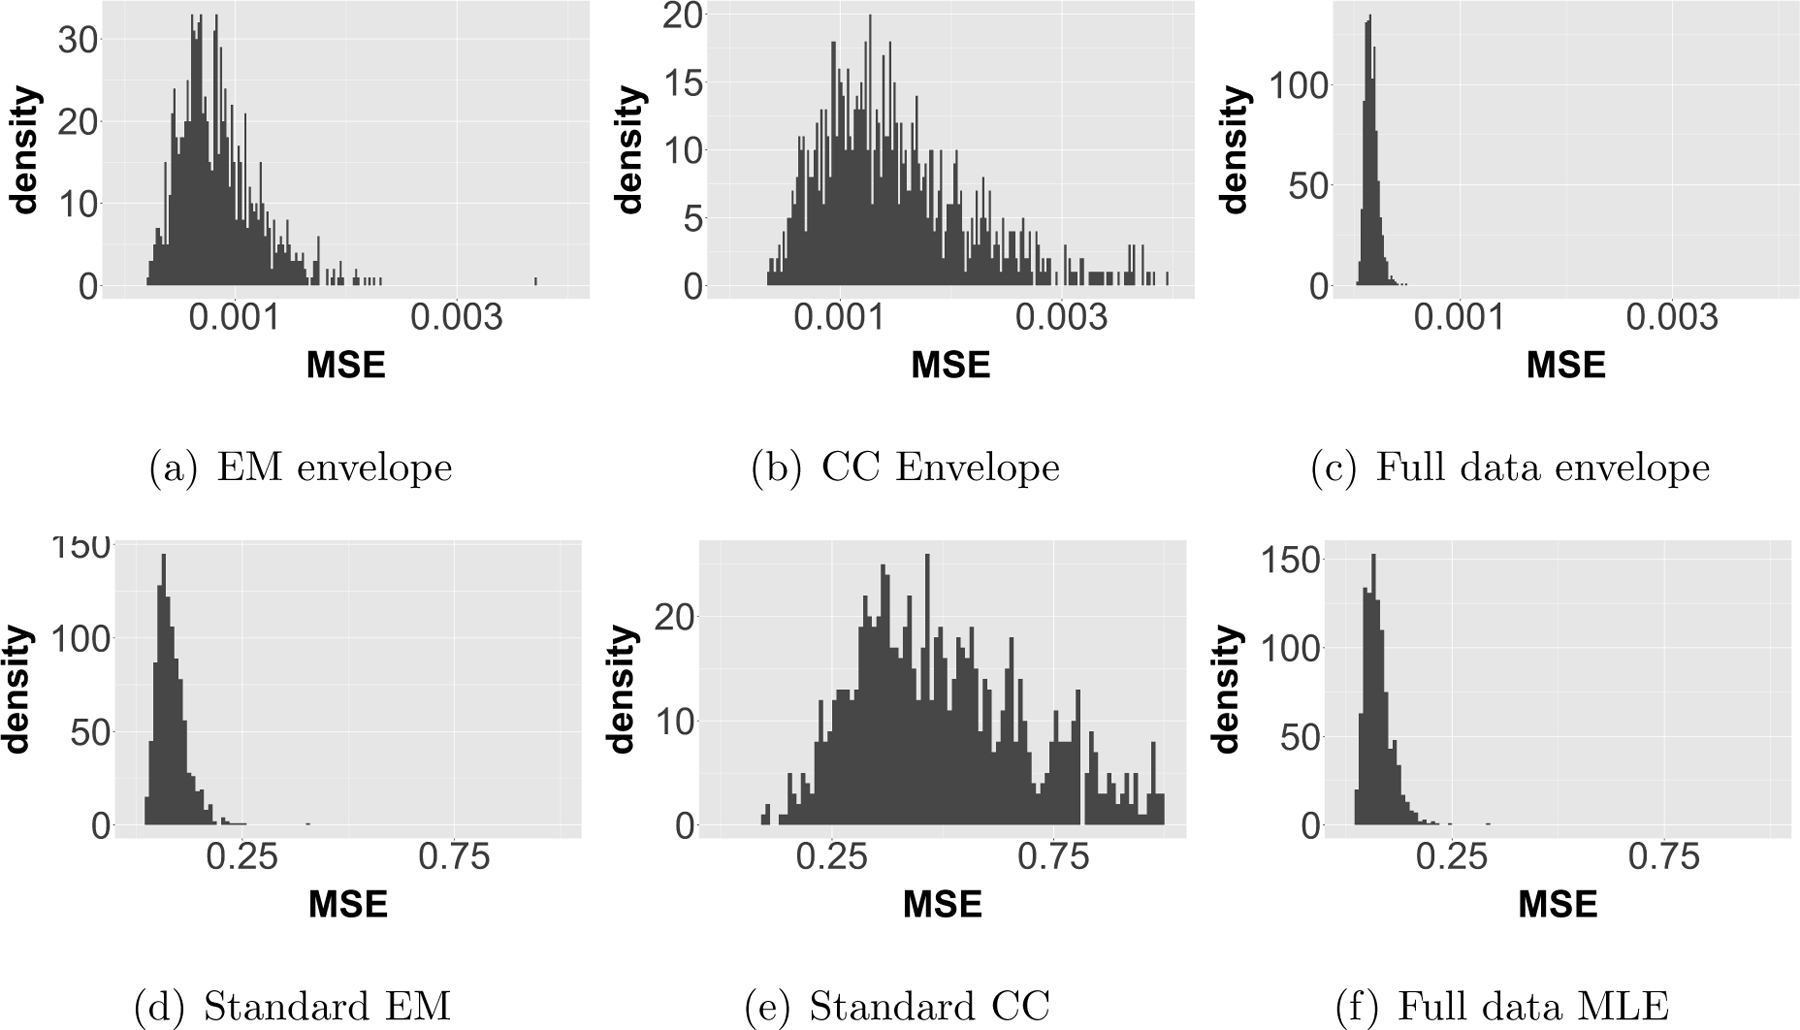
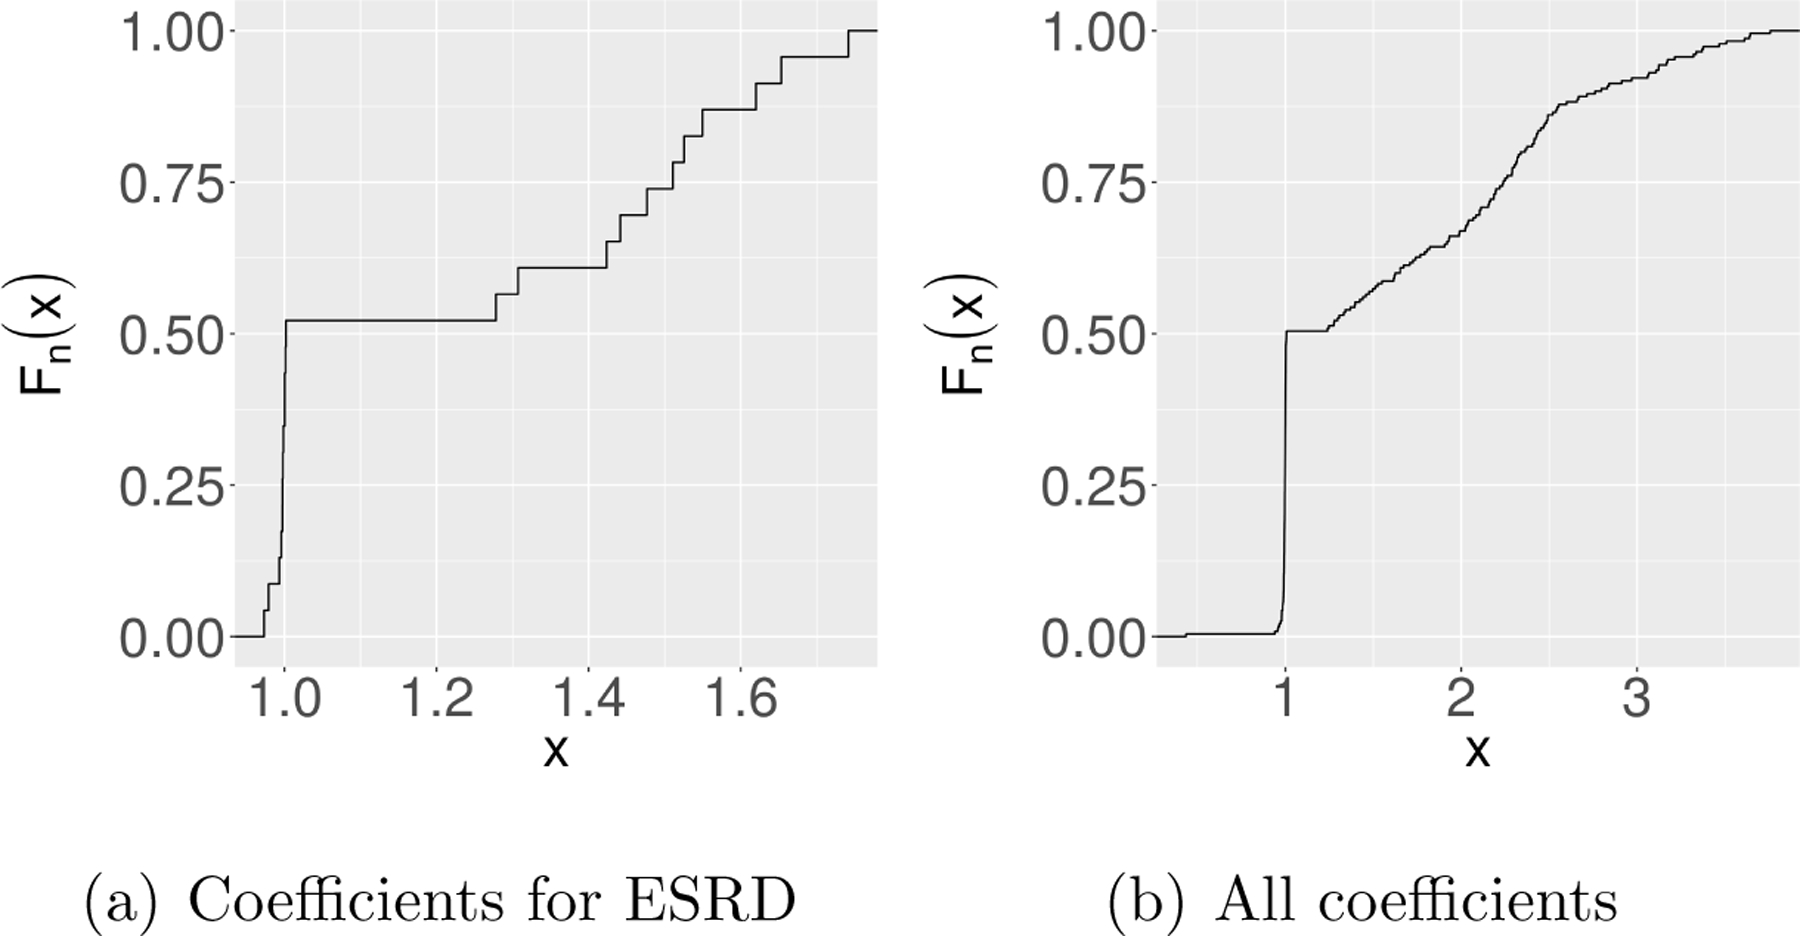
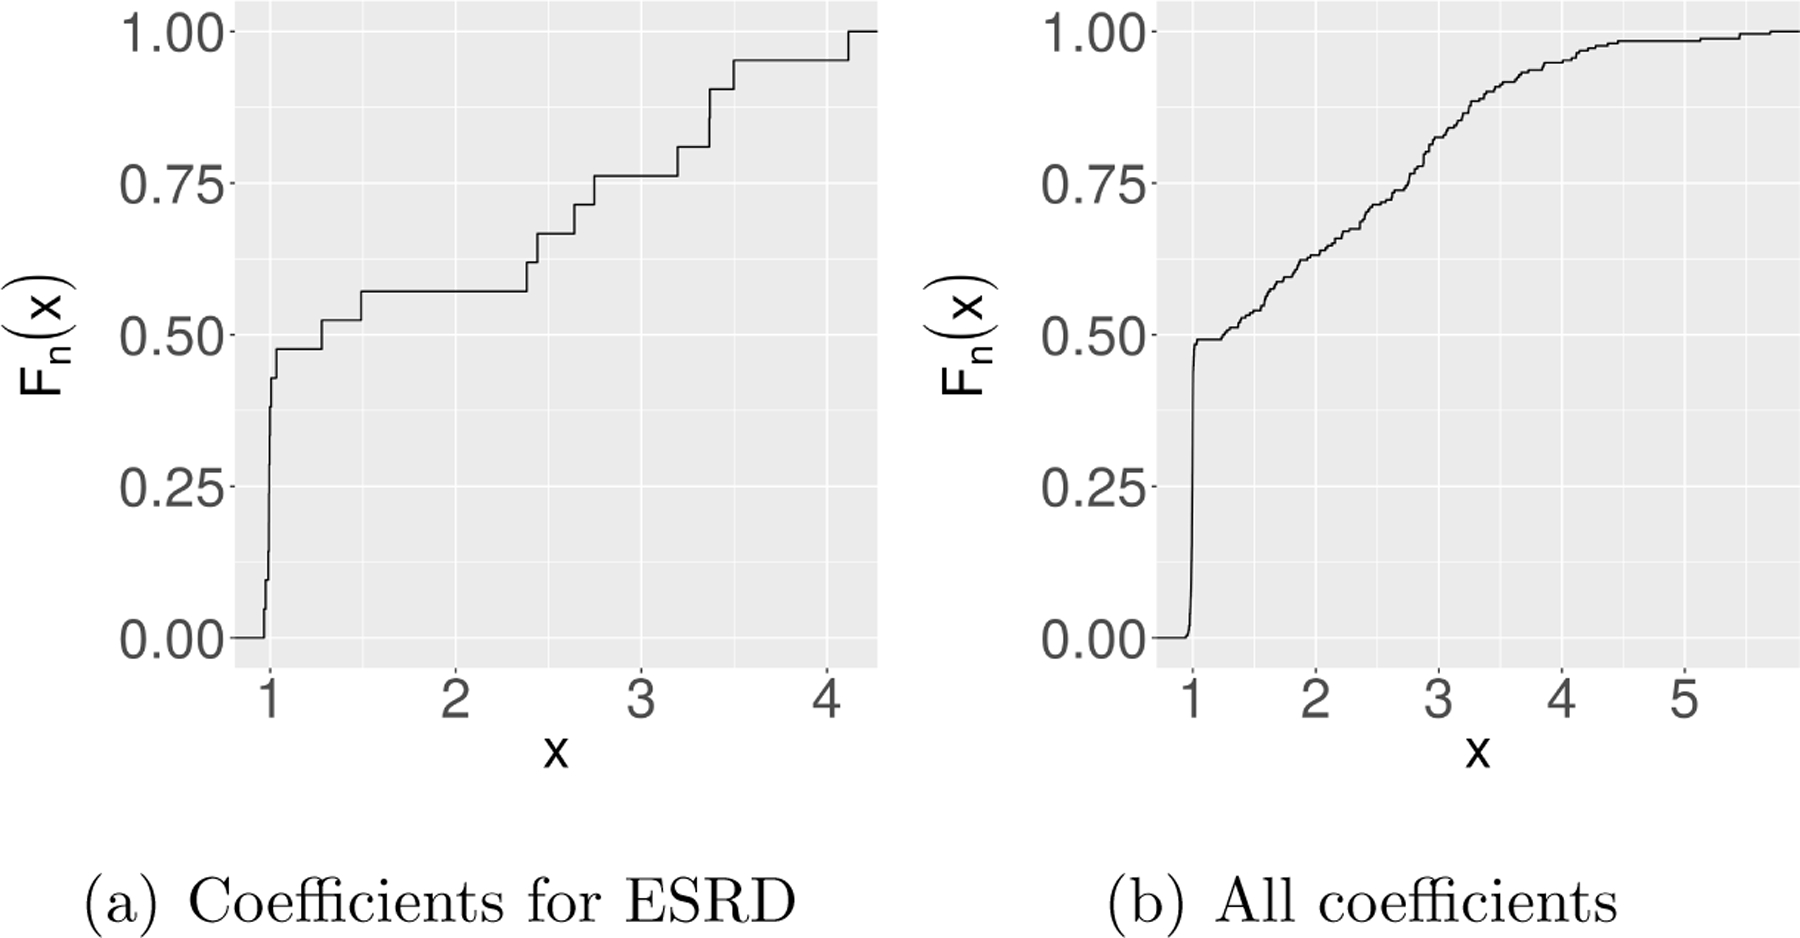
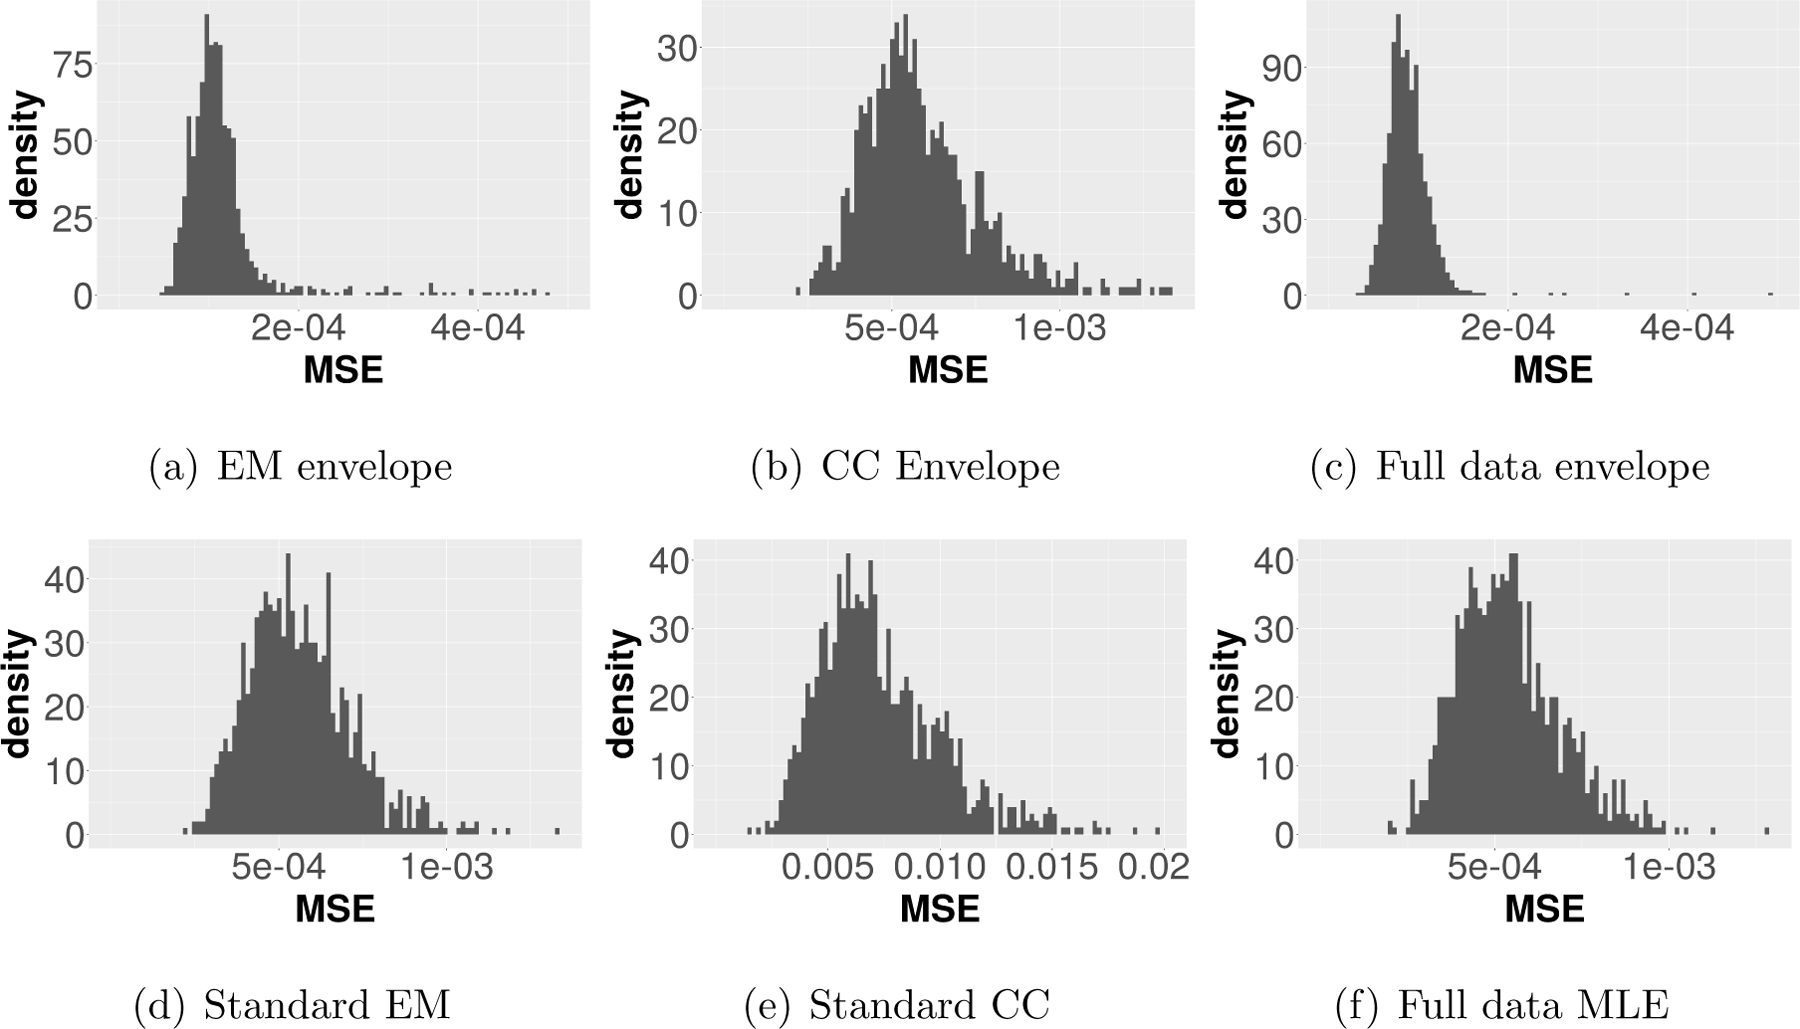
Envelope method was recently proposed as a method to reduce the dimension of responses in multivariate regressions. However, when there exists missing data, the envelope method using the complete case observations may lead to biased and inefficient results. In this paper, we generalize the envelope estimation when the predictors and/or the responses are missing at random. Specifically, we incorporate the envelope structure in the expectation-maximization (EM) algorithm. As the parameters under the envelope method are not pointwise identifiable, the EM algorithm for the envelope method was not straightforward and requires a special decomposition. Our method is guaranteed to be more efficient, or at least as efficient as, the standard EM algorithm. Moreover, our method has the potential to outperform the full data MLE. We give asymptotic properties of our method under both normal and non-normal cases. The efficiency gain over the standard EM is confirmed in simulation studies and in an application to the Chronic Renal Insufficiency Cohort (CRIC) study.
Keywords: EM-algorithm; Efficiency gain; Missing data; Multivariate regression; Sufficient dimension reduction.
Figures
Similar articles
-
A penalized EM algorithm incorporating missing data mechanism for Gaussian parameter estimation.Biometrics. 2014 Jun;70(2):312-22. doi: 10.1111/biom.12149. Epub 2014 Jan 28. Biometrics. 2014. PMID: 24471933 Free PMC article.
-
Missing Data Methods for Partial Correlations.J Biom Biostat. 2012 Dec;3(8):155. doi: 10.4172/2155-6180.1000155. J Biom Biostat. 2012. PMID: 24040575 Free PMC article.
-
Empirical likelihood method for non-ignorable missing data problems.Lifetime Data Anal. 2017 Jan;23(1):113-135. doi: 10.1007/s10985-016-9381-0. Epub 2016 Sep 19. Lifetime Data Anal. 2017. PMID: 27647436
-
On the Expectation-Maximization Algorithm for Rice-Rayleigh Mixtures With Application to Noise Parameter Estimation in Magnitude MR Datasets.Sankhya B (2008). 2013 Nov;75(2):293-318. doi: 10.1007/s13571-012-0055-y. Epub 2013 Jan 22. Sankhya B (2008). 2013. PMID: 29757335 Free PMC article.
-
[Analysis of longitudinal Gaussian data with missing data on the response variable].Rev Epidemiol Sante Publique. 1999 Dec;47(6):525-34. Rev Epidemiol Sante Publique. 1999. PMID: 10673586 French.
References
-
- Breiman L and Friedman JH (1997). Predicting multivariate responses in multiple linear regression. Journal of the Royal Statistical Society: Series B (Statistical Methodology), 59:3–54.
-
- Capuano V, Bambacaro A, D’Arminio T, Vecchio G, and Cappuccio L (2003). Correlation between body mass index and others risk factors for cardiovascular disease in women compared with men. Monaldi Archives for Chest Disease, 60:295–300. - PubMed
Grants and funding
LinkOut - more resources
Full Text Sources
Research Materials