. 2023 Sep:203:193-206.
doi: 10.1016/j.anbehav.2023.05.001. Epub 2023 Jul 12.

Sex differences in vocal learning ability in songbirds are linked with differences in flexible rhythm pattern perception

Affiliations

Sex differences in vocal learning ability in songbirds are linked with differences in flexible rhythm pattern perception

Andrew A Rouse et al. Anim Behav. 2023 Sep.

Abstract

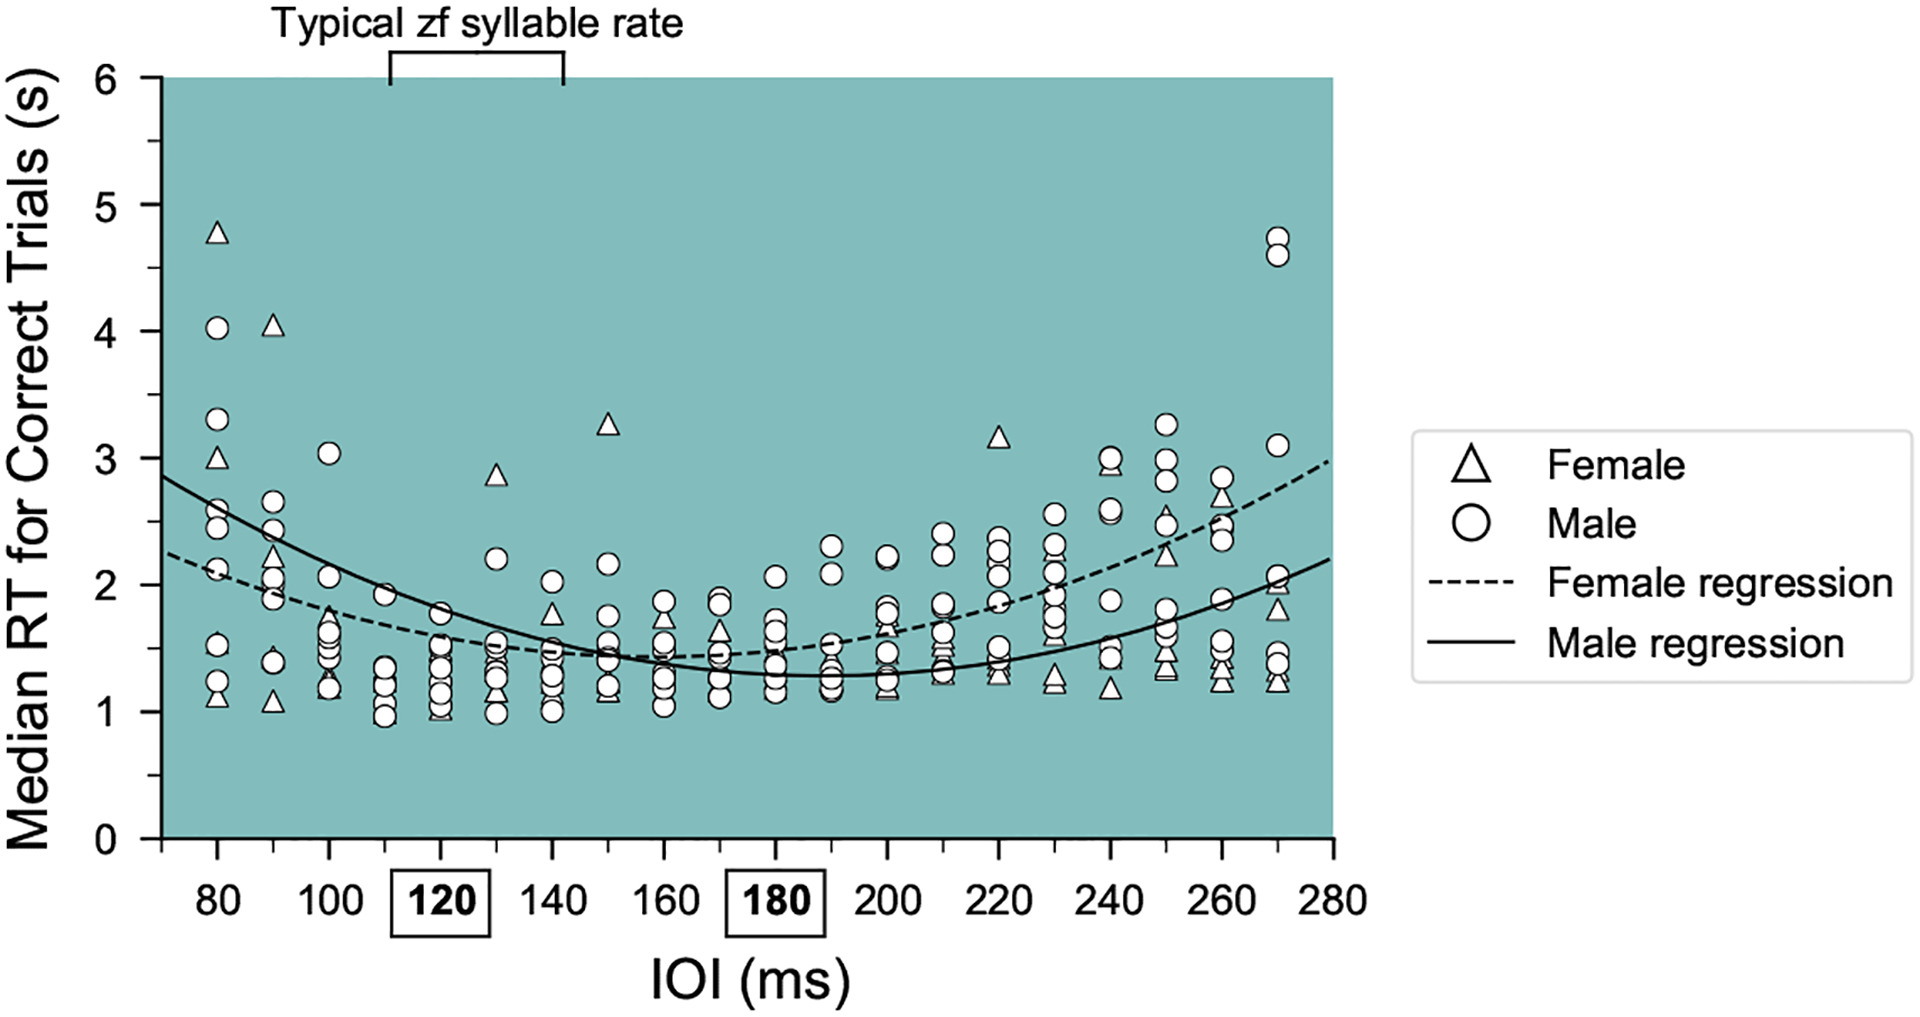
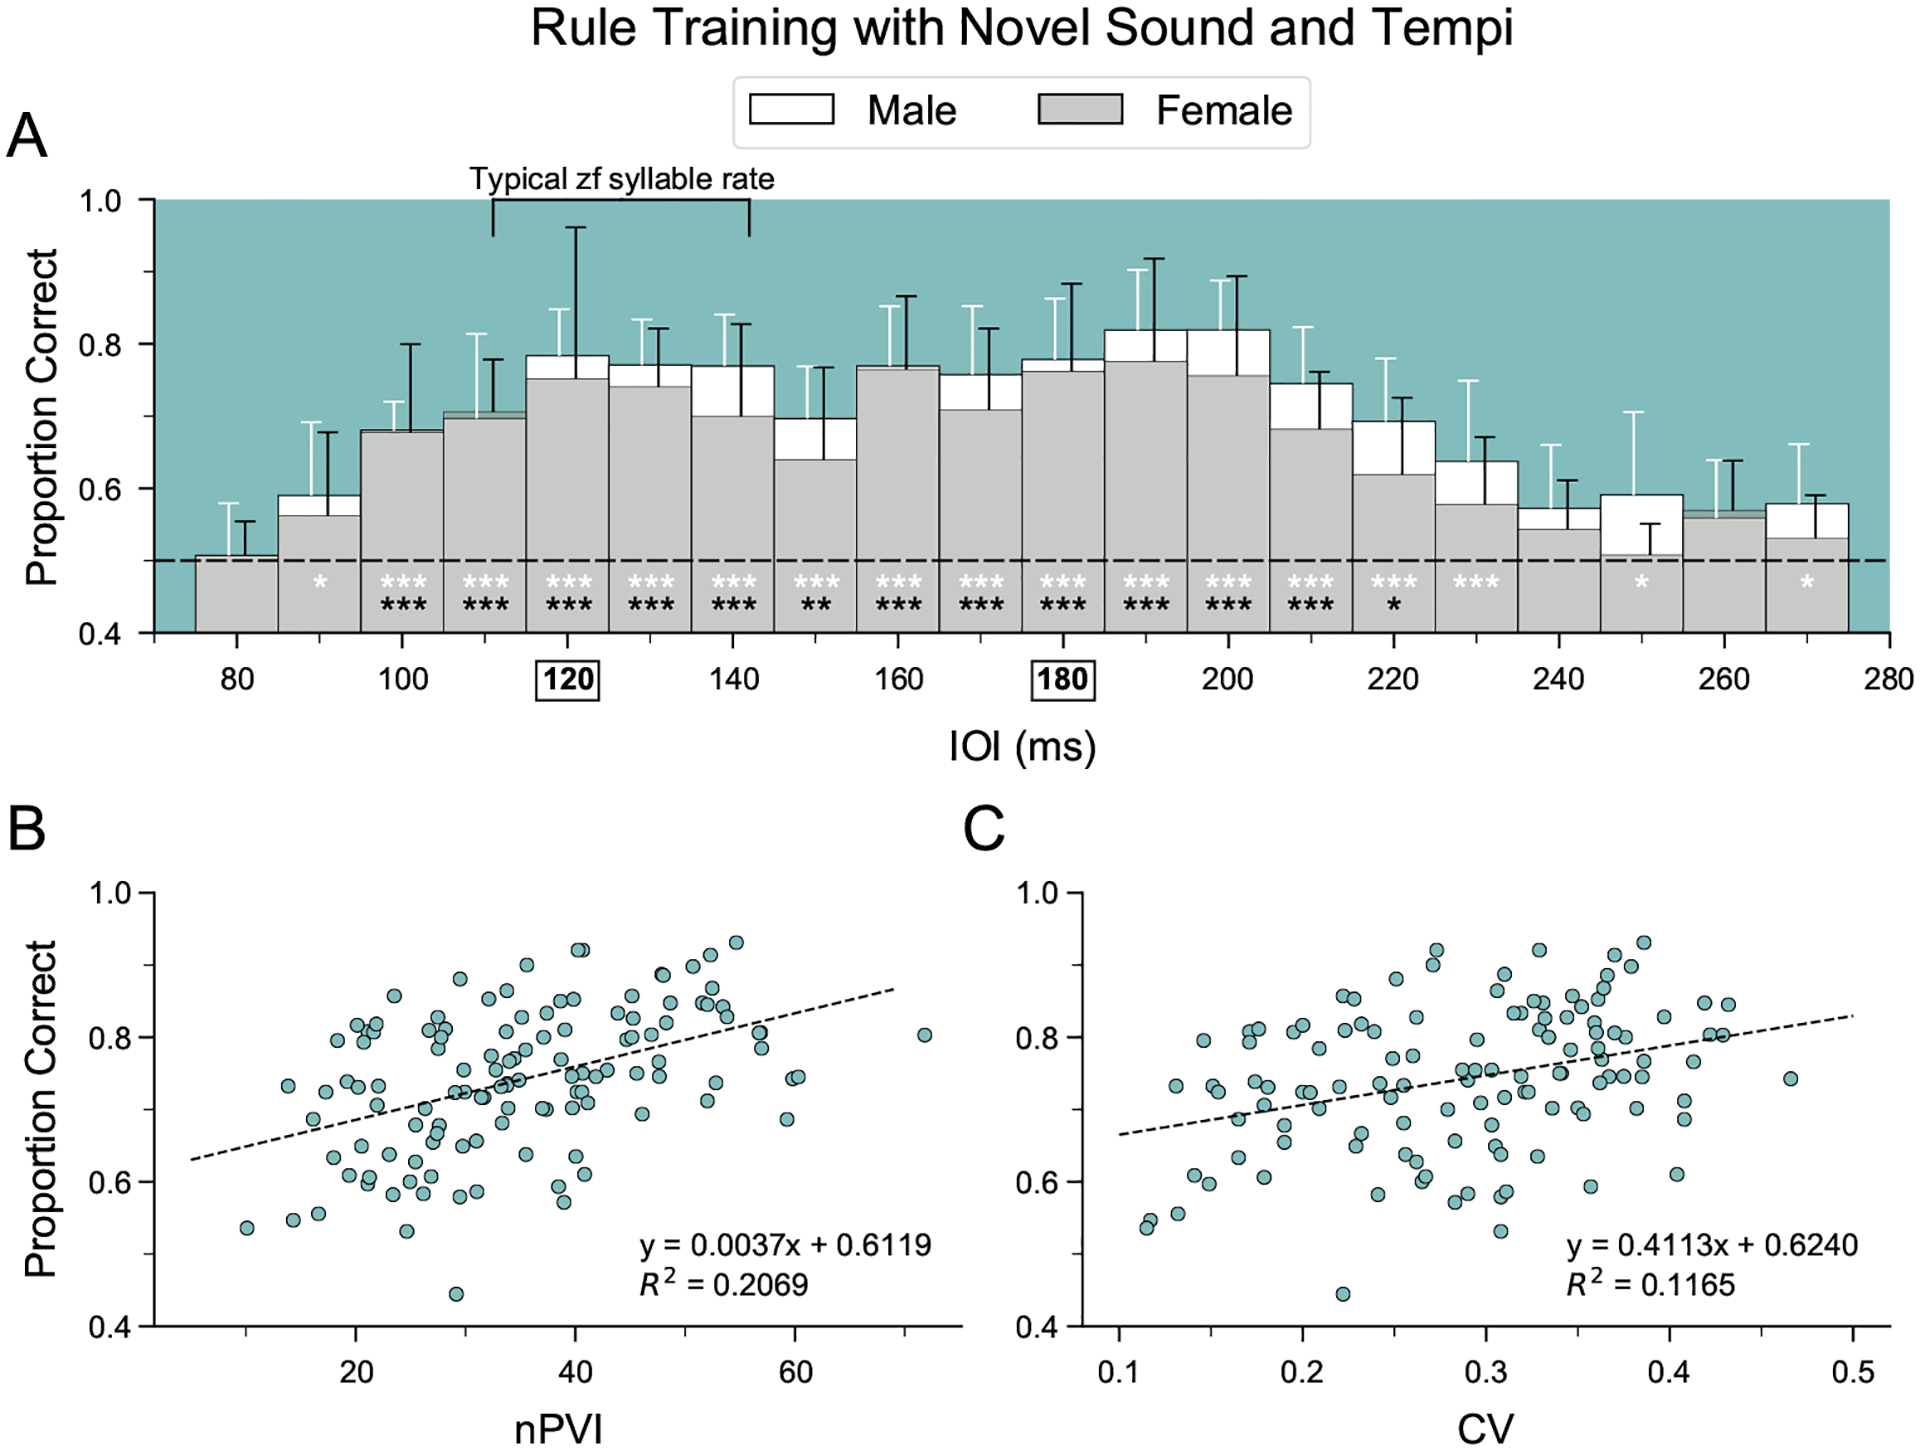
Humans readily recognize familiar rhythmic patterns, such as isochrony (equal timing between events) across a wide range of rates. This reflects a facility with perceiving the relative timing of events, not just absolute interval durations. Several lines of evidence suggest this ability is supported by precise temporal predictions arising from forebrain auditory-motor interactions. We have shown previously that male zebra finches, Taeniopygia guttata, which possess specialized auditory-motor networks and communicate with rhythmically patterned sequences, share our ability to flexibly recognize isochrony across rates. To test the hypothesis that flexible rhythm pattern perception is linked to vocal learning, we ask whether female zebra finches, which do not learn to sing, can also recognize global temporal patterns. We find that females can flexibly recognize isochrony across a wide range of rates but perform slightly worse than males on average. These findings are consistent with recent work showing that while females have reduced forebrain song regions, the overall network connectivity of vocal premotor regions is similar to males and may support predictions of upcoming events. Comparative studies of male and female songbirds thus offer an opportunity to study how individual differences in auditory-motor connectivity influence perception of relative timing, a hallmark of human music perception.

Keywords: auditory perception; auditory–motor interaction; comparative cognition; isochrony; sensorimotor circuit; zebra finch.


Conflict of interest statement

Declaration of Interest None.

Figures

Figure A1.
Figure A1.
Stimulus waveforms, spectrograms and coefficients of variation (CVs). (a) Normalized amplitude waveforms and spectrograms of the four song elements used in stimulus creation (sound A: 79.9 ms; sound B: 51.5 ms; sound C: 63.1 ms; sound D: 74.7 ms). (b) CV of inter-onset interval (IOI) for all arrhythmic stimuli against mean stimulus IOI. Note that as the average IOI approaches the length of the source sound element, IOI variability approaches 0. Sound files are available at https://dx.doi.org/10.17632/fw5f2vrf4k.2
Figure A2.
Figure A2.
Learning curves for discrimination of stimuli based on rhythmic pattern, tempo or frequency. (a) Learning curves for seven female birds that successfully discriminated isochronous versus arrhythmic stimuli within 30 days for each sound type. (b) Learning curves for a separate cohort of females (N = 6) trained to discriminate isochronous sequences of sound A that differed in tempo (120 ms IOI versus 144 ms IOI) or frequency-shifted isochronous sequences of sound B (shifted up 3 semitones versus 6 semitones). All females tested met the criterion for discriminating stimuli based on tempo or frequency.
Figure A3.
Figure A3.
Comparison of generalization of rhythm discrimination by sex. Mean d′ values for all successful males (N = 7) and females (N = 7) during the last 500 trials of the first training phase and for probe and interleaved training stimuli in all phases. Data are collapsed across training order, and interleaved training trials are combined across tempi. Dashed horizontal line (d′ = 0) indicates chance performance; d′ = 3 is close to perfect performance.
Figure A4.
Figure A4.
Relationship between performance on probe trials (generalization) and interleaved training trials (learned discrimination) across birds that successfully completed all three training phases (N = 14). For each bird, data were combined across all three sound elements; each data point is the average performance across 240 probe stimuli (except for 216 probe trials for one female (inverted triangle), as noted in main text) and ~2000 interleaved training stimuli.
Figure A5.
Figure A5.
Reaction time (RT) across a broad range of tempi. Median reaction times for correct trials versus tempo during rule training for male (circles) and female (triangles) birds. Fitted quadratic curves for male (solid line) and female (dashed line) birds are plotted to illustrate the observed relationships.
Figure 1.
Figure 1.
Experimental design for testing the ability to flexibly perceive rhythmic patterns. (a) Normalized amplitude waveforms of isochronous (Iso) and arrhythmic (Arr) sequences of a repeated song element (sound B; see Appendix, Fig. A1) with 120 ms and 180 ms mean inter-onset interval (IOI). (b) Schematic of the protocol. After a pretraining procedure in which birds learned to use the apparatus (not shown), birds learned to discriminate between isochronous and arrhythmic sound sequences at 120 and 180 ms IOI, for sounds A, B and C (‘ABC training’, N = 6 females) or starting with sound C followed by sounds A and B (‘CAB training’, N = 7 females) (colour indicates sound type; see Appendix, Fig. A1). To test for the ability to generalize the discrimination to new tempi, probe stimuli (144 ms IOI) were introduced after birds had successfully completed two training phases. A subset of birds was then tested with a broader stimulus set using a novel sound element (sound D) and every integer rate between 75 and 275 ms IOI (‘rule training’; see Methods for details). (c) Comparison of training time (‘trials to criteria’) for male and female birds that completed rhythm discrimination training for all three phases. Data from male birds collected by Rouse et al. (2021) are shown for comparison.
Figure 2.
Figure 2.
Learning of rhythmic pattern discrimination and generalization to new tempi for female birds. (a) Learning curves for rhythm discrimination for a representative female bird (y7o97) across three training phases (ABC training) in 100-trial bins. Data are plotted until criterion performance was reached. Chance performance is indicated by the dashed horizontal line. Hit rate: proportion correct responses for isochronous stimuli (S+); CR: proportion correct rejections for arrhythmic stimuli (S−). (b) Results for rhythm discrimination training and probe testing for successful female birds (N = 7). Data to the left of the vertical dashed line show performance in the final 500 trials of the first rhythm discrimination training phase (no probe testing, see Fig. 1b). Data to the right of the vertical dashed line show performance during probe testing with stimuli at an untrained tempo of 144 ms IOI (light grey) and for interleaved training stimuli (dark grey). Symbols denote performance for each female (N = 3 probe tests/bird; 6 females were tested with 240 probe stimuli (triangles) and 1 female was tested with 80 probe stimuli for two sound types and 56 probe stimuli for the third sound type (inverted triangle)). Average performance across birds in each group is indicated by vertical bars. Filled symbols denote performance not significantly different from chance.
Figure 3.
Figure 3.
Comparison of generalization of rhythm discrimination by sex. Mean performance of all successful males (N = 7) and females (N = 7) during the last 500 trials of the first training phase and for probe and interleaved training stimuli in all phases. Data are collapsed across training order, and interleaved training trials are combined across tempi. Dashed horizontal line indicates chance performance. Filled symbols denote performance not significantly different from chance.
Figure 4.
Figure 4.
Accuracy of the learned discrimination across a wide range of tempi in male and female zebra finches. (a) Average performance of five female birds during the initial 1000 trials of ‘rule training’ with a novel sound element (sound D). Mean performance ± SD is plotted for 10 ms inter-onset interval (IOI) bins. Chance performance is indicated by the horizontal dashed line. Black asterisks indicate female performance significantly above chance (mixed-effect logistic regression: *P < 0.05; **P < 0.005; ***P < 0.001). Data from seven males from Rouse et al. (2021) are plotted for comparison (white asterisks denote performance significantly above chance). IOIs used in rhythm discrimination training phases before rule training are shown in bold and boxed on the X axis. (b–c) Average performance across all male and female birds in relation to the normalized pairwise variability index (nPVI) and the coefficient of variation (CV) of the IOI durations for tempi within the 95–215 ms IOI tempo range (ANOVA: P < 0.001).
Figure 5.
Figure 5.
Reaction times during rhythmic pattern discrimination and frequency discrimination tasks. Median reaction times for the final 500 responses in the first training phase are shown for three groups of birds. For rhythm discrimination, data are shown for birds that completed all three training phases (success: N = 7 males, 7 females) and birds that did not complete rhythm discrimination training (fail: N = 3 males, 6 females). A separate cohort of birds (N = 4 males, 6 females) succeeded at discriminating isochronous sequences that differed in frequency. The 500 ms period between trial start and activation of the response switch is indicated by the horizontal dashed line. Symbols indicate the median reaction time for each bird; bars indicate means of these values collapsed across sex. Asterisks indicate significant differences between groups (post hoc Dunn’s test with Bonferroni correction: *P <0.05; **P < 0.01).

Similar articles

Cited by

References

    1. Asokan MM, Williamson RS, Hancock KE, & Polley DB (2021). Inverted central auditory hierarchies for encoding local intervals and global temporal patterns. Current Biology, 31(8), 1762–1770. 10.1016/j.cub.2021.01.076 - DOI - PMC - PubMed
    1. Bååth R, Tjøstheim TA, & Lingonblad M (2016). The role of executive control in rhythmic timing at different tempi. Psychonomic Bulletin & Review, 23(6), 1954–1960. 10.3758/s13423-016-1070-1 - DOI - PubMed
    1. Benichov JI, Benezra SE, Vallentin D, Globerson E, Long MA, & Tchernichovski O (2016). The forebrain song system mediates predictive call timing in female and male zebra finches. Current Biology, 26(3), 309–318. 10.1016/j.cub.2015.12.037 - DOI - PMC - PubMed
    1. Berninger E (2007). Characteristics of normal newborn transient-evoked otoacoustic emissions: Ear asymmetries and sex effects. International Journal of Audiology, 46(11), 661–669. 10.1080/14992020701438797 - DOI - PubMed
    1. Blecher T, Tal I, & Ben-Shachar M (2016). White matter microstructural properties correlate with sensorimotor synchronization abilities. NeuroImage, 138, 1–12. 10.1016/j.neuroimage.2016.05.022 - DOI - PubMed

LinkOut - more resources